

 PDF
PDF ePub
ePub Citation
 Print
Print


Introduction
The surveillance system of contaminants in food is very important for consumer protection and international trade. The Joint FAO/WHO Expert Committee on Food Additives (JECFA) therefore set the guidelines for the dietary intake of chemical contaminants such as heavy metals [1-3]. The dietary exposure of the population to food contaminants can be assessed by different approaches including monitoring, total diet study (TDS), and bio-monitoring. The World Health Organization (WHO) supports TDS as one of the most cost-effective means for assuring that people are not exposed to unsafe levels of toxic chemicals through foods [4]. Dietary exposure in the TDS can be estimated by multiplying the levels of the analytes found by the amount consumed for each food. TDS samples representing the diet of the target population were prepared as a 'table-ready' state before analysis as the levels of chemicals in food could be changed, to some extent, through washing, peeling, and cooking [5,6]. In this regard, the TDS would reflect more accurate exposure levels of the food chemicals of interest compared to monitoring [4].
Of countries conducting the TDS for one year or longer, one of the food chemicals of interest has been heavy metals [7-14]. Metals that occur naturally in the earth's crust are released into the environment and subsequently contaminate foods through soil and air. They also enter food as a result of environmental contamination from industrial and agricultural processes. Bioaccumulation of these metals in the human body can result in a variety of metabolic and systemic dysfunctions and cancers [1,3]. From the viewpoint of the harmful effects of heavy metals on human health, total mercury and lead have been of particular concern in terms of food safety and public health [1,3]. Therefore, the JECFA established the provisional tolerable weekly intake (PTWI) for total mercury and lead based on the toxicological data and epidemiological studies.
Korea Food & Drug Administration (KFDA) has conducted the TDS as one of the surveillance programs to assess the potential health risk of hazardous materials through food consumption. In the Korean TDS (KTDS), heavy metals including total mercury and lead have been predominantly investigated since 2000 [15-23]. In the 2009 KTDS [23], 114 representative foods were selected from 559 foods appeared in the 2007 Korea National Health & Nutrition Examination Survey (KNHANES) [24] and analyzed for heavy metals. As only these 114 foods were used for the estimation of dietary exposure of Koreans to heavy metals, estimating total dietary exposure to heavy metals from all foods was not possible. In addition, as the 2007 KNHANES [24] was conducted in the latter half of year 2007, foods consumed only in spring and early summer were not included in this consumption data. To overcome these season-related limitations, Koh et al. [25] developed a food list for KTDS representing the typical diets of Koreans based on the 687 food items appeared in the dietary intake data of 2008 & 2009 KNHANES, which were the year-round survey with 18,022 respondents aged 1 year and older. Nevertheless, there was still a possibility of underestimation due to over 500 food items left out. To control for this type of limitation, Australian TDS (ATDS) [26] has adopted food mapping to estimate total dietary exposure to chemicals from all foods. In this method, foods reported as consumed in the food consumption data are matched to the representative foods based on the similarity using a so-called 'best-fit' approach. This conservative estimation is designed to ensure that the dietary intake assessment does not underestimate the intake of toxic chemicals.
The aim of this study was to devise measures for a closer-to-real estimate of total dietary exposure for Koreans from all foods reported in the 2007 KNHANES [24]. To accomplish this, we examined the feasibility of mapping foods appeared in the 2007 KNHANES to those representative foods used in the 2009 KTDS by comparing the simulated estimates with the original exposure estimates reported in the 2009 KTDS [23]. We used individual respondents' body weights to compute exposure on the basis of body weight and to draw a percentile distribution of population exposure as well.
Subjects and Methods
Food consumption data
The food consumption data was from the nutrition survey of the 2007 KNHANES [24] as was in the case of 2009 KTDS. The 2007 KNHANES was a nation-wide cross-sectional survey and conducted by the Ministry of Health and Welfare (MOHW) and the Korea Centers for Disease Control and Prevention (KCDC) from July to December of 2007. Dietary intake data were collected by trained interviewers (dietitians) using the 24-hour recall method from 4,099 individuals aged 1 year and older from a sample of 2,300 households [24]. This data contained dietary information including prepared dish names, ingredient food names, and food intakes along with demographic and anthropometric information.
Heavy metals in representative foods examined in the 2009 KTDS
The metal content of the 114 representative foods analyzed in the previous 2009 KTDS [23] were employed as the basis for that of mapped foods. In the 2009 KTDS [23], the representative food list was developed to include 66 food items up to 80% of cumulative intake, 27 items with a consumption frequency of 10% or higher, 10 items characteristic of seasons, age group, and energy contribution, and 11 items with high levels of heavy metals reported, from the 559 foods appeared in the 2007 KNHANES [24]. In that study, processed foods were purchased for 3 different manufacturers and raw commodity type ingredient foods were obtained in 3 different seasons including spring, summer, and fall. Each food was prepared or cooked using a typical cooking method, e.g. parboiling, boiling, steaming, pan-frying, stir-frying, deep-frying, blanching, grilling, broiling, and so forth when necessary, and tap water was used for washing, cooking, and preparing foods. Total mercury was analyzed using a total mercury analyzer (Nippon Instruments Corp., Japan) and lead was analyzed by Agilent 7500 inductively coupled plasma-mass spectrometry (ICP-MS) (Agilent Technologies Inc., USA).
Mapping method
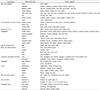
To examine the feasibility of food mapping in the KTDS, the 114 representative foods used in the previous 2009 KTDS were employed for mapping the other 445 foods out of the 559 foods appeared in the 2007 KNHANES [24]. All foods were mapped according to closeness in biological systematics and morphological similarity to representative foods in the 2009 KTDS [23]. Multiple foods within the same food group would be mapped to a single TDS food, in principle. Habitat of plants and aquatic living organisms was taken into consideration in mapping in order to minimize the possible differences in the metal content that would result from different environments. An example of mapping for individual KTDS food items is given in Table 1, showing that 122 food items out of the aforementioned 445 foods were matched to the most similar 38 representative foods among the 114 selected and used in the 2009 KTDS. Prepared dish names were used to group them by cooking method used for ingredient foods and this result was utilized in assigning food preparation/cooking methods to each ingredient food item.
Comparison of dietary exposure estimates of heavy metals with or without a so-called 'best-fit' mapping
The heavy metal content in each food was multiplied by the intake amount of foods reported in the 2007 KNHANES [24] at each individual level, and summed over all foods assessed to estimate the total dietary exposure to metals. Mean dietary exposure per capita was expressed in milligrams per day (mg per day) to compare with other countries' exposures. The percentage contribution of each food group to the total estimated exposure was calculated by dividing the sum of heavy metal intakes from foods in one food group with the total intake from all food groups, and multiplying this by 100. To estimate dietary exposures on a body weight basis, individuals' dietary exposure to heavy metals from all foods were divided by their own body weights. Of the 4,091 participants who responded in the 2007 KNHANES [24], body weight information was missing for 380 respondents. Therefore, 3,711 respondents were included in the determination of the population exposure distribution. Exposures estimates of heavy metals were expressed by µg/kg body weight/week to compare with the PTWI values established by the JECFA [1,2] and compared with the previous result from 2009 KTDS [23]. Also, the distribution of the population exposure estimates at the 1st, 5th, 10th, 25th, 50th, 75th, 90th, 95th and 99th percentiles were produced.
Results
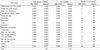
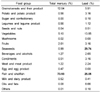
Daily dietary exposures to total mercury and lead were re-estimated after mapping and presented in Table 2. These re-estimates are approximately 50% higher than the original estimates reported in the 2009 KTDS [23], suggesting that the previous KTDS might have underestimated the dietary exposure of total mercury and lead. In particular, mapping resulted in the highest increase of dietary exposure to the two metals in the fish & shellfish group. Unlike lead, only four food groups including grains/cereals and their product, vegetables, fruits, as well as fish & shellfish contributed most to mercury intake (3.1 µg per day), amounting for 93.7% of the total intake (Table 2 and 3). The food group that made the greatest contribution to dietary exposure in regards to total mercury was fish & shellfish (73.93%), followed by grains/cereals and their product (12.04%). Meanwhile, the main dietary sources of lead were seaweeds (29.74%), fish & shellfish (25.05%), and vegetables (13.85%). The percentile distribution of population exposure calculated from individuals' food intake data and body weights is presented in Table 4. This allows the assessment of a potential health risk in high consumers. Mean exposure estimates were compared with the reference levels, although the PTWIs of total mercury and lead were withdrawn by the JECFA in 2010. Exposure to total mercury and lead were well below the PTWIs (Table 5). Mapping also enabled the presentation of dietary exposures by age groups, revealing a 2-fold difference among them (Table 6).
Discussion
As a prerequisite of mapping, formulating a representative food list from foods reported as consumed by the population is a critical step in order that all foods could be mapped to the appropriate foods. Foods reported in the 2007 KNHANES [24], which was conducted during the second half of the year, did not include some seasonal foods. As a result, the representative food list drawn from that survey result did not cover certain food groups such as mushrooms (Table 2). Nonetheless, our study examined the feasibility of mapping foods for KTDS within that context using foods analyzed in the 2009 KTDS [23] which is the most recent KTDS conducted in Korea.
Mercury has different toxicological properties depending on chemical forms. Methylmercury, one of the organic forms, is well known to be more toxic than inorganic forms. This is largely produced from the methylation of inorganic mercury by microbial activity, which is rapidly taken up and accumulated in seafood [27].
Excessive exposure to total mercury is associated with various adverse effects including neurological damage, kidney failure, and digestive tract inflammation [1]. Total mercury including organic and inorganic mercury was measured in the 114 representative foods in the 2009 KTDS [23]. The mean reestimates of total mercury exposure with mapping in this study was 0.0031 mg per day (Table 2), which was 44% higher than the original estimates (0.0022 mg per day) reported in the 2009 KTDS [23]. The level of exposure to total mercury estimated in this study is similar to that of the UK (0.0035 mg per day), but lower than that of Japan (0.009 mg per day), Chile (0.005 mg per day), and China (0.010 mg per day) [7,12-14]. In particular, the exposure to total mercury from the fish & shellfish group was estimated to be 0.0023 mg, an increase of 66.7% by mapping compared to the previous result (0.0015 mg per day) of the 2009 KTDS (Table 2). Since mushrooms were not included in the representative foods of the 2009 KTDS, foods in the mushroom group had difficulty in being mapped to the appropriate foods. This emphasizes the importance of the selection of representative foods considering 'best-fit' mapping suggested by Koh et al. [25].
It has been known that more than 80% of the mercury occurring in fish & shellfish group is organic forms, mostly methylmercury [28]. Assuming that 80% of the total mercury present in fish & shellfish is methylmercury, the average intake of methylmercury would be estimated to be 0.00184 mg per day. With the average body weight of Koreans being approximately 54.15 kg derived from the 2007 KNHANES [24], the methylmercury intake from the fish & shellfish group would be estimated as 0.238 µg/kg body weight/week, corresponding to 14.87% of the PTWI (1.6 µg/kg body weight/week) established by the JECFA in 2004.
A limited number of studies have reported the association between fish consumption and blood mercury levels [29-31]. Tsuji et al. [29] reported that total mercury levels in red blood cells were related to the frequencies of fish consumption in a week among 171 Japanese women (P = 0.035), but not among 98 Japanese men. The 120 Spanish people with the average daily fish intake of 73.9 g showed a statistically significant relationship (P = 0.0001) between fish consumption and mercury concentration in red blood cells [30]. Furthermore, blood mercury levels increased gradually by fish/shellfish consumption frequency in men (P = 0.0019) and women (P = 0.0002) in Pusan, a coastal city in Korea [31]. According to the 72nd report of the Joint FAO/WHO Expert Committee on Food Additives, the average dietary exposure to total mercury in the Japanese population (0.17 µg/kg body weight per day) was 4 times higher than that of the Korean population (0.04 µg/kg body weight per day) [32], even though fish supply was similar between the two populations (56.6 vs. 56.1 kg/capita/yr) [33]. In addition, the proportions of total mercury intake contributed by fish and shellfish were 92% and 76%, respectively [32]. As suggested by Tsuchiya et al. [34], fish species consumed mostly in the population would be more important than the amount of fish intake in the population of concern. The mean blood mercury level of Koreans was 3.80 µg/L in 2007 from a nationwide survey [35], quite lower than the reference values of the U.S. Environmental Protection Agency (EPA, 5.8 ppb in blood) or the Germany Commission on Human Biological Monitoring (CHBM, 15 ppb in blood).
From the public health point of view, it is important to pay attention to the population group with an intake that exceeds the PTWI. Unlike the previous KTDS, which used average intake data of each food and average body weight of the population, we used the individuals' food intake data with individuals' body weights. This method made a percentile distribution of total mercury exposure of the Korean population possible (Table 4), and that will enable the government or safety regulatory agency to identify the target population of concern. The mean dietary exposure estimate to total mercury is 0.382 µg/kg body weight/week, which is 7.64% of the PTWI (5 µg/kg body weight/week) withdrawn by the JECFA in 2010 (Table 5). Even the value at 99th percentile exposure is 2.461 µg/kg body weight/week, corresponding to 50% of the PTWI (Table 4). It seems that total mercury intake is not a matter of urgent safety concern in the Korean population.
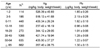
At the 72nd meeting of JECFA, they established the PTWI for inorganic mercury of 4 µg/kg body weight/week, which was considered applicable to dietary exposure to total mercury from foods other than fish & shellfish. The JECFA also set the upper limits for estimates of average dietary exposure to total mercury from foods other than fish & shellfish for adults (1 µg/kg body weight/week) and for children (4 µg/kg body weight/week) [1]. In the Korean population, dietary exposure to total mercury from foods other than fish & shellfish was estimated at 0.10 µg/kg body weight/week in this study, which is only 10.34% of the upper limit for adults. However, the 2009 KTDS reported only the mean exposure to total mercury using the mean body weight of general population. Therefore, no information on the exposure of different age groups was available. In the present study, using the individual body weight of respondents, mean dietary exposure of total mercury was calculated for 8 different age groups (Table 6). A higher intake of total mercury was estimated for the physiologically susceptible group of 5 years and under as compared to adults. This implies that there is a need to identify the major food sources of total mercury in children and infants and the forms of total mercury in Korean foods.
Lead has been used for a number of industrial, domestic, and rural purposes such as lead batteries and leaded fuel [1]. This can be leaked into the environment and subsequently contaminate crops and poultry through soil and air. Lead can also be unintentionally added to food during processing. Excessive exposure to lead is known to be associated with a wide range of effects, including neurotoxicity and hematological toxicity [2].
Compared with the daily intake of lead estimated in the 2009 KTDS [23], mapping resulted in a 53% higher estimate of dietary exposure to lead (Table 2). The mean daily lead intake of Koreans (0.0098 mg) was lower than that of Lebanese (0.0185 mg) and Japanese (0.02 mg) [14,36], but was higher than the 0.006 mg in the UK population [7]. Interestingly, mapping doubled the exposure from vegetables and fish & shellfish (Table 2). The contribution of each food group is given in Table 3. The main dietary sources of lead were seaweeds (29.74%) and fish & shellfish (25.05%). Unlike the exposure to total mercury, the vegetables group was a significant source of lead intake and contributed to 13.85% of the total exposure. Considering that the mean seaweeds intake of Korean population was 7.747 g per capita/day [24], a high contribution of seaweeds to lead exposure indicates that seaweeds contain higher amounts of lead. Therefore, high consumers of seaweeds would be advised to limit the consumption of seaweeds within a certain level.
The mean intake of lead estimated in the present study was 1.283 µg/kg body weight/week (Table 4), corresponding to 5.13% of the previously established PTWI of 25 µg/kg body weight/week (Table 5). The exposure to lead for high consumers was also below the PTWI. This suggests that average consumers and high consumers are not likely to experience undesirable health effects due to lead exposure.
In 2010, the JECFA noted that the previously established PTWI of 25 µg/kg body weight/week is associated with a decrease of at least 3 intelligence quotient (IQ) points in children and an increase in systolic blood pressure of approximately 3 mmHg in adults [2]. They therefore concluded that their PTWI could no longer be considered health protective and it was not possible to establish a new PTWI that would be health protective as the dose-response analyses do not provide any indication of a threshold for the key adverse effects of lead [2]. In this study, the estimated mean dietary exposure of lead was relatively higher in the physiologically susceptible population aged 11 years and younger among 8 age groups (Table 6). Taking into consideration that there is no reference safe level for lead, the exposure to lead should be minimized, particularly in infants and young children.
In conclusion, dietary exposure estimates to total mercury and lead using the mapping method and the metal content in the 114 representative foods analyzed in the 2009 KTDS resulted in a 50% increase in total dietary exposure estimates to total mercury and lead compared to the previous estimates in the 2009 KTDS, suggesting a possibility of under-estimation in the previous results. This is the first study ever attempted in Korea to overcome the chronic problem of under-estimating exposure to heavy metals through foods. Although this study has a limitation that the best mapping was not possible due to some missing food groups among representative foods, it is still effective in showing how much can be done in terms of risk management by adopting the mapping method. Using the intake data of each food item, mapping allowed the estimation of total dietary exposure to individual heavy metals from all foods reported in the food consumption survey. In addition, this combined with an individuals' own body weight enabled the drawing of population exposure distributions to toxic chemicals. As a result, it could make the regulatory agencies competent of identifying the subpopulations that are possibly at high risk.


 XML Download