

 PDF
PDF ePub
ePub Citation
 Print
Print


Introduction
Dietary pattern analysis has drawn considerable attention in studies to examine the relationships between diet and disease, as it measures the effect of the overall diet beyond that of single foods or nutrients. Among large-scaled prospective studies, Hu et al. [1] identified a Western vs. a prudent pattern in the U.S. population and reported that the Western pattern was associated with increased risks and that the prudent pattern was associated with decreased risks for cardiovascular disease [1,2] and diabetes [3]. Along with that study, several other Western studies [4-7] have focused on Western and prudent/healthy dietary patterns associated with risk factors for diabetes, cardiovascular disease, and metabolic syndrome.
However, Asian countries have a different dietary culture, although the Western pattern has emerged in the Asian population, yet it differs from that of the Western population because staple foods such as rice are still major sources in the diet. With rapid economic growth, Western patterns among Asian populations, characterized by increased consumption of animal food including meat, bread, and butter as well as sweet desserts, have shown inconsistent relationships with metabolic risk factors, although it is difficult to compare studies due to different dietary pattern analysis methodologies. A Western pattern was associated with higher total, high density lipoprotein (HDL)-, and low density lipoprotein (LDL)-cholesterol in the Japanese population [8] and a meat-rich pattern was associated with an increased risk for diabetes in the Chinese population [9]. A meat and alcohol pattern was associated with elevated fasting glucose and serum triglycerides in the Korean population [10]. In contrast, a westernized breakfast pattern was associated with a reduced risk for elevated glycated hemoglobin concentrations (≥ 5.5%) in the Japanese population [11] and a Western pattern was associated with reduced risks for elevated fasting glucose and low HDL-cholesterol in Korean women [12].
Among these inconsistent findings, the quantity and quality of carbohydrate intake contributes to metabolic abnormalities, as the Asian diet is typically a high carbohydrate diet, which can raise fasting glucose and triglycerides but reduce HDL-cholesterol. Among several studies on dietary carbohydrates, the glycemic index (GI) was reportedly associated with metabolic risk factors in Asian populations [13-15], but no study has been conducted on dietary patterns based on carbohydrate nutrition.
A recently proposed method of dietary pattern analysis is reduced rank regression (RRR), which uses intermediary information that best explains the variance in a set of response variables selected with prior knowledge [16,17]. The RRR identifies dietary patterns that explain a combined set of known risk factors and the findings on the association between dietary patterns identified and chronic disease risk provides important information for a disease prevention strategy. Hoffmann et al. [18] derived dietary patterns using percentages of energy from saturated fat, polyunsaturated fat, protein, and carbohydrate as response variables, and those patterns were associated with all-cause mortality. McNaughton et al. [19] identified a dietary pattern using fasting glucose and fasting insulin as response variables and that pattern was associated with type 2 diabetes.
Thus, we applied RRR to identify specific dietary patterns in an Asian population. The aim of this study was to identify dietary patterns that explain the maximal variation in carbohydrate quantity and quality and to examine the relationship between dietary patterns and metabolic risks for dyslipidemia and diabetes among the Korean adult population.
Subjects and Methods
Study subjects
This study was based on data from the Fourth Korea National Health and Nutrition Examination Survey in 2007-2009. Among 24,871 eligible subjects who participated in the survey, those who were aged at least 20 years old were included in data analyses. We excluded subjects with incomplete information on sociodemographic and health-related variables, blood samples, and dietary intake. Subjects who had extreme energy intakes (< 500 or > 5,000 kcal/day) were also excluded. In addition, we excluded subjects with previous diagnoses of diabetes, hypertension, or dyslipidemia and those who had taken medications to lower serum lipids, blood glucose, or blood pressure to avoid the effects of treatment or intervention by related disease, as they were considered to have made changes in their diet. The remaining 9,725 subjects (3,795 men and 5,930 women) were included in the final analyses. This study protocol was approved by the Ministry of Health and Welfare in Korea. All subjects in the survey participated voluntarily, and written informed consent was obtained from all subjects.
Definition of metabolic risk factors
Blood glucose and lipid indicators were chosen as the metabolic risk factors. Blood samples were collected in the morning after fasting for at least 8 hours. Fasting blood glucose, total cholesterol, triglycerides, and HDL-cholesterol were analyzed in a central, certified laboratory.
Impaired fasting glucose was defined as fasting blood glucose of 100-125 mg/dL and diabetes as fasting blood glucose ≥ 126 mg/dL by the American Diabetes Association [20]. The definition of dyslipidemia provided by the National Cholesterol Education Program was used: 1) hypercholesterolemia as total cholesterol ≥ 240 mg/dL, 2) hypertriglyceridemia as triglycerides ≥ 200 mg/dL, 3) low HDL-cholesterol as HDL-cholesterol < 40 mg/dL in men and < 50 mg/dL in women [21].
Measurement of dietary intake
Dietary intake information was obtained through a 24-hour recall method. The food items appearing in this study were categorized into 18 common food groups based on a Korean nutrient database. However, the grain group was further divided into four subgroups to examine types of staple foods in detail: 1) white rice, 2) other grains, 3) bread and snacks, and 4) noodles and dumplings. Kimchi (traditional fermented cabbage) in the vegetable group was separated into a single food group, as it is traditionally served as a single side dish [22], resulting in 22 food groups.
GI values were obtained from published values or imputed when necessary by matching similar foods based on calories, carbohydrate, and dietary fiber content to evaluate carbohydrate quality. Among 662 (total of 1,088) food items appearing in this study, the GI values for 209 food items (31.6%) were estimated from international GI tables [23,24]. The other four food items (0.6%) were estimated from data based on Asian foods [15,25]. The remaining 449 (67.8%) food items had no GI values, because these foods contain little or no carbohydrates, and thus the GI values of these foods was assigned zero. The reference for the GI values was glucose. The glycemic load (GL) is an indicator that reflects both the quantity and quality of carbohydrates [26]. GL was calculated by multiplying the GI value of the food by the amount of carbohydrate consumed, and then dividing by 100 [24].
Assessment of dietary patterns
Dietary patterns were generated by RRR, which identifies linear combinations of predictor variables that explain as much response variables variation as possible, whereas factor analysis determines linear functions of predictor variables by maximizing the explained variation of all predictor variables [16,17].
We used standardized daily intake of the 22 food groups as predictor variables and selected four dietary factors: 1) total energy intake (kcal/day), 2) total carbohydrate intake (g/day), 3) percentage (%) of energy from carbohydrate, and 4) GI, as the set of response variables. The response variables were based on dietary variables representing carbohydrate quantity (total carbohydrate intake and percentage of energy from carbohydrate) and quality (GI). Additionally, total energy intake, which represents the entire diet quantity, was added to the response variables to obtain dietary patterns that would explain the variation in energy intake, which is highly composed of and correlated with carbohydrate intake in the Korean diet.
We considered the proportion of variance explained by each dietary pattern to determine the number of patterns to retain. The four patterns obtained from RRR explained 41.7%, 24.6%, 4.3%, and 0.008% of the total variation of a set of all four response variables, respectively, and, therefore, the first two patterns were retained.
Measurements of other variables
Information about sociodemographic (e.g., sex, age, household income, and education) and health-related variables (e.g., history of disease, medication use, smoking status, alcohol use, and physical activity) were obtained through a health interview survey [27].
Age was divided into groups of 20-29, 30-49, 50-64, and ≥ 65 years. Household income was divided into low, medium, and high groups. Education was categorized as elementary, secondary, and college or more. Smoking status was classified as never smoked, past smoker, or current smoker. Current alcohol use was assigned "yes" if a subject drank a glass of alcohol or more per month over the previous year. Physical activity was assigned "yes" if a subject engaged in physical activity at least 3 days or more per week at high intensity over the previous week. Height and weight were obtained using standardized techniques and calibrated equipment. Body mass index (BMI) was calculated as body weight (kg) divided by squared body height (m2).
Statistical analysis
All statistical analyses were performed using SAS software version 9.1 (SAS Institute, Cary, NC, USA). RRR was employed using the PLS procedure in SAS to derive the dietary patterns. The application of this method for a dietary pattern analysis was described in detail elsewhere [16]. The dietary pattern scores were calculated for all subjects and divided into quintiles.
Distribution (%) of sociodemographic and health-related variables across quintiles of dietary pattern scores were tested using the Mantel-Haenszel chi-square test. The general linear model was used to test for significant trends in mean nutrient intake across quintiles of dietary pattern scores. Multivariate logistic regression was performed to estimate the odds ratios (ORs) and 95% confidence intervals (CIs) for diabetes and dyslipidemia across quintiles of dietary pattern scores, taking the lowest quintile group as the reference group. Age (continuous), household income (low, medium, or high), education (elementary, secondary, or college or more), BMI (continuous), smoking status (never, past, or current), current alcohol use (yes or no), and physical activity (yes or no) were considered potential confounding variables, so these were adjusted in all models. Subsequently, scores of two dietary patterns were mutually adjusted in multivariate logistic regression models, because one could explain the association for the other pattern.
Results
Dietary patterns
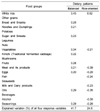
The factor loadings of the food groups by dietary patterns are provided in Table 1. The most important contributor was white rice in the two dietary patterns (factor loading was 0.43 in the balanced pattern; 0.52 in the rice-oriented pattern). The first pattern was characterized by high positive loading for bread, noodles, vegetables, fruits, meat, eggs, and oils and was named the "balanced pattern". The second pattern had only white rice with a positive loading and others items such as vegetables, meat, eggs, fish, and dairy products were inversely correlated with the pattern scores, so it was named the "rice-oriented pattern".
Characteristics across quintiles of dietary patterns
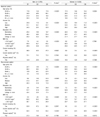
The sociodemographic and health-related variables of the study subjects across quintiles of dietary pattern scores are described in Table 2. In both men and women, subjects with a higher score for the balanced pattern were more likely to be younger, have a higher income, be more educated, and smoke less. The balanced pattern was also associated positively with BMI and physical activity in men and inversely with alcohol use in women. Men with a higher score for the rice-oriented pattern were more likely to be older, have a lower income, be less educated, be less obese, and drink less, whereas women with a higher score for the rice-oriented pattern were more likely to be older, have a lower income, be less educated, more obese, smoke less, drink less, and be less physically active.
Nutrient intakes across quintiles of dietary patterns
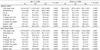
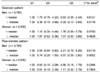
The mean nutrient intake of the study subjects across quintiles of dietary pattern scores are presented in Table 3. Energy intake increased but GI decreased when total carbohydrate (g/day) and GL increased across quintiles of scores in the balanced pattern. In contrast, GI increased when total carbohydrate (g/day) and GL increased across quintiles of scores in the rice-oriented pattern. The percentages of energy from carbohydrates, fat, and protein in the highest quintile of the balanced pattern were 66.3%, 18.7%, and 14.9% in men and 69.7%, 16.5%, and 13.8% in women, respectively. However, the percentages of energy from carbohydrates, fat, and protein in the highest quintile of the rice-oriented pattern were 78.2%, 10.1%, and 11.6% in men and 80.0%, 8.9%, and 11.1% in women, respectively.
Association of dietary patterns with diabetes and dyslipidemia
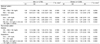
The multivariate adjusted ORs (95% CIs) for diabetes and dyslipidemia across quintiles of dietary pattern scores are presented in Table 4. After adjusting for potential confounding variables, the rice-oriented pattern was significantly associated with a higher prevalence of hypertriglyceridemia in men (OR for highest quintile, 1.58; 95% CI, 1.20-2.09; P for trend, 0.0042) and low HDL-cholesterol in men (OR for highest quintile, 1.43; 95% CI, 1.12-1.82; P for trend: 0.0015) and women (OR for highest quintile, 1.29; 95% CI, 1.08-1.55; P for trend: 0.0020). The balanced pattern was not associated with diabetes or dyslipidemia after adjusting for potential confounding variables. However, men with an median energy intake level of ≥ 2,089 kcal showed a significantly reduced prevalence of diabetes across quintiles of the balanced pattern scores (OR for highest quintile, 0.29; 95% CI, 0.10-0.83). No association was observed when energy intake was below the median level in men (Table 5). In the rice-oriented pattern, men with an energy intake below the median level had a significantly increased trend of prevalence for diabetes (P for trend: 0.0110). The two dietary patterns were not associated with diabetes by energy intake level in women.
Discussion
In this study, two dietary patterns, termed balanced and rice-oriented, were identified using RRR. The rice-oriented pattern was significantly associated with an increased prevalence of dyslipidemia in both men and women. In men, the balanced pattern was associated with reduced prevalence of diabetes when energy intake was above the median, whereas the rice-oriented pattern was associated with increased prevalence of diabetes when energy intake was below the median.
Different from previous studies of dietary patterns for Asian populations, we derived dietary patterns focusing on carbohydrate nutrition. White rice was a major contributor in both patterns, although with different carbohydrate quantity and quality, reflecting the Asian diet quite well.
Our most interesting finding was that men in the highest quintile of the rice-oriented pattern, characterized by high white rice intake and low intake of other foods, had a 58% increased prevalence of hypertriglyceridemia and a 43% increased prevalence of low HDL-cholesterol compared to those in the lowest quintile, whereas the balanced pattern, characterized by high intake of various kinds of foods, was not associated with dyslipidemia. Women with a higher score for the rice-oriented pattern were also positively associated with low HDL-cholesterol.
White rice is associated with an increased risk for diabetes in Japanese [28] and U.S. individuals [29], and ischemic stroke in the Chinese [30]. Given that white rice was the highest loading in both patterns, meal composition would be more influential than white rice intake itself. In the Korean diet, rice, soup, and side dishes are a typical meal, and the type of food in these side dishes would be a core factor for diet variation. The balanced pattern included vegetables, fruits, and dairy products, which beneficial for health, whereas the rice-oriented pattern had low consumption of these foods. Several prospective studies [31-33] have suggested that intake of vegetables, fruits, and dairy products are inversely related to risks for metabolic abnormalities such as diabetes, dyslipidemia, and metabolic syndrome.
In our study, the two dietary patterns differed in carbohydrate quantity and quality. Subjects in the highest quintile of the rice-oriented pattern showed lower energy and total carbohydrate intake but higher GI and percentage of energy from carbohydrate than those in the highest quintile of the balanced pattern.
High carbohydrate intake or a high GI diet has adverse effects on serum lipid levels and glucose metabolism [13,15,34-36], which are likely due to increase risks for metabolic abnormalities such as diabetes [37,38] and cardiovascular disease [39]. Although many studies have reported a positive association between GI and diabetes, two large cohort studies [40,41] did not find any association between GI and diabetes incidence. Considering that GI alone cannot fully explain the effects of diet on metabolic abnormalities, dietary pattern, which captures the overall quality of the diet, would be more important than solely a high carbohydrate diet or a high GI diet.
We also found that the balanced pattern was associated with reduced prevalence of diabetes under high energy intake, whereas the rice-oriented pattern was associated with an increased prevalence of diabetes under low energy intake in men. We have no clear answer for the favorable effects of the balanced pattern when energy intake was only above the median. The protective effect of the balanced pattern on diabetes may represent the beneficial effects of a variety of nourishing foods and a low GI diet on glucose metabolism. A possible explanation is that if energy intake is low, it represents that overall nutrition status is poor. According to Choi and Kim [42], total energy and intake of particular micronutrients were significantly lower among diabetic patients than non-diabetics in the Korean population. Another study [43] showed significantly low intakes of energy, carbohydrate, potassium, riboflavin, niacin, and dietary fiber among hyperinsulinemic individuals. Slabber et al. [44] concluded that optimal nutrition might play an important role in the prevention of diabetes mellitus. This supports the notion that the balanced pattern would be effective to reduce risk of diabetes if proper energy intake is provided.
This study had several limitations. First, the cross-sectional design made it difficult to examine the causal relationships between dietary patterns and metabolic abnormalities. Rather, this study represents more of a hypothesis-generating approach. Second, we used dietary data from a single 24-hour recall, which might not represent usual intake. Third, the GI calculation was based on international tables in which most foods were derived from Western countries. The development or validation of GI values for Korean foods is necessary in the near future.
Regardless of these limitations, to our knowledge, this is the first study to derive dietary patterns using the RRR method based on carbohydrate-related dietary factors in an Asian population. Factor analysis derives dietary patterns by maximizing the explained variation of all predictor variables, whereas RRR provides linear functions of predictor variables that explain as much of the variation in response variables (e.g., biomarkers or nutrients) as possible [16]. The RRR method has an advantage to combine dietary information with prior knowledge about the pathway from diet to disease. Thus, the RRR method may be a useful tool for identifying dietary patterns related to the risk for diabetes or dyslipidemia. This study also included a relatively large representative sample of the Korean population, so it captured an entire spectrum of carbohydrate intake and serum indicators. Additionally, we excluded subjects who had been previously diagnosed or treated for diabetes, dyslipidemia, or hypertension, so that our results would be meaningful to provide proper nutrition information for healthy adults to prevent chronic disease.
In conclusion, we derived two dietary patterns based on carbohydrate quantity and quality among the Korean adult population. The rice-oriented pattern was associated with increased risk for dyslipidemia whereas the balanced pattern was associated with reduced risk for diabetes when energy intake was adequate. Our findings imply that dietary patterns based on carbohydrate nutrition should be considered together with other foods consumed rather than considering the sole effect of a single food item such as white rice. Further prospective or intervention studies are necessary to confirm our findings.
 XML Download