

 PDF
PDF ePub
ePub Citation
 Print
Print


Introduction
Regular meal eating of three meals a day with balanced nutrition is essential for optimal growth and development in children [1]. The family dinner is related to increased intake of healthy foods such as fruits, vegetables, and dairy foods [2]. High-calorie sweet beverages or fast foods are consumed more during meal skipping, because calories that should be ingested in one meal increase [3]. When poor eating behavior continues, excessive energy intake can be accompanied by decreased intake of dietary fiber and micronutrients, resulting in possible threatening of children's health [4].
Consuming regular meals also has a beneficial influence on study performance and grade of the student [5,6]. In particular, intake of breakfast greatly helps improve memory in children with a risk for nutrient deficiency [7], and the school breakfast program contributes to improve class attendance and academic performance [5,8].
The incidence of obesity in children and adolescents has increased around the world [9]. Obesity in childhood can increase the chance of acquiring metabolic syndrome [10] and the probability of obesity in adulthood [11]. According to the most recent 1998-2007 Korean National Health and Nutrition Examination Survey, the proportion of obese teens doubled from 5.4% to 10.3% [12]. The average incidence of metabolic syndrome in Korean teens is only 4.2%, but that of obese teens is significantly higher at 31.3% [13].
Meal skipping is related to obesity in many studies conducted abroad [14-16]. The body mass index (BMI) and body weight of children skipping breakfast is higher than in those who eat breakfast [1,17,18]. Additionally, obese children show higher rates of meal skipping compared to non-obese children [19,20]. The reason for obesity due to meal skipping might be related to the observation that children do not select healthy foods or have poor eating habits [3,21].
Nutrition labeling provides proper nutrition information to consumers and helps with reasonable food selection and health management by labeling the type and amount of nutrients in processed foods [22]. "High-calorie low-nutritional value food" is a type of nutrition labeling in Korea that is marked on processed foods due to concerns of developing obesity or nutritional imbalance [23]. A correct understanding of nutrition labeling may help students to prevent obesity through wise selection of healthy foods.
The relationship between meal skipping and risk of obesity has been studied intensively abroad, but that relationship has not been investigated nationwide in Korean children. Therefore, the purpose of this study was to investigate the relationship between meal skipping and prevalence of obesity in Korean children. We hypothesized that meal-skipping students select healthy foods less frequently and have a lower degree of understanding of nutrition labeling compared to those of regular meal eating students. To test this hypothesis, we divided subjects into a meal skipping group (MS) and a regular meal eating group (RM) and investigated the differences in children's food intake frequency from several food groups, the degree of nutrition labeling understanding, and obesity prevalence.
Subjects and Methods
Subjects and survey methods
This study used data from the 2010 national survey on the "Children's perception and practice level of dietary life" [24]. The survey was conducted in 2,335 (1,141 boys, 48.2% and 1,194 girls, 51.8%) fifth grade students in 118 elementary schools selected from 16 metropolitan local governments by stratified cluster sampling. The survey was conducted between June and July 2010 by personal interview through visits to each school by trained interviewers.
The survey questionnaire included meal intake frequency for breakfast, lunch, and dinner for 1 week and the food intake frequency of fruits, vegetables, kimchi, white milk, flavored milk, pizza, hamburgers, fried chicken, soft drinks, instant noodles, crackers, and chocolate. A visual measure was presented for foods to reduce differences in serving size quantities among individuals [14].
Multiple choice questions on the understanding of nutrition labeling and high calorie foods with low nutritional value were also included in the survey questionnaire. To investigate the degree of understanding of nutrition labeling, the question "What is the nutrient that obese people should carefully check on the nutrition label of a food package?" was included. In addition, to identify the degree of recognition for 'high calorie foods with low nutritional value', the question "A high calorie food with low nutritional value is a food that has higher calories and lower nutritional value than general foods and that is related to developing obesity or nutritional imbalance. What is the lowest nutrient in a high calorie food with low nutritional value?" was included.
For meal intake frequency, the frequency of 6-7 times per week was converted to 6.5 times/week, 3-5 times per week was converted to 4 times/week, 1-2 times/week to 1.5 times/week, and no intake to 0 time/week. For the evaluation of food intake frequency for fruits, vegetables, milk, fast-food, and soft drinks during the past week, the frequency of more than twice a day was converted to 2 times/day, once per day to 1 time/day, once every other day to 0.5 times/day, 1-2 times a week to 0.21 times/day, and no intake to 0 times/day.
BMI was calculated from self-reported weight and height obtained from the questionnaires. The percentile for BMI-for-age was calculated. Underweight was defined as a BMI < 15th percentile, normal weight was ≥ 15th percentile and < 85th percentile, overweight was ≥ 85th percentile and < 95th percentile and obesity was ≥ 95th percentile using the age- and sex-specific BMI cutoff points proposed by the Korean Centers for Disease Control and Prevention [25].
The subjects were divided into two groups based on intake of a three regular meal per day pattern. The RM group included those who answered "6-7 times a week" to all three questions that asked how often they ate breakfast, lunch, and dinner. The others were placed into the MS group. The number of subjects in the RM group was 1,476 (64.2%) and that in the MS group was 859 (35.8%).
Statistical analysis
All analyses were conducted using a survey weighting to account for the survey design, which consisted of stratified cluster samples. Probability sampling weights were used in conjunction with strata and primary sampling units to apply weight to the data analysis. The collected data were used to calculate the percentage or mean and standard errors using the SAS 9.12 (SAS Institute, Cary, NC, USA) and SUDDAN 10.0 programs. The difference between groups for food intake frequency was analyzed using Student's t-test, and the frequency difference between the groups for nutrition labeling and high calorie foods with low nutritional value was analyzed using the χ2-test. Statistical significance was verified at the α = 0.05 level.
Results
Meal regularity of the subjects
Meal intake frequency of the subjects is shown in Table 1. The average meal intake frequency in all subjects was 5.55 times/week for breakfast, 6.15 times/week for lunch, and 6.14 times/week for dinner. While the RM group had all meals 6-7 times/week, the MS group showed 3.85 times/week for breakfast, 5.53 times/week for lunch, and 5.5 times/week for dinner.
Daily food intake frequency by meal regularity
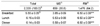
The daily intake frequency of healthy foods such as fruits, vegetables, and milk is shown in Table 2. The daily food intake frequency was 0.71 times for fruit, 1.32 times for kimchi, and 1.03 times for vegetables, except kimchi. Thus, the intake frequency of all vegetables including kimchi was 2.35 times/day. Daily intake of milk was 0.92 cup (200 ml basis) for white milk and 0.21 cup for flavored milk, adding up to 1.13 cups/day.
The daily intake frequency of fruit was 0.62 times in the MS group, which was significantly lower compared to 0.76 times in the RM group (P < 0.001), and the daily intake frequency of kimchi and other vegetables was 1.21 and 0.92 times, respectively, in the MS group, which was lower compared to the 1.38 and 1.09 times, respectively, in the RM group (P < 0.001). The average daily intake amounts of white milk were 0.84 cup in the MS group, which was significantly lower compared to the 0.97 cups in the RM group (P < 0.001), but that of flavored milk was 0.23 cups in the MS group, which tended to be higher than the 0.19 cups in the RM group, but the difference was not significant.
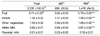
The daily intake frequency of fast-food, soft drinks, and high-calorie snacks is shown in Table 3. The average daily intake of pizza was 0.08 times, hamburgers 0.07 times, fried chicken 0.12 times, soft drinks 0.22 times, instant noodles 0.20 times, and crackers and chocolate 0.25 times, showing frequent intake of fast-food and snacks in the order of cracker and chocolate > soft drinks > instant noodles > fried chicken > pizza > hamburgers. Eating frequency was slightly higher in the MS group for pizza, hamburgers, fried chicken, crackers, and chocolate, compared to that in the RM group but the difference was not significant. In contrast, the frequency of soft drink and instant noodle (ramyeon) intake was 0.25 and 0.23, respectively, in the MS group, which was significantly higher compared to the 0.2 and 0.18, respectively, in the RM group (P < 0.01).
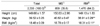
Understanding of nutrition labeling and high calorie foods with low nutritional value
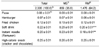
The understanding of nutrition labeling and high calorie foods with low nutritional value is shown in Table 4. Subjects were asked for the nutrient that obese individuals should check carefully to confirm whether they properly understand the nutrition labeling and only 39% of the subjects correctly answered. The proportion of correct answers for understanding nutritional labeling was significantly lower in the MS group (35.3%) compared to that in the RM group (40.7%) (P < 0.05).
The proportion of correct answers for the question of high calorie foods with low nutritional value was 40.2% and, overall, the correct understanding of high calorie foods with low nutritional value was insufficient in the study subjects. The MS group (35.6%) had a significantly lower degree of understanding for high calorie foods with low nutritional value compared to that in the RM group (42.7%) (P < 0.01).
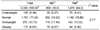
Anthropometric measurements
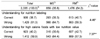
Anthropometric measurements of the students are shown in Table 5. The average height and weight of the students were 149.7 cm and 39.5 kg, and the average BMI was 18.48 kg/m2. No difference in height was observed between the two groups, but weight was significantly (P < 0.01) greater in the MS group. BMI in the MS group was also significantly higher than that in the RM group.
The distribution of student obesity is shown in Table 6. A total of 5.36% of the study subjects were underweight, 77.24% were normal (non-obese), 10.73% were overweight, and 6.67% were obese. The distribution of obesity was significantly (P < 0.05) different between the two groups and the MS group (8.97%) had a higher percentage of obese subjects than that in the RM group (5.38%).
Discussion
This study was performed to investigate differences in food choice, understanding of nutrition labeling, and prevalence of obesity due to meal skipping in Korean children. The criteria for meal skipping are different among investigators [14] and, in this study, subjects who had at least one meal less than five times/week were assigned to the MS group. The MS group showed an average eating frequency of 3.85 times/week for breakfast and 5.53 and 5.50 times/week for lunch and dinner, respectively. The reason for meal skipping was not asked in this study, but in other studies, the main reason for skipping breakfast was due to "no appetite" or "no time to eat". "Too much snack consumption" was provided as the reason for skipping lunch and "weight control" was added as the reason for skipping dinner [26-28].
The frequency of three meals/day in Korean elementary students has varied depending on survey year. In a 1998 survey (n = 2,433), with the influence of International Monetary Fund in Korea, the proportion of children eating breakfast everyday was 64%, eating lunch was 82.5%, and eating dinner was 54.3% [29]. In a 2002 survey (n = 544), the proportion of students eating breakfast everyday was 68.9%, lunch 91.7%, and dinner 81.1%, showing an overall increase of meal intake frequency [30]. In the present 2010 nationwide survey, the proportion of students eating breakfast everyday was 73.5%, eating lunch was 88.0%, and eating dinner was 87.7%. Therefore, the proportion of students eating breakfast and dinner every day has increased, but the students eating lunch every day decreased slightly compared to that in 2002. It is difficult to identify the reasons for the decreased percentage of students eating lunch every day. It was thought that it was not related to weekdays when lunch was eaten at school but was related to weekends when lunch might be skipped due to late breakfast with the family.
The dietary reference intakes for Koreans (KDRI) recommend that elementary school children should eat one serving of fruit, five servings of vegetables, and two servings of milk/day [31]. However, in this study, students reported 0.71 servings of fruit, 2.35 servings of vegetables, and 1.13 cups of milk/day, which is insufficient compared to the amounts recommended for elementary school students by the KDRI. A detailed dietary intake survey was not conducted in this study, but an effort is needed to provide more fruits, vegetables, and dairy products to children during meals in the future.
The MS group had a lower intake frequency of fruits, vegetables, and milk compared to those in the RM group. Other studies have also reported that children skipping meals show insufficient daily intake for fruits and vegetables compared to children eating meals [32], significantly lower mean adequacy ratio for micro-nutrients [33], or decreased dietary variety scores [34].
As meal skipping increases, the quality of meals become poorer, hunger is aggravated, and excessive eating occurs during the next meal [35,36]. Breakfast skipping is related to increased consumption of soft drinks and French fries [37] as well as increased snack intake [38]. In adolescents, breakfast skipping is related to skipping other meals, which directly worsens improper food intake [39]. Additionally, the possibility of eating a ready-made dinner with lower nutritional quality increases when children do not eat dinner with the family [40]. In this study, the intake frequency of instant noodles (ramyeon) and soft drinks was higher in the MS group than that in the RM group, suggesting the possibility of contributing to high-energy and high-sugar intake.
The degree of accurate nutrition labeling understanding and high calorie foods with low nutritional value was only 38.7% and 40.2%, respectively, of all students surveyed. Thus, more efforts are needed so that children understand nutrition labeling and select more proper foods to manage their health. The degree of an accurate understanding of nutrition labeling was lower in the MS group than that in the RM group. A better understanding of nutrition labeling may help students who skip meals to prevent obesity through wise selection of healthy foods.
Meal skipping can influence the incidence of childhood obesity [14-18]. Several studies on meal skipping have reported the effect of skipping breakfast on health [3,4]. In those studies, children who skipped breakfast had higher BMIs than those who ate breakfast [1,17,18,41]. The 1996-2006 National Health and Nutrition Examination Survey in the USA showed that 9-13 year old children who skipped breakfast had higher BMIs, greater waist circumference, and high prevalence of obesity for their age compared to those who ate breakfast [1,42]. Breakfast skipping from childhood to adulthood increases not only the obesity rate but also fasting blood insulin and cholesterol levels, suggesting that meal skipping can cause obesity and related abnormal blood metabolism [4,43]. In our study, the average BMI in the MS and RM groups was 18.31 and 18.78, respectively, which was within the normal range for children. However, the proportion with a BMI > 95th percentile was 8.97% in the MS group, which was significantly higher than the 5.38% in the RM group, suggesting that meal skipping affects obesity prevalence in Korean children.
This study had several limitations. First, because skipping breakfast, lunch, or dinner was categorized as the MS group and analyzed for differences in food intake frequency pattern with a three-meals-eating group, the characteristics of each meal skipped were not investigated. Second, the BMI was based on self-reported measures of weight and height. Third, the observed difference in food intake frequency and obesity due to meal skipping was based on data from a cross-sectional study. Therefore, causality between breakfast skipping and weight status cannot be established. A follow-up study is needed to assess long-term outcomes of meal regularity on obesity and health of Korean children.
In conclusion, meal skipping was related to obesity in Korean elementary students, which was related to the finding that students with an irregular meal eating pattern selected unhealthy foods more often and did not understand nutrition labeling compared to those with a regular meal eating pattern. The development and distribution of customized nutrition education is needed to inform students of the importance of regular meal eating, to recommend adequate intake of fruits, vegetables, and dairy products, and to understand nutrition labeling correctly.
 XML Download