

 PDF
PDF ePub
ePub Citation
 Print
Print


Introduction
There has been increasing interest in analyzing dietary factors associated with obesity and chronic degenerative diseases in view of dietary patterns, rather than a single nutrient, food, or a group of foods (Hu, 2002; Kant, 2004; Randall et al., 1990; Randall et al., 1992). People consume foods as meals which are the combination of various foods and nutrients, not as an independent nutrient or food. Moreover, roles of non-nutrients, such as phytochemicals contained in plant foods have emerged to be relevant to chronic disease risk (Craig, 1997). Thus assessment of the food intakes as a whole through identifying dietary patterns may allow us to have inclusive and practical information for research on diet and health, and for developing dietary guidelines to prevent diseases. There were many studies that identified major dietary patterns and determined their relationships with nutritional adequacy or with obesity and disease risks (Beaudry et al., 1998; Fung et al., 2001; Hu et al., 1999; Hu et al., 2000; Randall et al., 1992). Dietary pattern analyses were also reported in Korea for middle school students, adults, and college women by a few studies (Song et al., 2005; Song et al., 2006; Yoo et al., 2004).
Korean children and adolescents were reported to have various dietary and nutritional problems threatening health such as imbalance of foods and nutrients intake, obesity, high blood pressure and hyperlipidemia (Kim et al., 2001; Lee & La, 1996; Ministry of Health and Welfare, 2002; Park et al., 2000). Comprehensive studies on dietary patterns of children and adolescents may provide useful information to improve these problems. Accordingly, this study aims at identifying dietary patterns of children and adolescents and to examine their associations with obesity and disease risk through the use of 2001 Korea National Health and Nutrition Survey data.
Subjects and Methods
Subjects and data used
This study targeted 2,704 children and adolescents aged 1 to 19 who participated in the 2001 Korea National Health and Nutrition Survey (KNHNS). Among 2,982 children and adolescents 278 whose anthropometric data were not available were excluded.
From 2001 KNHNS conducted between November and December 2001, anthropometric and biochemical data, and food consumption data were used. One weekday food intake was surveyed using 24-hour recalls. Trained dietitians visited each household and interviewed family members individually to determine food intake amounts. Supplementary tools such as food models and two-dimensional sizes of food volumes and containers were used to help recall. Food portions were converted into weight according to the standard estimators.
Dietary pattern analysis
For a factor analysis to generate dietary patterns, foods from the data of 2001 KNHNS were classified into 29 food or food groups on the basis of 18 food groups used in Korean food composition table (Office of Rural Development, 2001) and in reflection of food habit characteristics of children and adolescents. Cereals were divided into three categories, that is, grains including wheat flour, noodles and rice cakes, and breads and cakes. Meats were divided into four categories - beef, pork, poultry, and processed meat. Foods whose classifications were not clear or that were the distinctive food behaviors to children and adolescents were independently dealt with. They were kimchi, pizza, hamburger, beverages, tea, jams, and juice. Western sauces category included salad dressings, curry sauce, tomato ketchup, hot sauce, spaghetti sauce, worcester sauce, etc.
A factor analysis (principal components) was carried out using the intake frequencies of 29 food or food groups, and factor scores were rotated by using Varimax rotation. The factors were extracted on the basis of 1 or higher Eigen value, Scree test, and interpretation possibility. To identify the characteristics of the factors, the collection of food groups with at least 0.2 of absolute value of factor loading was used (Hu et al., 2001; Yoo et al., 2004). A cluster analysis was performed with five factor scores of the subjects calculated at the factor analysis, and through the Ward method subjects were grouped into three clusters of dietary patterns.
Obese and plasma lipid indices
Obese index was calculated from relative body weight, that is, the percentage against standard body weight. As standard body weight, the 50th percentile of body weight for height in the 1998 Korean children's growth standards was used (The Korean Pediatric Society, 1998). Relative body weight less than 80 was classified as underweight, from 80 to 119.9 as normal, and 120 or more as obesity (Back & Yeo, 2006; Ministry of Health & Welfare, 2002).
From plasma lipid concentrations determined in the subjects aged 10 or older in the 2001 KNHNS, LDL-cholesterol, VLDL-cholesterol, ratio of LDL-cholesterol/HDL-cholesterol and atherogenic index (AI) were computed as follows: VLDL-cholesterol= TG/5; LDL-cholesterol= (Total cholesterol-HDL-cholesterol-VLDL-cholesterol); AI= (Total cholesterol-HDL-cholesterol)/HDL-cholesterol.
Results
Dietary patterns
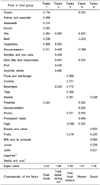
The five major factors were extracted through factor analyses using 29 food or food groups as presented in Table 1. Factor 1 which had the highest eigen value was characterized as a 'traditional diet' since it showed higher factor loading values in grains which include rice, kimchi, fish and shellfish, beef, vegetables, seaweeds, oils and oriental sauces. Factor 2 was characterized as a 'traditional-dining out' pattern with intake of pork, vegetables, noodles, eastern sauce, oils and alcoholic drinks. Factor 3 was the pattern with intake of pizza and hamburger, poultry, beverages, cookies, sweets and teas, and was distinctive to be a 'fast food-western'. Factor 4 had characteristics of a 'western diet' with higher factor loading values of eggs, poultry, potatoes, processed meat, western sauce, solid fats and mayonnaise. Factor 5 showed higher factor loadings in milk and dairy products, breads and cakes, juices, jams, and fruits, and was characterized as 'snack' pattern.
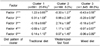
A cluster analysis based on the five factors derived three clusters that formed 25.6% (n=691), 6.2% (n=168), and 68.2% (n=1845) of total subjects, respectively. Factor scores of 3 clusters were presented in Table 2. Cluster 1 had characteristics of Korean traditional pattern of food use with the highest score for factor 1 (traditional) and was identified as the 'traditional diet' pattern. The second largest number (25.6%) of children and adolescents belonged to this cluster. Cluster 2 was labeled as the 'westernized-fast food' pattern with remarkably high scores for the factor 3 (fast food-western) and factor 4 (western). Only 6.8% of the subjects belonged to the 'westernized-fast food' group. Meanwhile, the largest number of the subjects (68.2%) belonged to cluster 3, but there were no higher scores for any factors so that no noticeable features were found. Accordingly cluster 3 was named as a 'mixed diet' pattern.
Age and gender distribution of dietary patterns
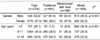
Gender and age distributions of 3 dietary pattern groups were presented in Table 3. The 'traditional diet' pattern had a very higher percentage in boys (61.8%) than in girls (p<0.001), while the 'westernized-fast food' group showed a little bit higher percent in boys (53.0%) than in girls (47.0%). The 'mixed diet' group showed similar ratios between boys and girls.
Both the 'traditional diet' and the 'westernized-fast food' patterns had higher proportions of adolescents aged 12 to 19 (54.3% and 54.8%, respectively) than preschool (1-5 y) and school (6-11 y) children, while the 'mixed diet' pattern had a higher percentage of preschool children, compared with other two patterns (p<0.001).
Dietary patterns and obesity rate and plasma profiles
As shown in Table 4, there were differences as to obesity rate within each dietary pattern group (p<0.05). The 'traditional diet' group had the highest obesity rate of 16.4%, while the 'mixed diet' pattern had the lowest at 11.3%. In the 'westernized-fast food' pattern, obesity rate was 14.3%, which was higher than total obesity rate of 12.8%. Percents of underweight were similar among three dietary patterns. However when the association was analyzed within each age group, significant differences had not appeared in all 3 age groups though the 'traditional diet' tended to have higher obesity rates than other two patterns, particularly in school children.
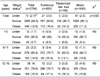
Blood pressure and plasma profiles of children in the age of 10 or older were demonstrated in Table 5 by 3 dietary patterns. Blood pressure did not show significant differences among the clusters. Hemoglobin, hematocrit and red blood cell count were significantly higher in the 'traditional diet' pattern than in the 'mixed diet' pattern groups (p<0.05). While LDL-cholesterol level was significantly lower in the 'traditional diet' pattern than in the 'mixed diet' pattern (p<0.05). Those significant differences, however, disappeared when adjusted for age and gender. There were no differences in other blood lipid profiles among the 3 pattern groups.
Discussion
The 3 dietary patterns of 'traditional diet', westernized-fast food, and 'mixed diet' for children and adolescents identified from 2001 KNHNS seemed to be distinctive with each other and seemed to represent the overall patterns of food consumption in Korean children and adolescents. The patterns were consistent with the recent study of Yoo et al. (2004) that identified 3 dietary patterns of 'traditional', 'westernized', and 'intermediate' for 318 junior high school students from 3 day recorded food consumption data. In our study the 'westernized-fast food' pattern was named instead of the 'westernized'. The reason is to emphasize the eating trend of western style fast foods but not typical western meals (Table 1 and 2). The subject's composition ratios among 3 patterns were different between the two studies. Compared with the Yoo et al. report (2004), the 'westernized-fast food' pattern was very low (6.8% vs 41.2%) and the 'traditional diet' pattern was high (25.6% vs 13.2%). It may be due to the big difference of study samples in size, age (1 to19 y vs middle school students) and region (nationwide vs Seoul). Many studies reported on dietary patterns for adult subjects. Examples were 2 dietary patterns-'traditional' and 'modified'-in Korean study from 2001 KNHNS (Song et al., 2005), 2 patterns-'traditional' and 'prudent' (Fung et al., 2001) and 3 patterns-'traditional', 'snack', and 'high-fat' (Randall et al., 1992) in the US population. However the research on dietary patterns for children or adolescents was very limited. There was a study on dietary patterns for 10,139 numbers of 3 year-old children in the United Kingdom, reporting four patterns of 'junk', 'healthful', 'traditional', and 'snacks' (North et al., 2000). If further analyses will be performed in separated age groups such as preschoolers, school children, and adolescents in this study, more age specific dietary patterns would be extracted.
The results showed that the 'traditional diet' had much higher percentages in boys and in the adolescent age group (Table 3). And the 'westernized-fast food' showed similar to the 'traditional diet', but the percent of boys was a little bit higher than that of girls. The 'mixed diet' group had a higher percentage of preschool children with similar ratios between boys and girls. Of the preschool children, 91% were classified into the 'mixed diet' pattern. It is presumed to result from that preschool children are on the forming dietary habits. As they grow up, some of them may move from the 'mixed diet' pattern to either the 'traditional diet' or the 'westernized-fast food' pattern.
As to obesity rate according to dietary patterns, the results by three age groups (Table 4) showed no differences among the 3 dietary pattern clusters, which was in accordance with other studies (Fung et al., 2001; Song et al., 2005; Song et al., 2006; Yoo et al., 2004) that reported no significant differences in BMI among dietary patterns. However, significant differences were demonstrated in body fat (Song et al., 2006) and plasma leptin concentration (Fung et al., 2001) between dietary patterns. Obesity index or BMI may be a too simple determination to investigate the relationship of diet patterns with obesity risk. Some biochemical data related to obesity may be necessary for the investigation.
Blood pressure and all plasma profiles, including lipid levels, of the subjects were not different among dietary patterns when adjusted with age and gender (Table 5). Other studies (Fung et al., 2001; Song et al., 2005) also showed no significant differences in plasma lipid concentrations between dietary patterns. However Fung et al. (2001) showed significant correlations between the western pattern scores and other plasma biomarkers related with coronary vascular disease such as plasma C-peptide, homocysteine, and folate concentrations. In the study of Hu et al. (2000) which used the data from the cohort study of US health professionals, reported the incidence of coronary heart disease was positively associated with the 'western' dietary pattern and was inversely correlated with the 'prudent' diet. More comprehensive research will be needed to obtain clear evidence on the associations between dietary pattern and risk of coronary heart disease.
In conclusion, children and adolescents in Korea had three distinctive dietary patterns characterized as 'traditional diet', 'westernized-fast food' and 'mixed diet'. The patterns were associated with gender and age. It is suggested to use these patterns to plan nutrition interventions as well as to prepare dietary guidelines for teenager health promotion.

 XML Download