

 PDF
PDF ePub
ePub Citation
 Print
Print


Introduction
The rapid changes of today's society brought along a change in our lifestyles and as the standard of living has increased, our tables have become abundant with richer food. However this energy converts into fat and then accumulates as body fat (Bray, 1979).
According to the World Health Organization (1994), "obesity is one of today's most blatantly visible - yet most neglected - public health problems. Paradoxically coexisting with undernutrition, an escalating global epidemic of overweight and obesity - "globesity" - is taking over many parts of the world. If immediate action is not taken, millions will suffer from an array of serious health disorders." In 1995, there were an estimated 200 million obese adults worldwide and another 18 million under-five children classified as overweight (Chang, 1996). As of 2000, the number of obese adults has increased to over 300 million. For both, obesity poses a major risk for serious diet-related non-communicable diseases, including diabetes mellitus, cardiovascular disease, hypertension and stroke, and certain forms of cancer. Its health consequences range from increased risk of premature death to serious chronic conditions that reduce the overall quality of life. Generally, although men may have higher rates of overweight, women have higher rates of obesity (Lee et al., 1999; Slette & Story, 1997).
Most male students considered that their weights are proper; on the other hand, most female students considered that their weights are overweight (Lee et al., 2001). Most especially, female university students have much concern about their appearances; they tried many weight reductions without correct information (Kim et al., 1999; Ryu & Yoon, 1999). Consequently, problems of dietary habits and nutritional unbalance happened (Park et al., 1997). Obesity can occur at any age, but most cases of obesity start to show in the early years of school during puberty (Kang et al., 1998). Signs of obesity in these stages continue to adulthood and have been proven to result in a high danger of geriatric disease.
Therefore, it would be safe to say that in the early years of college, which marks the beginning of adulthood, it is important to control obesity and to strive to keep physically fit (Na et al., 2003). Nutrition education with correct nutritional information may be necessary for college students to establish desirable dietary habits and balanced body images. Therefore, the purpose of the study was to investigate attitude about dietary habits, diversity of food intakes and nutrient intakes by BMI of Korean female college students. This is expected that the results can be used as the basic data to develop and implement the nutrition programs for maintain proper body weight.
Subjects and Methods
Subjects
The subjects of this research were 141 respondents of a survey carried out on students attending a university in Busan, South Korea to investigate the eating habits, dietary intake, and serum conditions of overweight and obese female students. The survey was performed between March 5 and May 30 of 2005.
Contents and methods
Anthropometric data were gathered, eating habits and dietary intake levels were examined, and blood samples were taken. The subjects were categorized into groups - normal weight (18.5≤BMI<23), overweight (23≤BMI<24.9), and obese (BMI≥25.0) - using the Korean Society for the Study of Obesity's Body Mass Index (BMI) standards for Asian adults (Korean Society for the Study of Obesity, 2000) and analyzed for differences by obesity levels.
To collect basic information, subjects were given 60 minutes to answer questionnaires based on several established information (Chang & Kim, 2003; Kim et al., 2003; Park & Kim, 2005), by having them record their own answers.
1) General characteristics, dietary habits and lifestyles
Subjects were asked to provide information on gender, age, height and weight, average monthly allowance, university department, residence, sleeping hours, smoking and drinking frequency. After measuring the subjects' heights using an extensimeter, the subjects' body compositions - weight, mineral levels, muscle mass and fat levels - were analyzed using Inbody 3.0 (Bio-electrical Impedance Fatness Analyzer, Biospace Co., Ltd). With this information, BMI was calculated using a weight (kg)/height (m2) equation. In order to minimize errors, one trained person measured the waist girth of all the subjects.
2) Eating habits, attitudes, and frequency
Subjects were asked to answer 16 questions on their eating habits and attitudes - meal regularity, amounts, frequency of skipping meals, snacking frequency - and 14 questions on food intake frequency - how much meat, fish, beans, bean products, milk and dairy products, fruits, and vegetables they consumed. The results were then compared for any differences by obesity levels. Subjects were asked to choose among 'none', '1-2 times per week', '3-4 times per week', '5-6 times per week', and 'every day'.
3) Daily food intake levels
In order to understand the subjects' nutritional intake levels, subjects were interviewed individually using the 24-hour (one-day) recollection method. Researchers who had received prior training carried out interviews, providing approximates to help subjects recall how much they consumed, in order to examine the types and amount of foods they ate as accurately as possible. Daily energy and nutritional intakes were calculated by inputting the collected nutritional intake data into the professional-use Can-pro (The Korean Nutrition Society, 2002) developed by the Korean Nutrition Society, and compared with EER (Estimated Energy Requirement), RI (Recommended Intake) and AI (Adequate Intake) values provided by KDRIs (Dietary Reference Intakes for Koreans).
4) Measurement of hematological index
After taking fasting blood samples, each serum separated by centrifugal separator was stored under -80℃. Total cholesterol, blood glucose, HDL-C and TG were analyzed automatically. HDL-C levels were measured using the Young-Dong Diagnostics kit (Young-Dong Diagnostics, Korea).
Statistical analysis
The statistical analysis was conducted using SAS (Statistical Analysis System, ver 8.02, PC package) program. Frequency counts (%), mean and standard deviation were calculated for all variables. For their general descriptions we used the Chi-square to calculate their answer frequency and percentage, and we also analyzed the significant relevancies between them. We have analyzed their weight, height, BMI, and body components with statistics of average standard error. The ANOVA test with a standard p = 0.05 was used for the verification of significant relevance nutrient intake evaluation among the subjects in each group.
Results
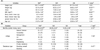
General characteristics, anthropometric data and body composition of obesity are shown in Table 1. The average age of the subjects was 21.8 years. The average height and weight of subjects by BMI were 162.17 cm, 52.73 kg in the normal weight group, 162.35 cm, 62.22 kg in the overweight group and 161.72 cm, 69.82 kg in the obesity group, respectively. The average waist by BMI was 68 cm in the normal weight group, 74 cm in the overweight group and 74 cm in the obesity group. In the average body composition of obesity, protein was not a significant difference among groups by BMI. But the average percent body fat was a significant difference in distribution of BMI among subjects and the more obese was the higher value. In general characteristics, college, monthly pocket money and residence type were a significant difference in distribution of BMI among subjects. The higher rates of BMI were shown in the natural sciences and arts, and education degree students, where much pocket money and self-boarding prevailed.
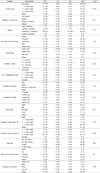
Table 2 shows the results of a survey of daily meal habits, skipping breakfast and snacking by subjects. Daily meals were a significant difference among groups by BMI. The obese group showed sharp polarization between 'not always' and 'always.' In a survey on regularity of mealtimes, the normal group displayed considerable regularity compared to overweight or obese groups, while there was no purposive relationship between each group. Regarding meal portions, all groups answered 'overeating or light eating.' In food preferences, 'Korean' was in favor among all groups, while in eating rate, '10-20 minutes' was in favor among all groups. Regarding frequency of skipping breakfast, all groups were shown to skip breakfast relatively frequently. When they did have breakfast, rice was the most favored among all groups. In daily snacking frequency, 66% of the subjects responded '1-2 times/per' in a day while snacks (31%) and beverages (26%) were the prevalent answers regarding snack types. There were no significant differences in frequency daily snacking among groups. Meanwhile, the normal weight group was shown to eat fruits and drink milk as well. When asked how frequently they ate dinner after 9 p.m., the obese group was found to have frequent late dinners, while there was no purposive relationship between the groups. When asked how frequently they ate food to relieve stress or frustration, 'sometimes,' was the answer chosen by 51% of the subjects, followed by 'frequently' at 26%. Regarding overall food preference, there was no purposive relationship among the groups. The obese group was generally shown to eat indiscriminately, without much attachment to particular foods, while the overweight group was shown to favor instant foods and meat. The evening meal after nine was shown among all subjects and did not make a significant difference among groups by BMI. The shorter duration of meals showed a higher rate of BMI and did not show a significant difference in distribution of BMI among the subjects. As for breakfast food eaten, skipping breakfast of obese groups was the highest value, and did not show a significant difference among groups by BMI.
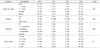
Alcohol intake, smoking and exercise of BMI among subjects are shown in Table 3. As for alcohol intake it was the highest 'every day' by subjects, but there was no significant difference in distribution of BMI among subjects. As for smoking, all subjects showed the highest 'not' responses. As for exercise, the more obesity there was the lower the value of exercise, and there was a significant difference in distribution of BMI among subjects (p<0.05). The sleeping hour of health-related items of all subjects was wanted at 12~01 hours, and there was a significant difference among groups by BMI. (p<0.05).
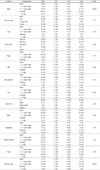
Food intake according to BMI is shown in Table 4. In animal protein food intakes, meat intake was the highest 'every day' food consumed by subjects, and there was a significant difference in distribution of BMI among subjects. Pork and chicken particularly were highly favored. Fish intake was higher '1-2 days/week' food favored by subjects. Egg consumption was also higher '1-2 times/week' food favored by subjects, and there was a significant difference in distribution of BMI among subjects. Generally, animal protein food consumption was indicated as '1-2 times/week' by subjects. Milk and dairy products were the higher '1-2 times/week' food favored by subjects, Fat intake was the higher '1-2 times/week food favored by subjects. There was a significant difference among groups by BMI, and the obesity group was the highest. The vegetable oil of these, particularly, was high preference. Bean intake was the lower value in terms of protein foods. Fruits, and greenish and yellow vegetables intake were the highest 'every day' foods indicated by normal weight group. Consumption of carbonated beverages and juices showed a significant difference among groups by BMI. Obesity was particularly higher among the 'every day' category.
Table 5 shows the results of a survey of the hematological index of subjects. The average glucose and total cholesterol were higher than normal value by subjects, and there were no significant differences among groups by BMI. The average of HDL-cholesterol was 34.10 ± 5.09 mg/dl in the normal weight group, 47.50 ± 27.20 mg/dl in the overweight group and 31.48 ± 5.60 mg/dl in the obesity group. The more obese group particularly was the higher value, and there were significant differences among groups by BMI (p<0.05). The average of triacyglycerol was 94.35 ± 11.38 mg/dl in the normal weight group, 98.28 ± 20.03 mg/dl in the overweight group and 92.08 ± 31.18 mg/dl in the obesity group, were not a significant difference in distribution of BMI among subjects. The average of diastolic blood pressure and systolic blood pressure was 75.00 ± 7.03 mmHg, 120.00 ± 14.14 mmHg in the normal weight group, 74.00 ± 5.48 mmHg, 114.00 ± 5.48 mmHg in the overweight group and 77.50 ± 5.00 mmHg, 117.50 ± 5.00 mmHg in the obesity group, were significant differences in distribution of BMI among the subjects.
Table 6 shows an analysis of the subjects' average daily nutrition intake and appropriate levels for each nutrient. Average daily calories intake levels were insufficient, with NW at 64%, OW 83%, and OB 64% of the EER (Estimated Energy Requirement) provided by the KDRIs (dietary reference Intakes for Koreans). In protein intake, subjects were found to be taking in adequate amounts, with NW at 132%, OW 155%, and OB 100% of RI (Recommended Intake) levels. With regard to fat intake, all groups showed slightly high fat-intake levels, with NW at 34%, OW at 37%, and OB at 29%, compared with the acceptable macronutrient distribution range of 15-25% recommended by the KRDIs to adults over 20 years of age, including the elderly. The groups also showed purposive differences. Regarding carbohydrate intake, the obese group displayed higher levels than the acceptable macronutrient distribution range of 55-70% recommended by the KDRIs, with NW at 68%, OW at 57%, and OB at 73%, and the groups showing purposive differences. The intake ratio of carbohydrates, protein, and fat was NW 68:17:15, OW 64:18:18, and OB 73:14:13. Average daily cholesterol intake levels were NW 309 mg, OW 548 mg, and OB 215 mg, with the overweight group displaying slightly higher intake levels than the other groups, and the groups showing purposive differences. Results of the daily vitamin intake analyses displayed riboflavin, niacin, vitamin C, and folic acid levels lower than the RI levels, with vitamin intake for the obese group - slightly lower than the RI, at 75%, 63%, 45%, and 58%, respectively, and the groups showing purposive differences. Vitamin A and vitamin B6 intake were higher than the KRDIs RI level. Vitamin E intake was NW at 118%, OW at 173%, and OB at 120% compared to the AI (Adequate Intake) level, with the groups displaying purposive differences. In the daily mineral intake analysis, Ca intake was NW 74%, OW 69%, and OB 65% of the RI of Ca for Koreans in the same age groups. Phosphorus intake was NW 126%, OW 128%, and OB 99% of the RI level, while the intake ratio of Ca and P was 1:2, showing higher intakes of P. Na intake was 2.3 times (234%) higher than the AI level. Fe intake was NW 81%, OW 76%, OB 59% of the RI level, with lower percentages in the heavier groups and groups showing purposive differences.
Discussion
The distribution of the subjects in normal, overweight, and obese groups according to the IOTF's standard body mass index was 66%, 17% and 17%, respectively. Such distribution shows a slightly larger proportion of subjects in this research in the overweight group and a smaller proportion in the combined normal group and underweight group compared to the research (Lee et al., 2003) on 1,434 fertile women living in Seoul, Busan, Changwon, and Chuncheon, which showed 25% in the underweight group, 66.8% in the normal, and 7.9% in the overweight group. The average BMI of subjects in this research was slightly less than the Korean Nutrition Society's average BMI of 22kg/m2 for people over 20 years of age in 2005.
As for daily meals, the obese group showed sharp polarization between 'not always' and 'always.' In a survey on regularity of mealtimes, the normal group displayed considerable regularity compared to overweight or obese groups. When asked how frequently they ate food to relieve stress or frustration, 'sometimes,' was the answer chosen by 51% of the subjects, followed by 'frequently' at 26%. The obese group was found to eat for this reason frequently. People, when they are bored or when their mouths are not doing anything in particular, tend to eat in order to relieve stress even when they are not hungry. But care should be taken to prevent this, since such eating can break the body's nutritional balance, thus causing obesity or various geriatric diseases. Regarding overall food preference, there was no purposive relationship among the groups. The obese group was generally shown to eat indiscriminately, without much attachment to particular foods, while the overweight group was shown to favor instant foods and meat. The menu preparation should use less salt and saturated fat in their products, and fast-food chains should introduce lower-calorie and lower-fat items to their menus. The shorter duration of meal showed a higher rate of BMI and was no significant difference in distribution of BMI among subjects. This seemed to show that a shorter meal-time led to a higher probability of obesity (Hermann et al., 1990). As for survey skipping breakfast of obese groups followed gluttony and overeating because of irregular meals and late dinners (Lee & Choi, 1994; Lee & Yu, 1995; Lee et al., 1998). Also overeating of dinner is thought to cause loss of appetite. Both the importance of breakfast and acquirable education of dietary technology may be essential to health. Thus, there will be needed importance of breakfast, education of regular life and a new cook development to replace breakfast.
As for alcohol and smoking intakes, there were no significant differences in distribution of BMI among the subjects. Often referred to as a "necessary evil", alcohol frequently plays an important role in relieving stress and building personal relationships. While moderate drinking can be acceptable, excessive drinking should be avoided in order to prevent obesity. Heavy drinkers also have nutrition issues as they tend to frequently skip breakfast (Kim et al., 1996; Kim et al., 2002). But this result was not a shown relationship between skipping breakfast and alcohol intakes by BMI. According to the research, the more obesity there was, the lower the value of exercise and the most popular way of exercising among university students was going to the gym (data not shown). Also research by Bae (2006) was conducted to show that obese is making exercise as a well lifestyle. Such popularity of exercising at the gym is probably because it helps males build muscles and females lose weight and shape their figures. But while intense exercising burns body sugar, light exercising uses it as an energy source, therefore aerobic exercises that require continuous activity such as jogging, cycling, and swimming are recommended. People who are above overweight need not only seek dietary treatments, but exercise treatments as well, in order to improve their health and achieve mental happiness, while it is widely known that such improvements in lifestyles can lessen the risk of cancer, cerebral apoplexy, and cardiac diseases. In addition, there are results from studies showing that increased muscle mass and decreased body fat contribute to improved health, even when body weight does not decrease. The sleeping hour of health-related items of all subjects was wanted at 12~01 hours, and there was a significant difference in distribution of BMI among subjects (p<0.05). The higher the BMI, the later was the sleeping hour. Regarding the amount of sleeping time, the subjects were found to be sleeping adequate numbers of hours considering that at least 7-8 hours of sleep is needed to maintain health. This shows that subjects with higher BMI levels tend to oversleep. This corresponds with the result that a high proportion of university students, despite the fact that they go to school at later hours than middle or high school students, tend to skip breakfast due to their irregular waking hours.
Generally, animal protein food consumption was indicated as '1-2 times/week' by subjects. Milk and dairy products were the higher '1-2 times/week' food favored by subjects, Fat intake was the higher '1-2 times/week food favored by subjects. There was a significant difference in distribution of BMI among subjects, and the obesity group was the highest. The vegetable oil ly higher among the 'every day' category. According to a U.S. study that analyzed the correlation between soft drinks and juvenile obesity, juveniles were found to be drinking an average of two cans of soft drinks daily, thus consuming approximately 20 spoonfuls of sugar every day. Another finding was the fact that the sugar in soft drinks contributed to 20% of a child's daily calorie intake. It is recommended that sugar should actually comprise less than 10% of the daily calorie intake. In addition, children who frequently consume soft drinks were likely to become obese and get inadequate amounts of vitamin and minerals that are essential to the body. The study also noted that the probability of a child becoming obese increased by 60% with every additional daily can of soft drink consumed (Hermann, 1990; Kim et al., 2003). According to the research of Lee and colleagues (2001), vegetable intake was significantly more in groups with a higher level of nutrition knowledge. Also it was shown that the groups with lower levels of nutrition knowledge often consumed carbonated beverages and instant noodles. According to this result, it is recognized that improvement of nutrition knowledge from nutrition education and consultation is essential for dietary life improvement.
As for survey of the hematological index, the average glucose and total cholesterol were higher than normal value of NCEP by subjects, and there were no significant differences in distribution of BMI among subjects. The average of HDL-cholesterol was NW (34.10 ± 5.09 mg/dl), OW (47.50 ± 27.20 mg/dl) and OB (31.48 ± 5.60 mg/dl) by subjects. In this research was lower than 188.4 ± 5.7 mg/dl in female college students of research by Kim (2003), and was higher than 160.1 ± 24.5 mg/dl, 161.3 ± 31.8 mg/dl in research by Kim and colleagues (1994) and by Hong and colleagues (1993). Research by Kim (2006) was similar to our result. But HDL-cholesterol values from total cholesterol were the highest overweight group and obesity weight group was lower than normal weight group. The results are consistent with others (Kim et al., 2000) carried out on university students and adults shows increased HDL-cholesterol levels coinciding with increased BMI, while the results are consistent with others (Byeon & Choi, 1994) BMI displaying purposive relationships only with total-cholesterol. As for relationships between BMI and blood serum did not show negative relationship between BMI and HDL-cholesterol as before the research (Kim et al., 1998; Kim et al., 2006; Wattigney et al., 1991). Therefore, there is thought that is necessary for diversified research between BMI and blood serum later on. The average of diastolic blood pressure and systolic blood pressure were significant differences in distribution of BMI among subjects. The systolic blood pressure particularly showed a possibility of the danger of hyperpiesia among subjects (p<0.05).
Average daily nutrition intake levels were slightly higher in the overweight group compared to the normal and obese groups, while each group showed purposive differences. Judging from these results, studies on physical activity patterns aiming to understand the correlation between energy consumption and physical activity are needed. The intake ratio of carbohydrates, protein, and fat was NW 68:17:15, OW 64:18:18, and OB 73: 14:13. When carbohydrate intake levels are high, obese value increases. For that reason, the number of small and hard LDL particles increases, thus increasing the risk of cardiovascular diseases. Insulin resistance also rises, increasing the risk of type-2 diabetes (Chung et al., 2000). The excessive intake of carbohydrates can lead to considerably reduced intake of protein and fat. Hence, in order to prevent chronic diseases, carbohydrates, fat, and protein should be consumed in an adequate ratio. Regarding eating habits, and snacking in particular, preferences toward beverages and snacks were high in all the groups, while in blood sugar tests, glucose levels were higher in the heavier groups. In recent times, emphasis is put on indexes such as the glycemic index, which focuses on the physiological quality of carbohydrates than their quantity, and the glycemic load, which focuses on both quantity and quality. Therefore, both the quantity and the quality of carbohydrates should be considered when examining the correlation between excessive carbohydrates and chronic diseases. Results of the daily vitamin intake analyses displayed riboflavin, niacin, vitamin C, and folic acid levels lower than the RI levels, with vitamin intake for the obese group - slightly lower than the RI, at 75%, 63%, 45%, and 58%, respectively, and the groups showing purposive. Thiamin was lower in the heavier groups, respectively. Thiamin deficiency accompanies cardiovascular symptoms such as appetite- and weight-loss, hypersensitiveness, myasthenia, and cardiomegaly. Sufficient intake-levels should be maintained, since serious deficiency leads to beriberi, a disorder in the nervous and cardiovascular system. Vitamin C deficiency reduces Fe absorption, so Fe deficiency is also seen to be related to vitamin C. Therefore, Vitamin C sources - fresh vegetables and fruits - should be eaten in sufficient amounts, while new dishes that reduce cooking time, maintain acidity, and can be stored for long periods should be developed, considering the fact that fruits and vegetables easily oxidate, and vitamin C is easily destroyed in the preparation and cooking processes. In the daily mineral intake analysis, Ca intake was NW 74%, OW 69%, and OB 65% of the RI of Ca for Koreans in the same age groups. Phosphorus intake was NW 126%, OW 128%, and OB 99% of the RI level, while the intake ratio of Ca and P was 1:2, showing higher intakes of P. While P-intake increased compared to the recommended intake ratio of 1:1 in the Korean Recommended Dietary Allowance (2000), the Ca and P ratio was recently found to be irrelevant to adults. But for women, Ca intake levels can influence bodily output in women after menopause and senescent osteoporosis, so increasing Ca intake in those years can help prevent osteoporosis (National Research Council, 1997). Na intake was 2.3 times (234%) higher than the AI level. Na intake needs drastic reduction, since all groups showed higher intake levels than the AI level for Na in the KDRIs. Considering the fact that preferences toward Korean foods and vegetable intake were high in all the groups, it can be seen that for Koreans, increased vegetable intake leads to higher K and Na levels, since Koreans tend to eat most of their vegetables in fermented form such as kimchi. Among lifestyle-related diseases, Koreans stand at risk of high blood pressure due to excessive salt intake. In order to lower Na/K intakes, new methods of processing vegetables should be developed, while lessening the amount of salt used in the process of salt preservation. Fe intake was NW 81%, OW 76%, OB 59% of the RI level, with lower percentages in the heavier groups and groups showing purposive differences. This showed a close correlation with the results of studies on intake levels of iron-source foods - such as meats, fish and shellfish. Shim et al. (2001) reported that Fe intake for university students was 14.7 mg, while Hyun et al. (2003) reported iron intake for female university students was 10mg. According to the two studies, Koreans' Fe intakes from meals ranged between 9.1-14.7 mg. Women should eat sufficient amounts of iron-rich foods, since iron is essential to women's health considering their physiological characteristics - iron is lost during menstruation, required by the fetus during pregnancy, and required by the body in order to increase tissue- and stored iron-levels.
This study was performed to investigate the actual condition of overall dietary life through the survey of dietary habits, diversity of food intakes and nutrient intakes in some female college students by BMI. In conclusion, we could see that the obese showed undesirable dietary habits and lifestyles, but there was significantly lower body fat value than overweight. It leaves something to be desired, but there is a possibility of them having a high body fat percentage. Therefore, it is considered that desirable dietary habits and lifestyles are needed for the improvement of health in obesity groups and also this kind of study should be continued in the future by expanding the number of subjects.

 XML Download