

 PDF
PDF ePub
ePub Citation
 Print
Print


Introduction
Breed characterization requires basic knowledge of genetic variations that can be effectively measured within and between populations. The characterization data of Indian goats is imprecise because earlier studies based on morphological and biochemical markers did not present a true picture of their relationships. These markers have many limitations in identifying breed specificity, as they do not have high resolving and distinguishing power among the closely related breeds in terms of coat colour, horn types, limited polymorphic nature of the serum proteins or biochemical variants, etc. Molecular markers are more accurate and reliable than all other markers [9] because of their dense distribution in the genome, great variation, codominant inheritance and easy genotyping at DNA level. Among the various molecular genetic markers such as Restriction Fragment Length Polymorphisms (RFLPs), Random Amplified Polymorphic DNA (RAPD) and Variable Number of Tandem Repeats (VNTRs), microsatellites were found to be common in all eukaryotic genomes with frequencies as high as one marker per every 6 kb [3], and easy to type via polymerase chain reaction (PCR).
Microsatellites have a number of advantages over the conventional RFLPs, RAPDs and VNTRs or minisatellites, such as simplified analysis, relative abundance, high heterozygosities, a greater degree of polymorphisms, and Mendelian inheritance [9]. The Food and Agriculture Organization (FAO) of the United Nations has proposed an integrated programme for the global management of genetic resources, Project MODAD (DAD-IS; FAO, Rome), using microsatellite methodology for breed characterization. Most of the studies using microsatellites have concentrated on cattle, sheep and pigs, while information available about the genetic characterisation of goats is limited [2,7,8,14,15]. The scarcity of polymorphic markers in the goat is a major drawback for construction of linkage maps, since limited attempts have been made so far in this direction. In order to develop objective criteria for the conservation and genetic improvement of goat breeds in India, the present study was carried out to characterize the Barbari goat using microsatellite markers.
Barbari goats are small, short-haired and distributed across Uttar Pradesh and Rajasthan States of India; the most typical colour is white with small light brown patches [1]. The highly prolific breed is quite important for milk and meat and highly suited for rearing under stall-fed conditions. Considering the small number of animals reported (about 30,000), there is a serious need for undertaking conservation measures [1].
Materials and Methods
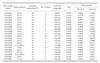
The investigation was carried out on 50 unrelated animals of Barbari goats using 21 microsatellite markers. Detailed information on these markers is presented in Table 1. Five ml of blood was collected from external jugular vein using the vacutainer tube containing EDTA as an anticoagulant. The samples were brought to the laboratory in an icebox and stored at 4℃ till further processing. The samples were collected at random irrespective of age and sex of Barbari goats.
PCR conditions and fragment analysis
Genomic DNA was isolated from five ml of blood by a rapid, non-enzymatic method [10]. The amplification reactions were carried out using a programmable thermal cycler (MJ Research, USA). Each 20 µl PCR reaction contained 50 ng template DNA (the DNA isolated was diluted using Tris EDTA buffer at 1 in 25, 50 and 100 dilutions so as to obtain the working template DNA concentration of approximately 20 to 50 ng of DNA per µl); 5 pmol of each primer (Microsynth, Switzerland) (list of primers used are given in Table 1); 500 µM each of dNTPs (Sigma-Aldrich, USA); 0.7 unit of Taq DNA polymerase (New England Biolabs, UK); 1 µl of 1.5 mM MgCl2 (New England Biolabs, UK). A total of 50 PCR reactions per primer were carried out for all 21 primer sets to characterize the Barbari goats. The PCR reaction cycle was accomplished by initial denaturation for 3 min at 94℃, denaturation at 94℃ for 45 sec, primer annealing for 45 sec at the desired temperature, and an extension for 45 sec at 72℃, repeating the cycle 30 times. The final extension step was given at 72℃ for 10 min. The amplified PCR products were electrophoresed in 6% denaturing urea polyacrylamide gel at a constant voltage of 1,300 volts for a period of 3 h depending upon the size of PCR products and silver stained [5]. The gels were lifted on cellophane sheet (Bio-Rad, USA) and blotting paper (Bio-Rad, USA) and dried at 80℃ for 45 min. The alleles were scored manually and analyzed by software aided gel documentation system (Bio-Rad, USA). The exact allele sizes were determined by direct comparison with adjacent PCR bands and 10 bp ladder (Invitrogen, USA). Allele frequencies were estimated from the genotypes of the goats. The polymorphism information content (PIC) was calculated using the individual frequencies in which the alleles occur at each locus [12]. The heterozygosity at the locus was estimated using Nei's formula [11]. The expected number of genotypes was compared with the observed genotypes in a Chi-square test for goodness of fit to assess whether the study population was in Hardy-Weinberg equilibrium at these 21 microsatellite loci.
Results
The results of the microsatellite analysis in terms of number of alleles observed, alleles size, polymorphism information content and heterozygosity of Barbari goats were furnished in Table 1. In total, 133 alleles were observed for the 21 microsatellite loci analyzed. The number of alleles per locus ranged from 4 (ILSTS001, ILSTS059) to 11 (ILSTS060) with a mean of 6.3 alleles per locus. The allele sizes ranged from 88 bp (ILSTS001) to 220 bp (ILSTS060). The frequency of the alleles ranged from 0.0104 (ILSTS019) to 0.5208 (ILSTS038). The PIC values ranged from 0.5563 (ILSTS002) to 0.8348 (ILSTS029). Except at ILSTS044 and ILSTS060, there were significant differences (p ≤ 0.05) between observed and expected number of genotypes at all other loci, indicating that these loci were not in Hardy-Weinberg equilibrium. The observed heterozygosity ranged from 0.8478 to 1.0000 while the expected heterozygosity ranged from 0.6208 to 0.8509 across the 21 microsatellite markers.
Discussion
There is dearth of published reports on the number of alleles, their sizes and frequencies for these microsatellite loci in goats. The number of alleles available in literature was seven for ILSTS008, nine for ILSTS029 and three for ILSTS059 in Swiss goat breeds [14] and 11 for ILSTS087 in Moroccan and French goat breeds [13]. It has been reported that there was a positive relationship between the number of dinucleotide repeats and the number of alleles at a given locus, with the number of alleles per locus ranging from one to 18 [4]. Greater the number of alleles at given locus, more informative will be the marker.
The PIC estimated in the present study are comparable with those values obtained in Chinese goat breeds, which ranged from 0.746 to 0.800 [15], using ovine microsatellite markers. In contrast, lower PIC values were obtained for Korean (0.350), Chinese (0.620) and Saanen (0.570) goats [8]. An average PIC value of 0.48 was reported in three Indian goat breeds (Sirohi, Jamnapari and Barbari) using cattle microsatellite markers [6]. Based on the PIC values, the microsatellite primers used in the present study are proved to be highly polymorphic in nature and hence can be well utilized for molecular characterization of goat germplasm. In general, the PIC values are suggestive of high polymorphic nature of the microsatellite loci analysed. It refers to the value of a marker for detecting polymorphism within a population, depending upon the number of detectable alleles and the distribution of their frequency and has been proved to be a general measure of how informative a marker is. The studies referred above had used either cattle or sheep microsatellite markers in goats. While in the present study, goat-specific microsatellite markers have been used and hence the PIC values are more accurate and pertinent.
The Chi-square values revealed that 19 out of 21 loci were not in Hardy-Weinberg equilibrium indicating that these loci have not been subjected for any of the systematic (selection, migration and mutation) and dispersive forces (genetic drift and inbreeding). The heterozygosity is an appropriate measure of genetic variability within a population because genetic diversity can be measured as the amount of actual or potential heterozygosity. The observed and expected heterozygosity obtained in the study are comparable with the earlier studies in Chinese goat breeds, 0.777 to 0.823 [15]. However, lower heterozygosity values (0.351 and 0.671) were reported for bovine and ovine microsatellite markers in Korean and Chinese goats [8]. The higher heterozygosity values observed has resulted in instability of the population at the majority of microsatellite loci studied. Because of higher heterozygosity and consequent non-fixation of alleles at these loci, there is further scope for improvement of the breed.
To conclude, all the 21 microsatellite markers used in the present study were shown to be highly polymorphic and more useful for the molecular characterization of Barbari goats. The information elucidated through the present study would be useful for the formulation of effective conservation strategies and identification of quantitative trait loci for marker-assisted selection.
 XML Download