

 PDF
PDF ePub
ePub Citation
 Print
Print


INTRODUCTION
Detrusor underactivity, characterized by prolonged emptying and/or a failure to achieve complete emptying within a normal time span, is a clinically challenging entity in terms of accurate diagnosis and effective treatment [123]. The etiology of detrusor underactivity remains essentially unknown. The specific features of aging bladder contributing to underactivity have not been characterized or linked to a specific condition. It is thought that aging-related comorbidities influencing neurotransmission, sensation, and smooth muscle tension may hamper the bladder contractile function and impair its ability to empty [123].
Reduced strength and/or duration of bladder contractions may result from a variety of conditions including aging, bladder outlet obstruction, ischemia, diabetes mellitus, neurologic disorders, spinal cord injury, infectious neurologic problems, and pelvic surgery including radical prostatectomy. These conditions are known to engage the bladder neural system, receptors and smooth muscle cells and lead to functional deficit [123]. However; downstream pathways underlying neuromuscular dysfunction, lack of sensation, contractile impairment and bladder progression to underactivity have not been thoroughly investigated. Animal studies support the concept of detrusor overactivity progression to detrusor underactivity [3]. It is thought that chronic untreated or treatment refractory overactive bladder may transition to dysfunctional patterns with impaired contractility and ultimately lead to detrusor underactivity.
It is proposed that prolonged ischemia may disrupt the bladder contractile apparatus by interrupting oxygen supply, reducing adenosine triphosphate production and depleting energy resources [4567]. In previous studies with animal models, we found that ischemia hinders delivery of oxygen and nutrients to the bladder, initiates hypersensitivity and overactivity, deteriorates the bladder energy reserves, impairs neural and smooth muscle structures and ultimately leads to inflammation and contractile dysfunction [46]. These observations are supported by clinical documentation of decreased bladder blood flow with aging in both men and women [8910]. A close correlation was reported between the degrees of lower urinary tract ischemia and the severity of LUTS in the elderly patients [8910]. While functional consequences of ischemia have been documented in human and animal studies, mechanistic pathways mediating smooth muscle cell damage, contractile dysfunction and neurodegeneration remain largely unknown.
Our goal was to characterize voiding patterns, cystometric parameters, muscarinic receptor expression, neural ultrastructure and nerve fiber density in early-stage (8 weeks) and after prolonged (16 weeks) bladder ischemia in rats.
MATERIALS AND METHODS
1. The rat model of bladder ischemia
Animal care and experimental protocols were in accordance with the guidelines of our Institutional Animal Care and Use Committee. Adult male Sprague-Dawley rats were randomly divided into treatment (n=16) and sham control (n=16) groups. The treatment group received a 2% cholesterol diet for 2 weeks then underwent balloon dilation of the iliac arteries using a 2-F Fogarty arterial embolectomy catheter (Baxter Healthcare Corp., Westlake Village, CA, USA) to disrupt endothelial cells and produce arterial atherosclerosis, as previously described [4567]. After the procedure, the animals received 2% cholesterol diet until studied. The sham group underwent similar procedures without arterial ballooning and received a regular diet. Eight treated and 8 sham animals were studied at 8 weeks and the other 8 treated and 8 sham animals were studied at 16 weeks after the induction of ischemia as follows.
2. Assessment of micturition patterns
Metabolic cages were used to examine micturition patterns of the animals for 24 hours. Micturition frequency and voided volume were continuously recorded via a fluid collector attached to the Metabolic Cage and connected to a digital balance below the metabolic cage. The balance was connected to a computer with data acquisition. To determine water intake, the animal's drinking bottles were filled with a known measured volume of water. Voiding frequency and mean voided volume were recorded.
3. Conscious cystometry
Under general anesthesia with inhalation of 1%–2% isoflurane mixed with oxygen, the bladder was exposed and a polyethylene PE-50 catheter was inserted into the dome, secured with a purse string suture and routed subcutaneously to the back of the animal then coiled and stored in a skin pouch. After three days, the coiled catheter was removed, the animal was placed in a small animal cystometry station, and the catheter was connected to a pressure transducer. An analytical balance was placed under the cage to measure voided urine volume. For cystometry, the bladder was emptied then saline was infused via a syringe pump at a rate of 150 µL/min. Bladder capacity was determined by measuring the total amount of saline infused into the bladder at the time when micturition commenced. Residual volume was calculated as the voided volume subtracted from the infused volume.
4. Measurement of bladder blood flow and spontaneous contractions
After completion of conscious cystometry, bladder blood flow was measured under general anesthesia as previously described [46] using a laser Doppler probe inserted into the bladder wall and connected to a blood flowmeter (Transonic Systems Inc., Ithaca, NY, USA). The bladder was then filled with 0.8-mL saline and spontaneous bladder contractions without saline infusion were recorded.
5. Western blotting of muscarinic receptor isoforms
Full-thickness bladder tissues were pulverized, homogenized, centrifuged and the supernatant was collected. Samples with equal protein concentration were fractionated by sodium dodecyl sulfate-polyacrylamide gel electrophoresis, transferred to nitrocellulose membranes using a transfer buffer, washed then incubated in a blocking buffer. Samples were then incubated with Santa Cruz antibodies against muscarinic M1 (sc-7470), M2 (sc-80971), M3 (sc-31486) or β-actin at 1:200 dilution in blocking buffer. The next day, the membrane was washed and incubated with appropriate secondary antibodies at a 1:1,000 dilution and washed again. Proteins expression was analyzed with densitometry scanning followed by computer analysis using the ImageJ program.
6. Immunostaining of nerve fibers
Paraffin embedded bladder tissue sections were incubated with 1 µg/mL anti-S-100 and antineurofilament primary antibodies at 1:500 (PA1-932 and PA1-84587, respectively; Thermo Fisher Scientific, Waltham, MA, USA) for 1 hour. Sections were then incubated with secondary antibodies for 20 minutes, processed by the avidin-biotin peroxidase complex then counterstained with Mayer's hematoxylin. The number of nerve fibers was counted under light microscope at 5 high power fields of each slide. Average neural density of the ischemic samples was compared versus sham controls.
7. Transmission electron microscopy
Bladder tissues were fixed, embedded, polymerized and processed for transmission electron microscopy according to the standard protocols. Ultrathin sections were cut, picked up on to copper grids, and stained with lead citrate. Ultrastructure of the ischemic bladder samples was compared versus sham controls using a JEOL 1200EX microscope (JOEL, Peabody, MA, USA).
8. Statistical analysis
Data are expressed as mean±standard error of the mean. Significant differences in the ischemic tissues versus their corresponding sham controls were determined using t-test. Significant differences among the 4 groups of animals were determined using analysis of variance followed by post hoc comparisons. Significant differences were determined at p≤0.05 level.
RESULTS
1. Micturition patterns in metabolic cage
Bladder ischemia altered micturition patterns in a time-depended manner. After 8-week ischemia, micturition frequency significantly increased and voided volume decreased versus sham group (Table 1). After 16-week ischemia, micturition frequency significantly decreased (Table 1). Voided volume in 16 weeks ischemia showed a tendency to decrease but did not reach significance (Table 1).
2. Cystometric changes in bladder ischemia
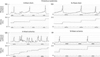
Conscious cystometric parameters largely varied at 8- and 16-week bladder ischemia versus sham controls (Fig. 1). After 8-week ischemia, voided volume and bladder capacity significantly decreased while threshold pressure, micturition pressure and postvoid residual volume did not change (Table 1). After 16-week ischemia, postvoid residual volume and bladder capacity significantly increased while micturition pressure decreased and threshold pressure did not change (Table 1).
3. Bladder blood flow and spontaneous contractions
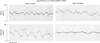
Bladder blood flow significantly decreased at 8 weeks and 16 weeks after the induction of arterial atherosclerosis. Cystometry in anesthetized animals showed marked increase in spontaneous detrusor activities, characterized by recurring fluctuations in intravesical pressure. After 8 weeks, the magnitude of intravesical pressure fluctuations in the ischemic bladders was markedly greater than shams, suggesting detrusor overactivity (Fig. 2). After 16-week ischemia, intravesical pressure fluctuated but failed to generate pressure, suggesting frequent contractions of reduced strength (Fig. 2).
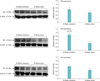
4. Changes in muscarinic receptors expression
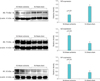
Micturition patterns and cystometric changes after 8- and 16-week bladder ischemia were associated with differential expression of muscarinic M1, M2, and M3 receptors. After 8-week ischemia, M2 expression was significantly upregulated while M1 and M3 expression showed a tendency to increase but their levels did not reach significance versus sham (Fig. 3). After 16-week ischemia, M1 and M2 expression significantly increased while M3 expression significantly decreased versus sham group (Fig. 4).
5. Changes in neural ultrastructure
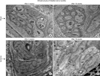
Transmission electron microscopy of control samples showed normal axon terminals packed with small vesicles (Fig. 5). Disrupted axonal structures with swollen perineurium and endoneurium were found after 8-week bladder ischemia. Swollen degenerating axons with disrupted perineurium and collagen invasion of nerve fibers were found after 16-week bladder ischemia (Fig. 5).
6. Changes in nerve fiber density
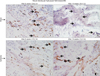
Progressive decrease in immunoreactive nerve fibers was evident in the ischemic bladder. After 8-week ischemia, bladder neural density slightly decreased but did not reach significance (Fig. 6). After 16 weeks, neural density in the ischemic bladder significantly decreased versus sham controls (Fig. 6).
DISCUSSION
Detrusor underactivity represents a challenging clinical entity contributing to voiding dysfunction in both men and women. It was shown that approximately 48% of older men and 45% of older women undergoing evaluation for LUTS show evidence of detrusor underactivity [1112]. There has been a lack of research into the etiology, pathogenesis, and accurate diagnosis of this dysfunction, and as yet, no effective treatments exist. Prevalence and clinical features of detrusor underactivity have been reported in diverse patient groups, suggesting complex pathogenesis and the existence of multiple etiological factors. These factors are thought to manifest in detrusor underactivity by disrupting neural and smooth muscle mechanisms involved in the generation of an effective voiding contraction [1112]. Receptor modifications, interruption of afferent and efferent neural pathways secondary to systemic disorders, intrinsic changes in smooth muscle contractile apparatus, fibrosis and disruption of the afferent sensory system have been suggested as potential mechanisms [1231112].
In most cases, underactive detrusor symptoms overlap with overactive bladder [123]. Animal studies have suggested that untreated bladder overactivity or treatment refractory overactive bladder have significant risk of transition to underactivity [3]. Our data supports this concept suggesting the role of ischemia in overactive bladder progression to changes resembling detrusor underactivity. In previous studies, we found that bladder overactivity under the ischemic conditions generates oxidative radicals and leads to mitochondrial damage, smooth muscle atrophy, inflammation and fibrosis [4613]. Our present study implies a wide variety of time-dependent changes after the induction of bladder ischemia. Micturition patterns, cystometrograms, muscarinic receptor expression, neural ultrastructure and nerve fiber density in early-stage ischemia differed from changes recorded after prolonged ischemia. Increased micturition frequency, decreased voided volume and cystometric parameters in early-stage ischemia suggested changes consistent with bladder overactivity. The same parameters exhibited significant deviations over time showing characteristics similar to detrusor underactivity after prolonged ischemia. Alterations of micturition patterns and cystometrograms over the course of bladder ischemia were associated with differential expression of muscarinic receptors, neural ultrastructural modifications, and decreased neural density. These observations imply enhanced energy demand for persistent overactivity and depletion of energy resources when blood supply to the overactive bladder is reduced. Lack of oxygen and nutrients in ischemia hampers the mitochondrial energy-transduction apparatus, reduces energy production inside the cells, initiates free radical production, and leads to oxidative injury and degeneration of bladder smooth muscle cells and nerve fibers [4613]. These factors in chronic ischemia may play a role in the progression of overactive bladder to dysfunctional patterns similar to detrusor underactivity.
Our present data along with previous observations suggest that disruption of bladder blood flow and subsequent hypoxia, accumulation of metabolic waste and free radical interferences constitute danger signals and initiate a cascade of molecular reactions that mediate bladder sensitization and instability via cell survival signaling [4613]. Activation of cell survival pathways in response to ischemia imposes tremendous burdens on the bladder nerves and receptors to signal cell danger and support survival, forcing neurons and receptors to enhance smooth muscle contractility to maintain function [4613]. These changes in early-stage ischemia may contribute to increased transmission, receptor sensitization, smooth muscle instability and the development of an ischemic overactive bladder. In prolonged ischemia, however, the bladder fails to cope with the enduring stress as its survival pathways deteriorate and defensive capacity declines, allowing free radicals and cytotoxic products to accumulate. Structural damage and functional deficit could worsen with continued ischemic insult and subsequent release of inflammatory mediators that act on the smooth muscle cells, nerve fibers and receptors [4567]. When these circumstances persist, smooth muscle and neural structures begin to deteriorate, contractile capability declines, voiding behavior changes and dysfunctional patterns resembling detrusor underactivity emerge.
Muscarinic receptors, that seem to be altered under the ischemic conditions, may play important intermediary roles in detrusor functional changes and overactive bladder transition to underactivity. Distinctive alterations in the expression of muscarinic M1, M2, and M3 receptors may contribute to the aforementioned cystometric changes at 8- and 16-week bladder ischemia. Among the M1–M5 receptors, M3 is believed to be responsible for the micturition contraction as it mediates contractile response to agonists in normal bladder [1415161718]. M2 receptors outnumber the M3 receptors by almost 4 fold and they seem to play a role in contractile response of the normal and dysfunctional bladder [181920]. It has been suggested that M2 receptors may emerge as the dominant regulator of bladder contractility under the disease conditions [14151617181920]. M1 prevail in neuronal tissues and seems to regulate cholinergic neurotransmission discharge in the bladder. The bladder M1 receptors are believed to facilitate acetylcholine release from cholinergic nerves [212223]. In our study, upregulation of M2 receptors in early-stage ischemia was associated with micturition patterns and cystometrograms consistent with bladder overactivity. Functional changes associated with M2 upregulation appeared when M1 and M3 receptors were expressed normally, suggesting potential shift from M3 to M2 regulation of detrusor contractility and dominant role of M2 in bladder overactivity and voiding dysfunction in earlystage ischemia.
Disproportionate changes of M1, M2, and M3 receptors in bladder ischemia may have important clinical implications. Selective muscarinic receptor inhibitors are widely used to manage overactive bladder symptoms. However, long-term antimuscarinic therapy has frequently been associated with major clinical challenges such as persistent overactive bladder symptoms, patient dissatisfaction and discontinuation of the medication [23242526]. The primary reason for treatment discontinuation or dissatisfaction has been refractory overactive bladder and resistance to antimuscarinics. While the precise nature of refractory overactive bladder remains unknown, disruption of M1–M5 receptors expression and a potential shift in the regulation of smooth muscle contractility from M3 to M2 may play a role. Conditions that interrupt blood flow to the bladder including pelvic atherosclerosis and outlet obstruction may compromise muscarinic receptor regulation of bladder contractility and could lead to persistence with selective antimuscarinic agents such as M3 inhibitors. Treatmentresistant bladder overactivity and the receptor mechanisms behind resistance could lead to smooth muscle damage, deteriorate the bladder contractile apparatus, initiate neural injury, and provoke detrusor underactivity.
Muscarinic receptors underwent more widespread changes in prolonged ischemia, where abnormal detrusor activity was evident, in comparison with early-stage ischemia. In prolonged ischemia, in addition to M2 receptors that continued to be expressed at high levels, M3 expression significantly decreased and M1 expression significantly increased. Alterations of muscarinic receptors and corresponding changes in voiding behavior and cystometrograms at 8 weeks suggest dominant role of M2 in early-stage ischemia, where manifestations of detrusor overactivity were evident. Downregulation of M3 may be the primary mediator of abnormal detrusor activity in prolonged ischemia as M2 was upregulated in both early-stage and prolonged bladder ischemia. Thus, downregulation of M3 may initiate overactive bladder transition to abnormal detrusor activity under the ischemic conditions, while M2 may contribute to the transition phenomenon by modulating M3 receptors. Cumulatively, these observations suggest that M2 upregulation under the ischemic conditions results in an overactive bladder that transitions to dysfunctional patterns simulating underactivity when M3 expression decreases. The expression of M1 receptors did not change in early-stage ischemia but significantly increased after prolonged ischemia where abnormal detrusor activity was present. The precise role of M1 in detrusor functional changes over the course of bladder ischemia remains unclear. We postulate that M1 upregulation in prolonged ischemia may boost synaptic potentials and constantly stimulate nerve fiber discharge and synaptosomal transmission. Overstimulation and excessive discharge under the ischemic conditions could deplete nerve fibers from transmission, diminish neural reactivity, exhaust the postsynaptic events, compromise contractile function and produce changes similar to detrusor underactivity.
Differential expression of muscarinic receptors and corresponding changes in the ischemic bladder function were associated with neural ultrastructural damage in early-stage ischemia and loss of nerve fibers after prolonged ischemia. The precise temporal link or cause and effect relationship between receptor expression and deterioration of nerve fibers is not clear. However, upregulated M1 receptors may be key players in structural damage and neurodegeneration in prolonged ischemia. Studies in the liver have shown that M1 upregulation mediates free radical injury and expedites oxidative cell damage [21]. Inhibition of M1 was shown to protect cells from free radical injury by enhancing antioxidant defense mechanisms [21]. M1 deficient mice exhibited markedly reduced fibrosis, apoptosis, and oxidative stress when exposed to cytotoxic conditions [22]. Inhibition of M1 receptor was shown to reduce caspase-3 activation and enhance cell survival signaling [22]. M1 deficiency in the mouse model exhibited markedly lower tumor necrosis factorlike weak inducer of apoptosis (TWEAK) and diminished proliferation and fibrosis [22]. In light of these findings, we speculate that increased M1 expression may contribute to cellular structural damage and neurodegeneration by amplifying oxidative damage in chronic bladder ischemia. Differential expression of muscarinic receptors and neural structural damage seem to provoke bladder overactivity in early-stage ischemia then lead to changes resembling detrusor underactivity after prolonged ischemia [2728]. These observations may support the concept of overactive bladder progression to underactivity [32930].
CONCLUSIONS
Multiple etiologies are implicated in voiding dysfunction due to detrusor underactivity but their causality and underlying mechanisms remain unproven. The concept of detrusor overactivity progression to detrusor underactivity has been tested in experimental models but mechanisms underlying the transition phenomenon remain unknown. We found voiding dysfunction and cystometric changes consistent with detrusor overactivity in early-stage bladder ischemia that transitioned to dysfunctional patters similar to detrusor underactivity after prolonged ischemia. Differential expression of muscarinic M1, M2, and M3 receptors and progressive loss of nerve fibers may contribute to overactive bladder progression to dysfunctional patterns similar to underactivity under the ischemic conditions.

 XML Download