

 PDF
PDF Citation
 Print
Print


Introduction
As a selective α2-adrenoceptor agonist, dexmedetomidine acts on the locus ceruleus to induce sedation and anxiolysis, and has an analgesic effect in the spinal cord without inducing significant respiratory depression [12]. Intravenous (IV) dexmedetomidine also prolongs the duration of sensory and motor block during spinal anesthesia [3]. Dexmedetomidine has been particularly widely used for the sedation of patients during surgery.
However, some studies have reported that dexmedetomidine induces severe bradycardia (< 40 beats/min) and sinus arrest or pause; this is usually related to a large IV "loading" dose of dexmedetomidine [456]. Therefore, we devised a new method that replaces the bolus loading of 1.0 µg/kg of dexmedetomidine over 10 min with 0.05 mg/kg of midazolam and only utilizes dexmedetomidine for sedation with a maintenance infusion of 0.5 µg/kg/h.
In this study, we examined whether the dexmedetomidine and midazolam-combined sedation method (group MD) could achieve an appropriate depth of sedation compared to the traditional dexmedetomidine-only sedation method (group D), and whether the combined method could maintain hemodynamic stability.
Materials and Methods
Ninety patients aged 18 to 75 classified as American Society of Anesthesiologists (ASA) physical status I or II scheduled to undergo surgery under spinal anesthesia between March 2015 and November 2015 were enrolled in this prospective, randomized, double-blind study. This study was approved by the hospital's Institutional Review Board, and we received written informed consent from all subjects. Patients with coagulopathy, skin infection, uncontrolled hypertension, severe back pain, body mass index > 30 kg/m2, a history of hypersensitivity reactions to local anesthetics, and contraindications to regional anesthesia were excluded from the study. We created a computer-generated randomized table and randomly assigned each subject to either group MD or group D. All patients fasted for eight hours before the surgery and were premedicated with 20 mg of IV famotidine.
Upon arrival in the operating room, patients were connected to an electrocardiogram, a pulse oximeter, a noninvasive blood pressure cuff, and a bispectral index (BIS) monitor (Model A 3000, Aspect Medical Systems, Inc., Natick, MA, USA). Patients' initial vital signs and BIS and Ramsay Sedation Scale (RSS) scores were checked. ETCO2 and respiratory rate were monitored while 5 L/min of oxygen was administered via an oxygen mask. The patients were not prehydrated. With the patient in the lateral decubitus position, a 25-gauge Quincke spinal needle was used to intrathecally infuse hyperbaric 0.5% bupivacaine at L3–4 or L4–5, after which the patient was turned to the supine position. The amount of bupivacaine was determined in accordance with the patient's age and height to reach a target sensory level (T10).
T0 was defined as the time point at which the patient arrived in the operating room. Then, the time points 10 min, 30 min, 60 min, and 90 min after the initiation of sedation following the induction of spinal anesthesia were defined as T10, T30, T60, and T90, respectively.
For the patients in group MD, an anesthesiologist who was not informed about the specific group to which the patient belonged entered 10 min after the patient had received a bolus dose of 0.05 mg/kg of midazolam (T10) to check the patient's vital signs and the BIS and RSS scores, and immediately initiated the IV infusion of dexmedetomidine (Precedex®; Hospira, Rocky Mount, NC, USA, 200 µg/2 ml) at 0.5 µg/kg/h as a maintenance dose. For the patients in group D, 1 µg/kg of dexmedetomidine was IV-loaded via an infusion pump for 10 min, after which another anesthesiologist who was not informed about the specific group to which the patient belonged entered to check (T10) the patient's vital signs including the BIS and RSS scores and immediately initiated the IV infusion of dexmedetomidine at 0.5 µg/kg/h as a maintenance dose as well as recording the BIS and RSS scores, vital signs, level of wakefulness, hypoxia (SpO2 < 90%), bradycardia, hypotension, and paradoxical events (e.g., confusion, violent behavior, restlessness) in thirty-minute intervals. Hypotension was defined as a mean blood pressure (MBP) of less than 60 mmHg, and 4 mg of ephedrine was IV-infused upon detection of hypotension. Bradycardia was defined as a heart rate (HR) of less than 45 beats/min, and 0.5 mg of atropine was IV-infused upon incidence of bradycardia. Hypoxia was defined as an SpO2 of below 90%, and the mouth was opened and the neck was extended upon observance of hypoxia. Patient wakefulness during surgery was defined as a BIS score > 90 and RSS ≤ 2.
After the surgery, we asked the surgeon and the patient about their satisfaction with the patient's sedation according to a numeric rating scale of 0 to 100 and recorded the answers. We also assessed for delirium, nausea, vomiting, and paradoxical behavior (e.g., confusion, violent behaviors, restlessness) along with recording BIS and RSS scores.
Based on the pilot studies, we estimated the sample size to detect differences in HR between the groups, with a power of 80% and α = 0.05. In a pilot study the response within each subject group was normally distributed with a standard deviation of 9. If the true difference in HR between the experimental and control means is 5.73, we will need to study 40 experimental subjects and 40 control subjects to be able to reject the null hypothesis that the population means of the experimental and control groups are equal with probability (power) 0.8. Ninety patients were required to allow for possible incomplete data collection or patient dropout. For statistical analysis of the collected data, SPSS 21.0 (IBM Corp., Armonk, NY, USA) was used.
Age, weight, height, heavy Marcaine use, and the level of sensory block were analyzed and compared using Student's t-test. The Mann-Whitney U test was used for analyzing non-parametric variables, such as scores of ASA, RSS, and satisfaction in surgeons and patients. The BIS, HR, MBP, respiratory rate (RR), ETCO2, and saturation in both groups were compared using repeated measures analysis of variance (ANOVA). In the case of a significant difference on repeated measures ANOVA, a Bonferroni-corrected Student's t-test was used for post-hoc testing. The chi-squared test or Fisher's exact test was performed for categorical variables. Statistical significance was defined as a P value of less than 0.05.
Results
A total of 90 subjects were enrolled in the present study. There were no significant differences in the subjects' gender, age, height, weight, ASA score, heavy usage of Marcaine, or level of sensory block (Table 1).
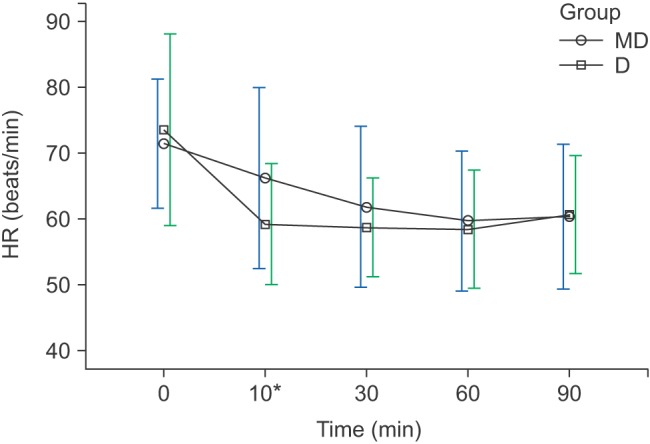
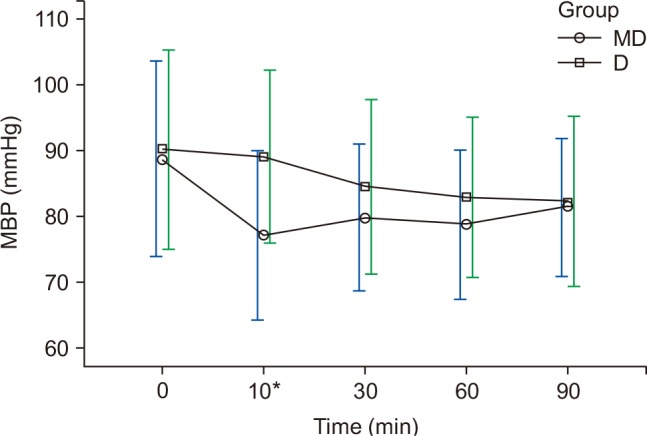
The HR and MBP showed a decreasing trend during surgery, and had shown differences at 10 min in both groups (Figs. 1 and 2). The HR for group D was 59.2 ± 9.1 beats/min, which was significantly lower than that of group MD (66.2 ± 13.7 beats/min) (P < 0.010), and the MBP of group MD was 77 ± 12.8 mmHg, which was significantly lower than that of group D (89 ± 14.2 mmHg) (P < 0.010) (Figs. 1 and 2). Twelve patients in group MD and 13 patients in group D experienced bradycardia, which did not recur after the IV administration of 0.5 mg atropine (Table 2). Hypotension occurred in 13 patients in group MD and six in group D (Table 2). In group MD, hypotension mostly occurred at T10, and was hemodynamically stabilized after 4 mg ephedrine IV (Fig. 2).
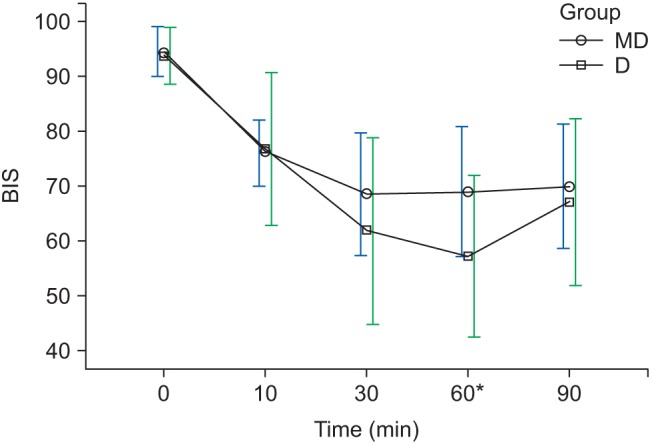
At 10 min after sedation (T10), there were no significant differences in the BIS and RSS scores between the two groups (P = 0.711, P = 0.956) (Fig. 3, Table 3). At 60 min after sedation (T60), the BIS scores of group MD and group D were 68.8 ± 11.8 and 57.0 ± 14.7, respectively (P < 0.010), showing significant differences (Fig. 3), but the RSS scores of group MD and group D were 5 (4–5) and 5 (4–5), respectively, which were the maximum values during surgery, and there were no significant differences between the two groups (P = 0.392) (Fig. 3 and Table 3).
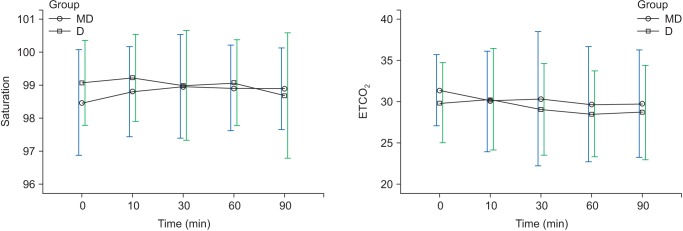
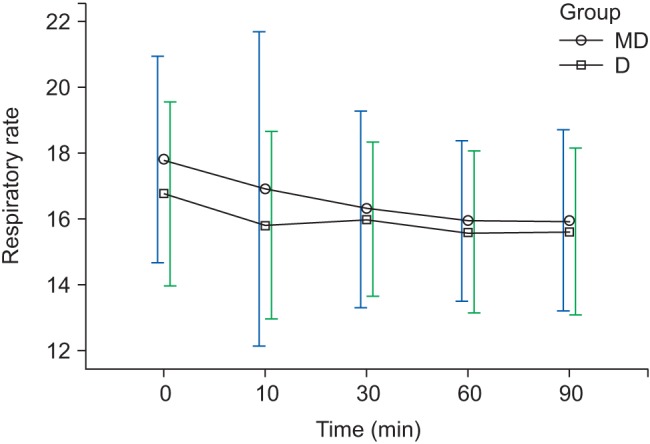
Regarding ETCO2 and saturation, there were no overall changes with time and no significant differences in the two groups in each of the time intervals (Fig. 4). However, regarding RR, there was a decreasing trend with time but no significant difference between the groups (Fig. 5). Two patients in group MD experienced hypoxia, but the finding was not statistically significant (P = 0.495) (Table 2). Hypoxia was relieved after mouth opening and neck extension in the patients in group MD.
The patients' satisfaction with the sedation during surgery was 100 (95–100) points in both groups; the difference was statistically insignificant (P = 0.954). Similarly, the surgeon's satisfaction with the sedation during surgery was 100 (95–100) points and 100 (90–100) points in group MD and group D, respectively; again, the difference was statistically insignificant (P = 0.071). Sedation-related status during surgery and after surgery such as awake and paradoxical behaviors was not statistically significant (Table 2).
Discussion
Dexmedetomidine is a selective α2-adrenoceptor agonist. The α2-adrenoceptor has three subtypes: α2A, α2B, and α2C. The α2A receptors are mostly located in the periphery while α2B and α2C receptors are distributed throughout the brain and the spinal cord. As a selective agonist, dexmedetomidine acts on the locus ceruleus of the brain and the α2 receptors of the spinal cord to induce sedation, sympatholysis, and antinociceptive effects. Initially, it acts on the peripheral blood vessels to induce vasoconstriction and bradycardia, then gradually acts on the presynaptic α2 receptors, reducing the release of norepinephrine and causing later hypotension [78]. Dexmedetomidine induces bradycardia in a significantly large proportion of cardiac surgical patients. However, there is no difference in hospital mortality, and thus it is a safe and effective sedative agent [9].
In the present study, the HR of patients in group D at T10 was significantly lower than that of patients in group MD (P < 0.010), and the MBP of patients in group MD at T10 was significantly lower than that of patients in group D (P < 0.010). The reason why bradycardia occurred with a notably higher frequency among patients in group D at T10 and rapid hypotension did not occur compared to patients of group MD is that bolus loading of dexmedetomidine for 10 min acts on the selective α2-adrenoceptor and causes vasoconstriction and reflex bradycardia [7]. On the other hand, there was not much difference in the overall incidence rate of bradycardia until T90 (Table 3), and bradycardia did not recur after the IV administration of 0.5 mg atropine.
The MBP for the patients of group MD rapidly decreased after a bolus IV of midazolam but hypotension was hemodynamically stabilized after the one-time administration of 4 mg ephedrine IV and stabilized after T10. On the other hand, the MBP for the patients of group D continuously decreased in smaller increments (Fig. 2). For patients in group MD, the bolus IV administration of midazolam induced more rapid alleviation of sympathetic hypertension than experienced by patients in group D, and this is presumed to be due to a lack of the vasoconstrictive effect of dexmedetomidine for the first 10 min. In the present study, hypotension in group MD could be corrected instantly using inotropics and vasoconstrictors.
The suggested clinical loading dose of dexmedetomidine is 0.5–1.0 µg/kg for 10 min and the maintenance dose is 0.2–0.7 µg/kg/min [10]. A recent study discovered that the IV infusion of 1.0 µg/kg of dexmedetomidine for 10 min achieved a higher sedation score without oxygen desaturation than the infusion of 0.5 µg/kg of dexmedetomidine and was also more effective in prolonging the duration of spinal anesthesia [1112]. Moreover, it was equally effective on elderly patients aged 60 or older and did not result in hemodynamic instability [13]. Based on these results, we set the loading dose of dexmedetomidine to 1.0 µg/kg and the maintenance dose to 0.5 µg/kg/h.
Bell et al. [14] reported that there was a significant correlation between BIS and RSS (P < 0.010); BIS scores of 87.2 and 80.9 corresponded to RSS scores of 3 and 4, respectively. The optimal BIS score for sedation is 65–85 and the optimal RSS score is 3–4 points [1516]. In the present study, BIS scores ranged from 55–80 and RSS scores ranged from 3–5 from T10 to T90, and the BIS and RSS scores reached their optimal ranges at 10 min after sedation (T10) in both groups, signifying that the patients were sufficiently sedated. The maximum RSS score was achieved at T60, meaning that the maximum depth of sedation is at this point. The initial bolus loading was performed with midazolam for group MD and with dexmedetomidine for group D, and this is presumed to be due to the fact that the bolus dose effect is gradually reduced after T60.
Kasuya et al. [17] reported that BIS values were significantly lower with dexmedetomidine than with propofol at an equal depth of sedation. In the current study, the BIS scores of group D were significantly lower than those of group MD at T60, but there were no significant differences between the RSS scores of the two groups, and we then verified that the BIS scores of patients sedated by dexmedetomidine could be lower than those of patients sedated using midazolam. More research is required to determine the relationship between the depth of sedation and BIS scores of patents sedated using dexmedetomidine.
The satisfaction of patients with sedation and the satisfaction of surgeons with sedation during surgery were all higher than 90 points, signifying that the method of sedation utilized in both groups granted satisfaction for both patients and surgeons.
In a comparison of sedation induced by dexmedetomidine (0.2–1.4 µg/kg/h) vs. midazolam (0.02–0.10 mg/kg/h) until extubation in intubated patients undergoing mechanical ventilation in the intensive care unit, dexmedetomidine resulted in a lower frequency of delirium, tachycardia, and hypertension but notably higher bradycardia (42.2%) than midazolam (18.9%) [18].
Midazolam can cause hypoxia even in healthy individuals by reducing hypoxic ventilator responses and inducing upper airway obstruction [1920]. On the other hand, even a high dose of dexmedetomidine can maintain a normal ETCO2 and is rarely associated with respiratory problems [19]. In the present study, two patients in group MD experienced hypoxia while no patients in group D had hypoxia (Table 3), and upper airway obstruction was the cause of hypoxia for the two patients; hypoxia did not recur after a neck extension, and the ETCO2 of all patients in both groups was maintained in a range between 28–31 (Table 3, Fig. 4). If patients' neck extension and mouth opening were maintained during surgery, hypoxia could be prevented in advance.
About 10.2% of elderly patients aged 65 years or older treated with midazolam have been found to experience paradoxical events such as confusion, violent behaviors, and restlessness; these symptoms occurred when the mean cumulative dose of midazolam was 7 mg or greater [21]. There were no incidences of paradoxical events in the present study, which is presumed to be due to the fact that midazolam was not repeatedly infused but instead was administered as a maximum bolus of 4 mg (0.05 mg/kg) only once.
In conclusion, the HR in group D and the MBP in group MD were changed remarkably after a bolus loading infusion, but these changes were not severe and were able to be controlled. A sufficient sedation depth was reached within 10 min and maintained during surgery in both groups. Dexmedetomidine is a good sedative agent for patients with regional anesthesia, and the midazolam and dexmedetomidine combined method would be an additional sedation method for patients with severe bradycardia.
 XML Download