

 PDF
PDF Citation
 Print
Print


Introduction
Hypotension, the most common side effect after spinal anesthesia [1], occurs more frequently in geriatric patients with hypertension [2,3]. Decrease in systemic vascular resistance by sympathetic blockades is one of the major mechanism responsible for hypotension after a spinal block [4]. The incidence of hypotension after spinal anesthesia is 2.2 times higher in patients with hypertension and 2.9 times higher in patients taking beta-blockers than in patients without these conditions [2,3].
There have been many attempts to minimize the prevalence of hypotension in patients under spinal anesthesia [5,6]. In addition, recent research has been carried out to predict the occurrence of hypotension after spinal anesthesia [7-11]. Heart rate variability (HRV) has been validated as a predictor of hypotension from several researchers [9-12]. However, there are no studies on the use of HRV to predict hypotension in hypertensive patients after spinal anesthesia. Here, we evaluated the ability of using HRV parameters to predict the occurrence of hypotension after spinal anesthesia in hypertensive patients.
Materials and Methods
After obtaining approval from the Institutional Review Board and informed consent, 41 hypertensive patients undergoing spinal blockades for elective surgeries were included in this study. These patients received antihypertensive medication for at least six months. Patients with cardiac arrhythmias, coagulopathies and spinal surgery histories were excluded from this study.
HRV measurement
HRV was performed according to the guideline of European Society of Cardiology and the North American Society of Pacing and Electrophysiology [13]. Five-minute recordings of the fast R waves on the electrocardiograms were detected with a sample rate of 1024 Hz. Power spectrum densities were calculated for total power, low frequencies (LF: 0.04-0.15 Hz), and high frequencies (HF: 0.15-0.4 Hz) in normalized units. LF reflects sympathetic and parasympathetic control and HF reflects parasympathetic control [14]. The ratio of absolute values of LF and HF (LF/HF) has been reported to correlate with sympathovagal balance [15]. Data was obtained using PowerLab (AD Instruments, Castle Hill, Australia) and automatically stored on the computer, with artifacts processed by computer-based detection.
HRV was measured at five different time points: before fluid loading (T0, baseline), after fluid loading (T1), 5 min after spinal anesthesia (T2), 15 min after spinal anesthesia (T3) and 30 min after spinal anesthesia (T4). All measurements were taken carried out when the patients were in supine position. Fluid loading was performed with 5 ml/kg of a crystalloid solution.
Spinal blockade
Spinal blockade was performed after fluid loading with no premedication. The puncture sites were either the intervertebral space L3-4 or L4-5 with reference to Tuffier's line with the patients in the lateral decubitus position. Injection of 12-13 mg of 0.5% hyperbaric bupivacaine was carried out through a 27 G Sporette needle for spinal-epidural blockades and with a 25 G Whitacre needle for spinal blockades. The patients were placed in a supine position immediately after regional blockade. The level of sensory blockade was tested with pinpricks at five-minute intervals. We categorized the severity of hypotension into three groups such as mild (a decrease of mean arterial pressure 20% below the baseline), moderate (a decrease of mean arterial pressure 20-30% below the baseline) and severe (a decrease of mean arterial greater than 30% below the baseline) [11]. In cases of moderate and severe hypotension, 8 mg ephedrine was administered in increments with 100 ml fluid loading.
Statistical analysis
Statistical analyses were performed using SPSS 12 for Windows (SPSS Inc, Chicago, IL, USA). A Shapiro-Wilk test was performed to verify the normality of the distribution. Sample size calculations were performed with the following data: two-sided α of 5% and power of 80%, and area under the receiver operating characteristic (ROC) curve (AUC) value = 0.7. This generated an estimate of 41 patients.
Parametric data are expressed as mean ± SD and nonparametric data are expressed median (range). Repeated measured analysis of variance with Bonferroni corrections were used to compare the blood pressure, heart rate and LF/HF ratios throughout the study period. Repeated measured total powers were analyzed using Kruskal-Wallis test. ROC curve analysis was used to clarify the validation of baseline LF/HF ratio and total power as a predictor for hypotension after spinal blockade. The AUC of each value were compared with a value of 0.5, which means that the predictive performance of the indicator is no better than chance. P < 0.05 was considered statistically significant.
Results
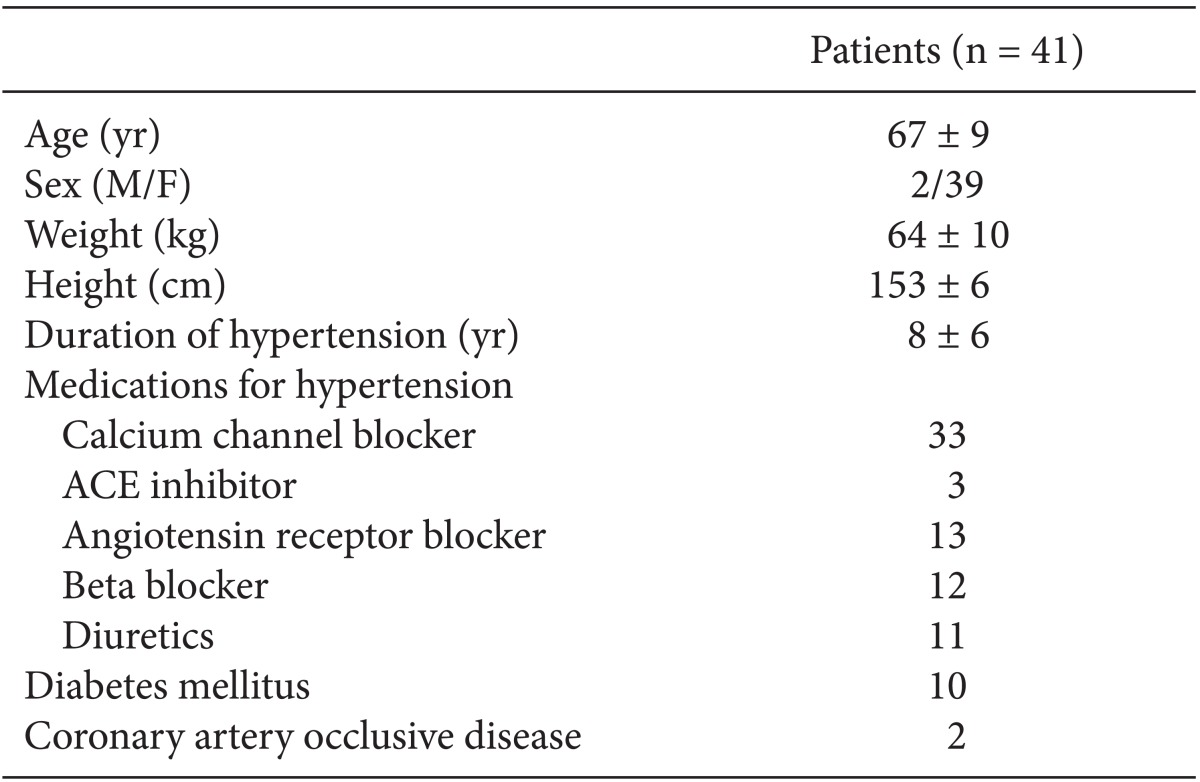
A total of 41 patients completed the study according to the study protocol. Among them, 33 patients received combined epidural spinal anesthesia for a total knee replacement and eight patients received spinal anesthesia for arthroscopy, total hip replacementor osteotomy. Patient characteristics (preoperative hypertensive medications and other combined disease) are shown in Table 1.
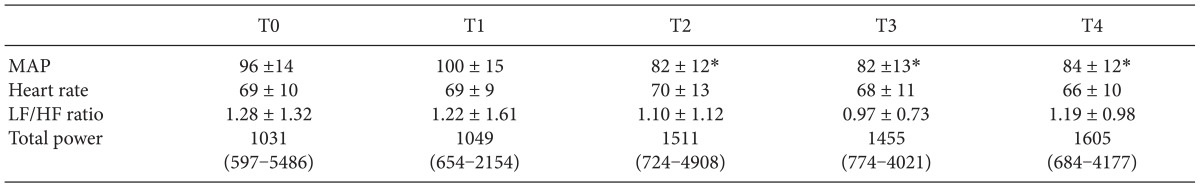
The median peak block level was T6 (range: T10-T1). Moderate hypotension occurred in 13 patients and severe hypotension was in 7 patients. Blood pressure decreased significantly after spinal block, however, heart rate and LF/HF ratio and total power did not change during the study period (Table 2). LF/HF ratio and total power during study period were not different among the patients who experienced no hypotension, moderate hypotension and severe hypotension.
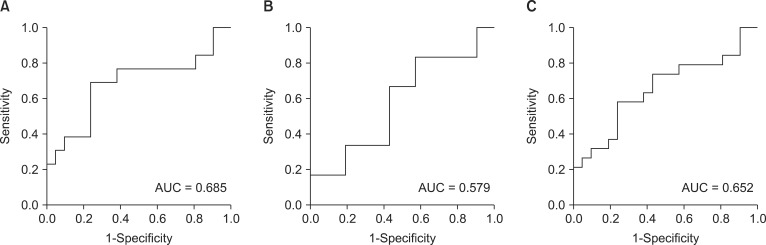
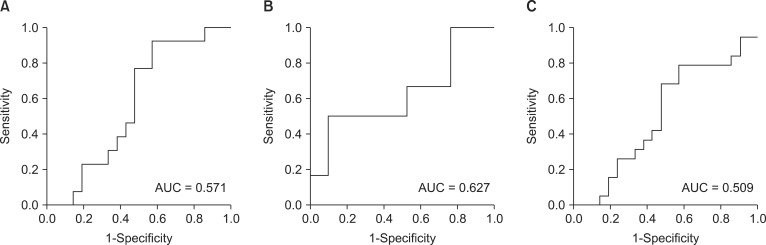
AUCs of LF/HF ratio for predicting moderate hypotension was 0.685 (P = 0.074), severe hypotension was 0.579 (P = 0.560) and moderate or severe hypotension was 0.652 (P = 0.101), respectively (Fig. 1). AUCs of total power for predicting moderate hypotension was 0.571 (P = 0.490), severe hypotension was 0.672 (P = 0.351) and moderate or severe hypotension was 0.509 (P = 0.924), respectively (Fig. 2).
Discussion
We found that total power and LF/HF ratio did not predict moderate or severe hypotension after spinal anesthesia in hypertensive patients. We also found that the incidence of hypotension remains high despite volume loading was performed before the spinal blocks.
Several studies suggest that hypotension during spinal anesthesia may cause several adverse events such as delirium and coronary ischemia [16,17], hence, there is an imperative need for more aggressive methods to prevent hypotension and a novel reliable predictor might be necessary for safe spinal anesthesia in hypertensive patients.
HRV as a predictor for hypotension after spinal anesthesia was introduced by Chamchad et al. [18] and it has been validated as a predictor of hypotension after spinal anesthesia with high sensitivity and specificity [9-11]. In a previous report, a LF/HF ratio above 2.5 predicted hypotension with an accuracy of around 85% [11]. In that study, 39 out of 70 patients had LF/HF ratios > 2.5 and in another study, 48 out of 100 patients had LF/HF ratios > 2.5 [4,11]. These results are contrary to our findings, as only 5 out of 41 patients had LF/HF ratios > 2.5. This different result may be due to differences in patient samples. A possible explanation could be the suppression of sympathetic activity by anti-hypertensive medication in our patients.
It has been reported that spinal anesthesia decreases the LF/HF ratio only in patients with baseline LF/HF > 2.5, not in patients with baseline LF/HF < 2.5 [4]. Since most of the patients in our study had baseline LF/HF < 2.5, the mean LF/HF ratio did not significantly change after spinal anesthesia. Therefore, HRV may be inappropriate for predicting hypotension in conditions in which sympathetic activity is already depressed, such as in hypertensive patients.
The use of total power as a parameter of HRV was also validated as a reliable tool in identifying patients at high risk for a hemodynamic event during general anesthesia [12]. This study included patients who had a history of congestive heart failure, cardiovascular disorders, insulin use, which is similar to our study patients in some degree. However, we did not find total power to be a significant predictor of hypotension in our study. This discrepancy may be explained by the fact that total power of HRV is known to reflect overall autonomic status. Therefore, total power is markedly decreased during general anesthesia compared to spinal anesthesia [12]. Spinal anesthesia mainly affects sympathetic activity, which is dependent on the block level and compensatory sympathetic activity, in contrary to general anesthesia, which may attenuate the activity of both sympathetic and parasympathetic activity and compensatory autonomic responses in a consistent manner.
Generally, hypotension after spinal block is dependent on factors such as the pre-operative autonomic balance, history of hypertension, hydration, and spinal block level [2-4,11]. Based on our results, if patients are older and have cardiovascular conditions such as hypertension, the autonomic sympathetic activity before the spinal blockade may have limited capability for predicting hypotension. Therefore, other markers for predicting hypotension in hypertensive patients are needed.
In addition, more aggressive management to reduce the incidence of hypotension is required since more than 50% of the patients had moderate or severe hypotension, even though fluid was administered before the spinal block.
There are several limitations to this study. First, the degree of sympathetic blockade was diverse because of broad spinal block level (T10-T1). Second, many factors affecting HRV were included in this study. Diabetes mellitus, ischemic heart disease, antihypertensive medications and spontaneous respiration have been reported to affect HRV [19-25]. In addition, preoperative anxiety could influence baseline HRV because psychological stress, depressive and anxiety disorders are associated with reduced HRV [26,27].
In conclusion, HRV may be not used to predict the occurrence of hypotension after spinal block in hypertensive patients. In addition, it is necessary to take further precautions to prevent hypotension before spinal block in hypertensive patients.
 XML Download