

 PDF
PDF ePub
ePub Citation
 Print
Print


INTRODUCTION
Diabetes is a chronic disease characterized by hyperglycemia and various associated metabolic abnormalities. Recently, its incidence has increased continuously, and according to the Health behavior and chronic diseases statistics 2005, the incidence of diabetes in South Korea has been reported to be 8.1% [1]. Dietary habit considered to be an important factor for the development of diabetes, and studies on the consumption of fatty acid [2], meat [3,4], and beverages [5] have been conducted in Caucasians. However, the association of food and the development of diabetes is not clear, and particularly, the previous studies have examined relationship between the consumption of a specific food and the development of diabetes. Therefore, methods that examine long term dietary intake accurately are needed to assess whether dietary patterns affect the development and progression of chronic diseases [6]. So far, the current reports of food intake and clinical recommendations are based on studies of Caucasian subjects. Studies on the nutrient intake of Korean diabetic patients have only looked at a small number of patients, such as 154 patients [7], and therefore the overall state of dietary intake of Korean diabetic patients could not be evaluated. For a large scale study, the development of a validated diet assessment method is required and although studies in diabetic patients have been conducted in other populations [8] in Korea, except for a semi-quantitative food frequency questionnaire (FFQ) in a community cohort for the study of chronic diseases [9] and a food intake questionnaire for the investigation of the dietary patterns associated with the development of diabetes [10], there has been no study on the dietary assessment method for diabetic patients exclusively. Dietary assessment methods should be developed with consideration of the food intake according to cultural characteristics and the change caused by diseases and validated accordingly.
To examine dietary intake, the dietary record method, the 24-hour recall method and FFQ have been used. The dietary record method that has been used as a standard method, generally reflects the accurate intake amount for a recent time period, but has limitations in countries like Korea where the difference of food intake is distinct depending on seasons. The FFQ examines the intake frequency during a standard period as well as the amount of the listed food categories, and it rapidly and readily demonstrates the routine food and nutrient intake pattern for a long period of time. Thus, this approach is favored for large scale epidemiologic studies [11,12]. The advantages of this method are that the burden on examiners and examinees is small, the cost is low, and self-recording is feasible. On the other hand, it is limited because of the limited food categories and intake amount per meal, thus, the measurement of the intake amount is less accurate than with the dietary record method or the recall method. Recently, a FFQ for the assessment of the association of chronic diseases with diet was developed in Korea, and studies on its validity and reliability have been reported [9]. The development of a FFQ that reflects the dietary intake of diabetic patients could be applied to assess the current status of dietary intake [13] and thus understand the disease characteristics [14] and the establishment of clinical guidelines in the future.
Therefore, in our study, we developed a FFQ for type 2 diabetic patients, and we examined its validity by comparing with the nutrient intake amount measured by the diet record method.
METHODS
The research subjects
This study was conducted in the patients from a single hospital, participating in the Korean National Diabetes Program (KNDP). Briefly, the KNDP is a study of type 2 diabetic patients and high risk patients which has been conducted from March 2005 to understand the characteristics of Korean type 2 diabetes and develop clinical guidelines. Currently, the study is ongoing with a total of 5,000 patients enrolled. Among the 96 patients whose FFQ and 3-day diet record (DR) were obtained by a single registered dietitian, 11 patients whose energy intake per day was higher than 4,000 kcal or lower than 1,000 kcal were excluded. Ultimately, 85 patients were included in the study, and the validity of the FFQ was analyzed. We also examined the characteristics of an additional 1,478 diabetic patients in order to selected 85 subjects were able to represent the entire subjects, registered up to the study time point.
Diet intake assessment
Development of the semi-quantitative food intake frequency questionnaire
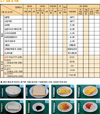
The categories listed in the FFQ were based on questions from the annual Korean Health and Nutrition Survey 2005 [15], with additional sub-categories based on studies conducted on diabetic patients [10]. When diabetic patients are educated on nutrition, exchange units are referred, and thus the intake amount of each food per meal was based on the exchange unit of the food conversion table for diabetes patients, and intake was calculated based on the Food Composition Table of the Korean Nutrition Society and amount suggested by the nutrition analysis program Can-pro 3.0 (Korean Nutrition Society, Seoul, Korea). Since the concept of amount per meal can vary between individuals, both photographs and the standard amounts were used as reference points (Fig. 1).
The food items included in the FFQ consisted of a total of 12 food categories and 85 types of food, including 10 types of grains, 5 types of beans and legumes, 15 types of meats and eggs, 11 types of fish, 11 types of vegetables, 2 types of sea weeds, 12 types of fruits, 4 types of milk and dairy products, 5 types of oil and sugars, 3 types of beverages, 4 types of alcoholic beverages, 3 types of others. For intake frequency, patients were asked to recall the intake frequency of the food listed in the questionnaire for the year prior to the examination date. Intake frequencies were classified as 10 steps (3, 2 or 1 times per day, 4 to 6, 2 to 3 or 1 times per week, 2 to 3, 1 times per month, 6 to 11 times per year or hardly no intake). Regarding fruits and seasonal food, it was asked how often the food was consumed during the season of the product, converted to one year and recorded.
After answering the frequency, the amount was asked by referring the standard amount shown on photographs to record as less (0.5 times), the standard amount (1 time), more (1.5 times) and more than 2 times. For the cases recorded more than 2 times, the intake amount was asked again, and the frequency was raised and recorded.
The 3-day diet record method
The subjects were asked to record the name of the food, the name of the raw ingredients, the consumed amount, whether it was eat-out, and the meal time for each meal, and to record for 3 consecutive days including 2 weekdays and a weekend. At the time of the collection of the diet pattern record, identical single dietitian validated insufficient data record.
Analysis of the nutrient intake amount
The result of the food intake amount and the frequency were analyzed by applying the nutrient evaluation program Canpro 3.0.
Data analysis and statistical methods
The age and clinical characteristic of the subjects were presented as the mean and standard deviation, and the significance level for each analysis was P < 0.05. All data were analyzed by the SPSS version 12.0 (SPSS Inc., Chicago, IL, USA). For the comparison of the characteristic of the cohort group and the research subjects, student t-test was used, and the difference in gender was analyzed by the chi-square test. The results of the nutrient intake obtained by the FFQ method and the diet record method were compared by paired t-test. The correlation between the intake amounts obtained by the two methods was evaluated by Pearson correlation analysis. In addition, the validity of the FFQ was assessed by evaluating the concordance of the subjects divided into 4 quartiles according to the nutrient intake amount obtained by the two examination methods examined by the Kappa value.
RESULTS
The characteristic of subjects
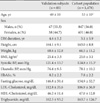
The clinical characteristics of subjects are shown in Table 1. The mean age was 49 ± 10 years (30 to 74), which was slightly younger than that of the entire study subject group. Nevertheless, the duration of diabetes, weight and height were not significantly different between the entire cohort and the subjects in our study. The systolic blood pressure of the entire cohort was 124.8 ± 15.3 mm Hg, was higher than that of our subjects (121.4 ± 13.7 mm Hg). Nonetheless, their diastolic blood pressure did not differ between groups. Total blood cholesterol, triglyceride, high density lipoprotein cholesterol, and fasting glucose were not different from the entire cohort, and thus our study group is representative of the cohort group appropriately. HbA1c which was 8.2 ± 2.2% was also not different. Since the initial test value was taken at the time of the hospital, it is thought to reflect the value prior to the control of blood glucose.
The correlation of the diet examination methods
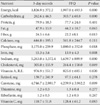
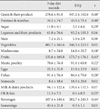
Table 2 shows the average nutrient intake amount per day obtained by the FFQ and the 3-day DR. In our analysis of the 3-day DR, carbohydrate, protein and fat intake were 57%, 17.5%, and 23.6% of the entire energy intake, respectively, which is a relatively appropriate distribution. Cholesterol intake was 305.0 ± 155.9 mg, which is higher than the recommended value in diabetic patients which is less than 200 mg. Calcium intake was 644.8 ± 292.1 mg, which is less than the recommended intake for Koreans, but similar to the amount reported in of the Korean National Health and Nutrition examination 2005.
Comparing the nutrient intake amount assessed by the two methods, energy and carbohydrate intake amount were higher based on the FFQ method. Fiber foods, phosphate, salt, iron, and carotene were evaluated to be higher based on the DR. Iron and sodium may be affected greatly by the intake of seasonings, and thus in the FFQ, it was thought that the recorded seasoning portion was lower than actual amounts. The intake of protein, calcium, fat, vitamin C, riboflavin, and thiamin did not differ between the two assessment methods.
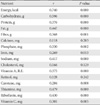
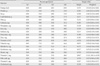
The correlation of the nutrient intake amount obtained by the FFQ to the diet record is shown in Table 3. Energy (r = 0.740) and carbohydrate (r = 0.596) showed a significant correlation, on the other hand, calcium, cholesterol, and retinol did not show a significant correlation. Examining the correlation according to food groups, similar to this, grains, potatoes, fruits and drinks showed a significant correlation, and the correlation of nuts and eggs, which intake frequency is relatively small, was not observed (Table 4). Examining the fishes and meats that are the major source of protein, we found that meat consumption was higher based on the FFQ method, and sea food consumption was comparable between the two examination methods.
Assessment of the validity according to the nutrient intake level
The nutrient intake amount obtained by the DR and the FFQ were both divided into quartiles, and to examine whether their levels are in agreement, the results were analyzed by the Kappa value (Table 5). The Kappa value of energy was 0.54 which was the highest, and vitamin C was 0.14, which was the lowest. The case that was classified as the highest quartile by the DR and the lowest quartile by the FFQ was 5% in average, and was 9.4% for retinol and less than 5% for energy, protein and fat. In contrast, the cases classified as lowest quartile by the DR and highest by the FFQ method were 2.7% in an average, 5.9% for retinol intake, and lower than 1.2% for most macronutrients showing overall low discordance level.
DISCUSSION
The correlation coefficient of the FFQ used in our study to the 3-day DR and the nutrient intake amount was relatively high (0.3 to 0.7). The correlation of macronutrients such as energy, carbohydrate and fat were high, while calcium and retinol did not show a significant correlation. Regarding the Kappa value of the nutrient intake amount, similarly, energy, protein and fat were relatively good with values from 0.36 to 0.54. Kappa value of Calcium and dietary fibers were relatively low, which was 0.19 and 0.20, respectively. Therefore, the adequacy of our FFQ was high for the estimation of the nutrient intake amount, making it particularly useful for the estimation of intake of energy, carbohydrate and fat. In other studies, similar to our study, it has been reported that the correlation to energy and macronutrients were high and the correlation to calcium, vitamins and other micronutrients was low [16,17]. This trend is due to the fact that the intake of energy as well as macronutrients is relatively constant in an individual. However, the intake amount of calcium and vitamin varies widely depending on the selected food types.
Comparing the results of the average nutrient intake per day calculated by the FFQ and the DR, the amount of energy and carbohydrates measured was high with the FFQ, which is similar to the results from a previous Korean studies [9]. Previous studies demonstrated that the FFQ method tended to overestimate with energy and carbohydrate, and micronutrients showed different tendencies depending on the research methods. For calcium, the two methods showed a difference, that depend on intake frequency of legumes and milk that are the major source of calcium. Examining the intake amount according to the food groups, the intake of vegetables, sugars, oils and eggs was observed rather small in the FFQ, and the intake was measured high in other food groups other than these food groups. The underestimation of salt intake in the FFQ is most likely due to the difficulty to measure seasonal variation.
Examining the correlation between the two methods, energy had the highest correlation coefficient of 0.74, and the correlation coefficient of sugar, protein, fat and dietary fibers ranged from 0.368 to 0.596. Retinol did not show a significant correlation, and the correlation of vitamin A, thiamin etc were 0.30 to 0.48. Block et al. [17] reported the correlation coefficient of the two examination methods as 0.5 to 0.6. Jackson et al. [18] reported the value as 0.20 to 0.56, which was lower than our study. In FFQ validation studies on a general Korean population, the correlation coefficient showed relatively low correlation with a correlation coefficient of 0.15 to 0.35 in males and 0.32 to 0.55 in females [16]. To consider seasonal differences, a study compared two times FFQ at 1 year interval with the 4 times 7-day DR. The correlation to the first FFQ was 0.18 to 0.53 and to the second FFQ was 0.26 to 0.73. In other studies, similarly, the correlation was 0.17 to 0.70 [19,20]. The tendency is that the correlation of the two methods shown in Korean population was slightly lower than that with a Western diet. This difference is thought to be due to difference in the intake amount according to season or due to the complexity of meal.
To understand the relationship between diet and the development of disease, it is more important to examine whether the level of routine food intake rather than the quantity is evaluated accurately [21]. Therefore, it is desirable to classify them to the same quartile by the two methods. In our study, the Kappa values for energy, fat, and protein were 0.36 to 0.54, and overall, the concordance was high except calcium (0.19). It is comparable to other studies that the Kappa value of energy was high from 0.18 to 0.88, and calcium from 0.16 to 0.26 [19,22]. In addition, both cases classified from the highest quartile to the lowest quartile and the opposite cases were lower than 5%, and thus showing the FFQ can evaluate intakes appropriately.
The FFQ can be used to assess the routine general intake pattern over a long period of time, and thus it considered to be a useful method for examining the relationship between diet and diseases such as type 2 diabetes, cardiovascular diseases or cancer. With the 24-hour recall and the DR method based on the actual consumption by subjects, it is difficult to know the foods amount that the subjects consumed actually, burden of the subjects is large, and the cost and time required for the examination are high. Furthermore, to examine the routine intake amount, it should be repeated for several days, and thus it is difficult to perform with a large scale cohort study. Therefore, considering the advantages and shortcomings of these methods, we used the diet intake pattern record method and the FFQ method in the initial period, and then we performed a follow-up observation DR. The selection of the appropriate food category for the FFQ is critical to ensure an appropriate evaluation. When the category number is small, the diet intake amount is underestimated [23], and with 273 items, the diet intake amount was overestimated by 9% to 18% [24]. Thus, the composition of appropriate items is required. In our study, we used 85 items, and in some nutrients, we observed overestimation.
The limitation of our study is that the number of subjects analyzed was small, and because we used a single 3-day DR, the difference in food intake according to seasonal variability could not be analyzed. However, it has been reported that the seasonal variation was not larger than difference observed between individuals, and further, the industrialization have decreased the seasonal effect on the intake amount [25,26]. In our study, the subjects were mostly city dwellers, and thus the 3 big nutrients were not greatly affected, and the intake amount of vitamins and inorganic substances differed depending on season. In addition, although this was part of ongoing multicenter study, the evaluation was performed by a single investigator on data from a single institute. Therefore, in the future, we need to conduct a multicenter study examining seasonal variation and the fluctuation within individuals by comparing the DR performed 4 times per year with the FFQ method.
 XML Download