

 PDF
PDF ePub
ePub Citation
 Print
Print


INTRODUCTION
A daily life pattern of insufficient physical activity can cause obesity, which is a serious worldwide health threat [1]. While fat accumulates in any part of the body, the associated risks depend on the area of the accumulation. In particular, fat in the abdominal organs is closely associated with diabetes, cardiovascular diseases and other metabolic diseases [2,3]. In males, abdominal fat increases with age, and in females, it increases noticeably after menopause [4], and the most important cause of accumulation of visceral fat is the lack of exercise and westernized diet pattern according to the change in lifestyle [5].
For the prevention and treatment of the type 2 diabetes, the American Diabetes Association (ADA) emphasizes the advantage of regular physical activity. The ADA recommends moderate physical activity for longer than 30 minutes every day [6], and particularly, for the control of blood glucose, maintenance of body weight (BW), and for the reduction of the risk of cardiovascular diseases, aerobic exercise with the moderate intensity of 50 - 70% of the maximal heart beat for longer than 150 minutes per week, and a minimum of more than three times per week has been recommended [7].
Numerous studies have examined the effect of aerobic exercise through exercise training. In the study reported by An et al., in obese type 2 diabetes patients who performed aerobic exercise of low intensity at 25 - 39% of the maximal heart rate for 60 minutes, 5 times per week and for 12 weeks, the body fat index was lowered, and cardiopulmonary function was improved [8]. In a study conducted on non-obese type 2 diabetes patients, 45 - 60 minutes of walking exercise 5 times per week for 12 weeks significantly improved cardiopulmonary function, but did not have a significant effect on grip strength [9]. In the study reported by Gan et al., obese type 2 diabetes patients who performed 40 minutes of aerobic exercise at an intensity of 55 - 70% of maximal oxygen intake amount, 4 - 5 times per week, had significantly decreased visceral fat mass, and improved cardiopulmonary function [10].
Thus, aerobic exercise can decrease visceral fat more effectively than other exercise methods [11]. However, most studies investigated the effect of trained aerobic exercise and few studies have analyzed the effect of aerobic exercise and physical activity in the daily lives. It is necessary to examine the effect of aerobic exercise, such as walking, in the daily lives of patients.
In the study reported by Kumahara et al. [12], physical activity was monitored with a multi-record accelerometer to obtain objective information and to evaluate the associated energy expenditure. In addition, the accelerometer can monitor the activity intensity, duration and frequency over a long period of time. Therefore, we used a multi-record accelerometer to monitor the daily physical activity of obese type 2 diabetes patients who performed daily aerobic exercise of moderate intensity walking and we analyzed the effect of exercise on visceral fat mass, femoral muscle mass and maximal muscle strength.
METHODS
The study subjects
The study subjects were 45- to 65-year-old women with type 2 diabetes treated with metformin monotherapy. Only the patients whose glycosylated hemoglobin (HbA1c) less than 9% and taking metformin 1,000 mg/day or less for recent 3 months prior to the initiation of the study were included. Exclusion criteria were patients with gestational diabetes mellitus, malignant tumor or secondary diabetes mellitus or advanced diabetes complication. Patients who switched medication or refused the tests during the study were also excluded. Patients who could not be followed, patients refusing the tests, and patients who switched medication. The subjects provided written informed consent before the initiation of any trial-related activities.
Measurement categories and methods
The exercise method
We randomly assigned 32 patients to the aerobic exercise group (AG) and the control group (CG). The AG was prescribed to perform an anaerobic threshold (AT) intensity exercise for 60 minutes, 5 times per week, and for 12 weeks. For the initial 4 weeks, the subjects visited the clinic once a week, and were monitored by a multi-record accelerometer. For the remaining 8 weeks, the subjects visited the clinic every 2 weeks, and the exercise amount was monitored. The CG did not receive exercise education for the study period, but they maintained routine activity, visited the clinic every 4 weeks, and their exercise amount was monitored.
Physical measurement and biochemical test
Upon initiation of the study and after 12 weeks, the height, BW and waist circumference of the subjects were measured. Height and weight were measured with the patients wearing only thin clothes and no outer clothing. Body mass index (BMI) was calculated by dividing BW (kg) by square height (m2). The waist circumference was measured in the comfortably exhaled state using a ruler, and the thinnest area between the lower costa and the iliac crest was measured. Blood pressure was measured after 10 minutes of rest in the seated position using a mercury blood pressure manometer (Yamasu, Tokyo, Japan).
For the biochemical tests, venous blood was collected after fasting for longer than 10 hours and the serum was separated by centrifugation at 3,000 rpm for 15 minutes and then stored at -70℃ until needed for analysis. Fasting blood glucose was measured by the glucose oxidation method, and HbA1c was measured by the cation exchange resin high performance liquid chromatography (HPLC) method. Cholesterol, triglyceride, HDL-cholesterol, and LDL-cholesterol were analyzed by an automated biochemical analyzer (Hitachi 7170; Hitachi Co., Tokyo, Japan) using measurement kits based on enzyme reactions.
Insulin sensitivity was measured by the insulin tolerance test. The subjects fasted for longer than 10 hours and visited the clinic on the day of test under fasting conditions. A 20-gauge catheter was inserted into the side of a vein in the hand and used for blood collection. To the contralateral antecubital vein, another 20-gauge catheter was inserted and used for the injection of insulin and the injection of glucose after the completion of tests. Under resting condition, insulin was diluted in advance (Humulin R; Eli Lilly & Co., Indianapolis, IN, USA) to 0.1 U/kg and injected to the antecubital vein and the glucose concentration was measured after 0, 3, 6, 9, 12, and 15 minutes. Using the 3 - 15 minute values, the slope of the regression line was calculated, and from this, the t1/2 at which the basal blood glucose decreased to half was obtained, and the rate constant for plasma glucose disappearance (KITT) was calculated by the following formula:
KITT = 0.693/ t1/2 × 100 (%/min)
Assessment of physical activity amount
To assess the physical activity amount of each individual, a multi-record accelerometer (Lifecorder; Suzuken Co., Nagoya, Japan) was used, which was worn for 10 days except during sleep or bathing. The accelerometer receives the acceleration of the vibration caused by the up and down movement of the body at the 4-second unit signal. The accelerometer recognized 11 levels of exercise intensity: 0 is without movement, 0.5 is fine movement, 1 - 3 is low intensity, 4 - 6 is moderate intensity, 7 - 9 is high intensity, and the maximal value during 2 minutes is recorded and stored as the exercise intensity of 11 steps.
Physical activity-associated energy expenditure (PAEE) was calculated from sum of energy expenditure during an activity higher than level 4 intensity presented by accelerometer. The total energy expenditure (TEE) was defined as energy expenditure from basal metabolism and light activity plus PAEE. In addition, PAEE or TEE divided by BW was considered to be the rate of energy expenditure per unit weight.
Assessment of meal calorie
For the assessment of the food intake, a 3-day food record (2 weekdays, 1 weekend day) was maintained for the two groups and the subjects visited the clinic every 4 weeks to discuss food consumption issues. For the food record, the subjects were educated briefly on the food record method, and then they were asked to fill out the food intake questionnaire for every meal by recording the amount of all consumed food and food materials, including all health supplement food, snacks, etc.
When the food intake questionnaires were completed, nutrition specialists directly interviewed the subjects to raise the accuracy of the food record, and the recorded items were discussed using a real size food model (Korean Mirage model), measuring cups, measuring spoons, and portion sizes demonstrated in photographs (Korean Nutritionist Association, 1999). The meal record information was analyzed by the computer-aided nutritional analysis program (CAN-Pro version 2.0; Korean Nutrition Society, Seoul, Korea) and converted to the nutrition intake amount.
Assessment of aerobic exercise capacity
The aerobic exercise capacity was assessed using oxygen consumption rate at anaerobic threshold (VO2-AT) during the graded exercise test (GXT). For the GXT, a bicycle (ER900, D-72475 Bits; JAGER, Wuerzburg, Germany) was used. Work load was increased by 20 watts every 2 minutes until the patient could not continue to exercise anymore. AT was defined as ventilator threshold which was the point at which the relationship between ventilation and oxygen consumption deviate from linearity. The heart beat per minute, oxygen consumption rate, activity rate, and respiration number were automatically recorded and stored as numbers and graphed every 15 seconds during exercise and the recovery period. Blood pressure was measured every 2 minutes using an automated blood pressure manometer.
Assessment of muscle strength
To measure the one repetition maximum (1RM) of the upper limbs, the muscle strength of the deltoids, triceps, and the pectoralis muscle was measured using a chest press. For the lower limbs, the muscle strength of the gluteal group, hamstring, and quadriceps muscle was measured by leg pressure (Keiser, Fresno, CA, USA). For the 1RM, first, the patient was warmed up by light exercise at 50% of the intensity of the anticipated maximal weight (50% of BW for upper limbs and BW for lower limbs), and the patient performed the press 8-10 times. Afterwards, the patient performed light stretching for 3 minutes, and then rested for approximately 1 minute. The examinees performed one set and repeated it 3 - 5 times with approximately 75% of the maximum weight. After 1 minute, the maximum muscle strength was tested with the weight increased by 1.25 - 4.5 kg. This was continued until the examinees could not lift the weight any more, and the last successful weight that could be lifted was selected as the maximum muscle strength, which generally was determined within 3 - 5 times trials [13].
Assessment of fat and muscle area
Computed tomography (CT) (GE, Milwaukee, WI, USA) was used for the assessment of abdominal fat area and quadriceps muscle mass. For abdominal fat area, the area belonging to the housefield unit (HU) from -150 to -50 was measured with the cross-sectional image of the 4 - 5 level of the lumbar vertebra. The visceral fat area (VFA) was obtained by measuring the inner area of the boundary of the abdominal and dorsal peritoneum and the subcutaneous fat area was calculated from [total abdominal fat area (TFA) - visceral fat area (VFA)]. The quadriceps muscle area (MA) was measured from the area of the HU 0 - 100 at the middle thigh level.
Statistical analysis
For statistical analysis, the average value of each item and standard deviation were obtained by SPSS for Windows, version 15.0 (SPSS Inc., Chicago, IL, USA). To determine the differences in glucose level, VFA, SFA, MA and 1RM between measurements before and after the 12 weeks between the groups was analyzed by independent t-test and those for each group were by paired t-test. The correlations between exercise intensity, abdominal fat area, and exercise ability were analyzed using Pearson's correlation analysis. Using the variables confirmed by these statistical analyses, we performed a linear regression analysis. A P value less than 0.05 was considered statistically significant.
RESULTS
The general characteristic of the study subjects
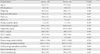
At the end of the 12-week study period, 13 patients remained in the AG and 14 patients in the CG. Of them, 20 were postmenopausal women (10 for AG and 10 for CG). The two groups did not differ significantly in BMI (AG: 27.0 ± 2.5 kg/m2; CG: 27.5 ± 3.0 kg/m2; P = 0.657). Duratino of diabetes, age, lipid profile and HbA1c were not different between group (Table 1). However, KITT of the AG was significantly higher than that of the CG (AG: 2.9 ± 1.0%/min; CG: 2.1 ± 0.8%/min; P = 0.022) (Table 1).
The change in physical measurements and biochemical markers
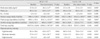
The BMI of the AG after 12 weeks of exercise was significantly decreased from 27.4 ± 2.4 kg/m2 to 26.5 ± 2.2 kg/m2 (P = 0.003), and the waist circumference was also significantly decreased (P = 0.001). Such changes were not detected in the CG. KITT was not significantly changed in either group (Table 2).
Changes in energy expenditure and calorie intake
The calorie intake of the AG decreased from 1,906.5 ± 138.4 kcal/day to 1,614.8 ± 15.3 kcal/day, and that in the CG decreased from 1,937.7 ± 206.3 kcal/day to 1,805.2 ± 189.3 kcal/day. The decreases in calorie intake rate were significant in both groups (P < 0.001 and P = 0.005, respectively), but there was not a significant difference between the groups (P = 0.032).
The TEE, PAEE, and the total amount of walking in the AG significantly increased (P = 0.003, P = 0.003 and P = 0.003, respectively), but these differences were not detected in the CG.
When the data were divided according to exercise intensity and then analyzed, the results showed that in the AG, the low intensity (intensity level 1-3 from the accelerometer) exercise time decreased significantly (P = 0.004), and the moderate intensity (intensity level 4 - 6 from the accelerometer) and high intensity (intensity level 7 - 9 from the accelerometer) exercise time increased significantly (P = 0.028 and P = 0.036, respectively). The low intensity, moderate intensity and high intensity exercise time of the CG did not change statistically. The moderate intensity and high intensity exercise time of the AG was significantly increased in comparison to the CG (P = 0.016 and P = 0.020, respectively) (Table 2).
The change in aerobic exercise capacity, quadriceps MA and maximal muscle strength
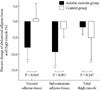
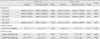
The VO2-AT increased significantly in the AG (P = 0.009). Within the CG, a statistical difference was not detected (Table 3). The 1RM of the upper and lower limbs of subjects in the AG did not significantly change, but maximal muscle strength did decreased significantly in the upper and lower limbs in the CG (P = 0.029, P = 0.035, respectively) (Table 3). The quadriceps MA in the AG did not significantly change, however, it did significantly decrease in the CG (P = 0.045): -1.4% during the intervention in the AG and -4.6 % in the CG (Fig.1).
The relationships among exercise intensity abdominal fat mass and aerobic exercise capacity
We examined the effect of exercise intensity on the abdominal fat. The exercise time consumed by low intensity or high intensity had no correlation with the change in abdominal fat area. However, we did observe that the changes in TFA and SFA were significantly correlated with time spent in moderate intensity exercise (r = -484, P = 0.011 and r = -0.531, P = 0.004, respectively) (Table 4).
In addition, VO2-AT was significantly correlated with time spent in high intensity exercise (r = 0.414, P = 0.032), but not with that of low or moderate intensity exercise (Table 4).
DISCUSSION
Walking is an aerobic exercise that can be performed anytime and anywhere without causing strains to the body, and thus it is a suitable initial exercise for diabetes patients. It was most widely performed by diabetes patients in Korea [14]. Nevertheless, there are few studies examining the effect of aerobic exercise in daily life on cardiopulmonary function and abdominal fat mass in the subjects with diabetes. It is necessary to compare the physical activity of the diabetic subjects with that of non-diabetic individuals. Give that there are have been a lack of studies in Korea, the effects of aerobic exercise for Korean diabetes patients is largely unknown. Yim [15] examined the physical activity in the daily life of 60- to 79-year-old obese females, and with age, the average TEE and PAEE decreased, with a statistically significant decrease in women older than 65 years. The TEE for the 60 to 64-year-old age subject group was 1,724.2 kcal/day, and the PAEE was 239.9 kcal/day. The average age of the subjects in our study was 56.6 years old, TEE was 1,857.6 kcal/day and PAEE was 279.3 kcal/day, which was not lower than that of normal individuals.
Moderate level exercise intensity implies that the metabolic equivalent task (MET) is within the 3.0 - 6.0 range [16]. Paffenbarger et al. [17] reported that physical activity with an exercise intensity higher than 4.5 MET is effective for patients with chronic diseases. Kumahara et al. [12], who converted the intensity of the multi-record accelerometer to MET reported that physical activity lower than low intensity (< level 4) was less than 3.5 MET, the moderate level (level 4 - 6) exercise intensity corresponds to 3.6 - 6.0 MET intensity, and the high intensity (>level 7) exercise corresponds to an intensity higher than 6.1 MET. In our study, the exercise time with moderate intensity was 29.5 ± 16.5 minutes which was comparable to 28.9 ± 23.4 minutes of the above Yim's study.
The probability that individuals with abdominal obesity will develop vascular diseases is 10.8 times higher than that for normal individuals [18]. When obesity is controlled, the mortality rate of cardiovascular diseases is also decreased [19]. Continuous aerobic exercise training has been reported to reduce body fat in both obese and normal weight individuals. Recent studies have been conducted to determine the maximal fat burning exercise intensity for different exercises [20,21].
Lee and Lee [22] analyzed exercise at 40%, 57%, and 75% intensity of the maximum oxygen consumption rate according to the Bruce's graded exercise method to determine the exercise intensity for the maximum fat burning. According to the results, exercise performed at 57% of the maximal oxygen consumption rate produced the lowest lactic acid concentration, and minimized the effect of anti-lipolysis due to the accumulation of lactic acid. Thus, the triglyceride and free fatty acid levels in the blood increased resulting in a high fat consumption rate during the exercise. Lee et al. [23] reported that moderate level exercise at 60% maximal oxygen consumption rate for 60 minutes, 5 times per week, and for 1 week resulted in a significant decrease in abdominal visceral fat mass and subcutaneous fat mass. As shown in Table 4, our data show a high correlation between the abdominal total fat area and moderate level exercise duration, and thus moderate intensity exercise is more effective at reducing abdominal fat than low intensity or high intensity exercise.
Obesity deteriorates cardiopulmonary function [24]. However, regular exercise has been reported to improve cardiopulmonary function and reduce the risk factors of cardiovascular diseases [25]. In the AG in our study, the mean age of the patients was 55.5 years and the body mass index was 27.0 kg/m2. In these patients, VO2-AT increased and thus cardiopulmonary function improved. However, the quadriceps muscle mass prior to and after aerobic exercise was not significantly different. The muscle strength of the upper and lower limbs also did not change significantly with exercise. Nonetheless, our research results are identical to those of the study reported by Weiss et al. [26], and in the CG, the quadriceps muscle mass was significantly reduced. While the meal consumption amount was not prescribed, there was a significant reduction in the meal amounts at the end of the study in comparison with the initiation of the study, so that, there was a reduction in the total fat mass and the muscle mass also decreased.
An [8] conducted a study of a group of obese type 2 diabetes patients (mean age 56.5 years old and mean BMI of 24.7 kg/m2), and trained the patients on a treadmill or ergometer. They reported results similar to those of our study; cardiopulmonary function was improved, but the muscle mass did not change. Together with the reduction in total abdominal fat mass, aerobic exercise can improve cardiopulmonary function. Most studies on aerobic exercise involve exercise training using a treadmill or a bicycle, which is not easy to apply to many patients. In our study, we monitored the daily physical activity of patients using a multi-record accelerometer, and we found that a moderate level of exercise significantly reduced the abdominal fat mass and improved cardiopulmonary function.
Based on our results, we strongly recommend prescribing moderate aerobic exercise for type 2 diabetes patients and monitoring their physical activity with a multi-record accelerometer.
A limitation of our study is that despite the random assignment of study subjects to the intervention group, the AG consisted of patients who had a previous intent to exercise, and thus the average exercise consumption rate was high, so the insulin sensitivity index was significantly higher. Therefore, despite the increase in exercise amount, there was no positive effect on insulin sensitivity. In addition, we included both premenopausal and postmenopausal women. In female cases, the incidence of metabolic syndrome associated with obesity after menopause increases rapidly, primarily because of the accumulation of abdominal body fat due to the sudden reduction in estrogen secretion caused by menopause [27]. However, there was no difference in the proportion of postmenopausal women between groups; menopause status of our subjects should not have any effect on the observed differences between the two groups.

 XML Download