

 PDF
PDF ePub
ePub Citation
 Print
Print


INTRODUCTION
The pathophysiology of type 2 diabetes mellitus (T2DM) involves insulin resistance (IR) and β-cell dysfunction [1234]. Accordingly, estimating IR and β-cell function is essential for screening high-risk subjects for T2DM and making a treatment plan. There are several methods for estimating IR and β-cell function, including the hyperinsulinemic euglycemic clamp, frequently sampled intravenous glucose tolerance, C-peptide to glucose ratio, and homeostasis model assessment (HOMA) model [567].
Among these, the original HOMA (HOMA1) has been broadly used due to its simplicity and cost effectiveness. Previous studies show that an increase of HOMA1-IR and a decrease of HOMA1-β are associated with an increased incidence of diabetes and future cardiovascular events in patients with T2DM [89]. The relationship between the HOMA value and future risk of diabetes in Korean male subjects has been examined [10]. However, the HOMA1 model is not always reliable because it does not consider the variations in the glucose resistance of the peripheral tissue and liver, increases in the insulin secretion curve for blood glucose concentrations above 180 mg/dL, and contribution of circulating pro-insulin [1112].
An updated HOMA (HOMA2), the correctly solved computer model that considers such variations, was announced in 1998. HOMA2 was recalibrated to give steady-state β-cell function (% B) and insulin sensitivity (% S) of 100% in normal young adults when using currently available assays for insulin, specific insulin, or C-peptide [11]. HOMA2 was better than HOMA1 in predicting oral glucose tolerance test (OGTT)-based indexes of β-cell function and glucose resistance in Italians [1314]. In addition, HOMA2 has been used to study IR and metabolic syndrome in Brazilians [15]. A study targeting people in Iraq observed a correlation between glycosylated hemoglobin (HbA1c) and HOMA2-IR [16].
Despite the diverse ethnic groups included in HOMA research, a study of the correlation between HOMA2 and HO MA1 and the development of overt diabetes has not yet been conducted in Koreans. Therefore, the aim of this study was to compare the usefulness of HOMA1 and HOMA2 for predicting progression to diabetes in Koreans.
METHODS
Study population and design
We designed a retrospective observational study of participants in a medical health checkup program at the Health Promotion Center at Kangbuk Samsung Hospital, Sungkyunkwan University School of Medicine, Seoul, from January 2001 to December 2012. The purpose of this medical health check-up program is to promote the health of the employees through regular health checkups and the early detection of existing disease. Most examinees are employees of Korean industrial companies and their family members.
Among the 136,158 subjects, we excluded subjects who had a history of diabetes or were taking oral hypoglycemic agents, as well as those with a fasting blood glucose ≥126 mg/dL or HbA1c ≥6.5% at the baseline checkup. In addition, subjects with missing data and pregnant subjects were excluded from the final analysis. These exclusions (n=31,464) resulted in a final study population of 104,694 subjects.
At the baseline checkup, the subjects were divided by fasting blood glucose and HbA1c levels into the normal glucose tolerance (NGT, fasting blood glucose <100 mg/dL and HbA1c <5.7%) group and the pre-diabetes (100 mg/dL≤fasting blood glucose<126 mg/dL or 5.7%≤HbA1c<6.5%) group. Collectively, all of the subjects constituted the non-diabetic group. In subsequent medical checkups, those subjects with a fasting blood glucose ≥126 mg/dL or HbA1c ≥6.5% were defined as having diabetes. The primary purpose of this study was to compare the predictive ability of HOMA1 and HOMA2 for diabetes, so we calculated the hazard ratios (HRs) of the HOMA values (i.e., HOMA1-IR, 1/HOMA1-β, HOMA2-IR, and 1/HOMA2-β). We monitored changes of the HbA1c, blood glucose, and HOMA values in each group over time. In addition, the subjects were divided into four groups based on each quartile of HOMA values, and we calculated the cumulative prevalence of diabetes in each group.
No specific informed consent was obtained. The requirement for written or verbal consent was waived by the Institutional Review Board during the planning phase of this study. Researchers were only allowed to assess the database for analysis purposes, and the database did not contain any personal identifying information.
Anthropometric and laboratory measurements
Height, weight, waist circumference, and systolic blood pressure were measured in duplicate, and the results were averaged. Systolic blood pressure was taken with a standardized sphygmomanometer after at least 5 minutes of rest, according to the hypertension detection and follow-up protocol [17]. Body mass index (BMI) was calculated by dividing the weight in kilogram by the square of the height in meters. A family history of diabetes was defined as having at least one parent or sibling with diabetes. A current smoker was defined as smoking occasionally or on a daily basis.
After 12 hours of fasting, the fasting blood glucose, total cholesterol, triglyceride, high density lipoprotein cholesterol (HDL-C), low density lipoprotein cholesterol (LDL-C), and HbA1c levels were checked. The hexokinase method (Advia 1650 Autoanalyzer; Bayer Diagnostics, Leverkusen, Germany) was used to measure blood glucose levels, and an enzymatic colorimetric test was used to measure total cholesterol and triglyceride levels. The selective inhibition method was used to measure the level of HDL-C, and the homogeneous enzymatic calorimetric test was used to measure the level of LDL-C. Serum insulin concentration was measured with an immunoradiometric assay (INS-IRMA; Biosource, Nivelles, Belgium). Estimated glomerular filtration rate (eGFR) was calculated by the Modification of Diet in Renal Disease Study equation.
HOMA1-IR was defined as [fasting insulin (µU/mL)× fasting glucose (mmol/L)]/22.5. HOMA1-β was calculated using (20×fasting insulin)/(fasting glucose–3.5) [9]. HOMA2-IR and HOMA2-β data were calculated with a HOMA2 calculator released by the Diabetes Trials Unit, University of Oxford: HOMA Calculator. This calculator is available at: http://www.dtu.ox.ac.uk/homacalculator/index.php (updated January 8, 2013). HOMA1-β and HOMA2-β have a negative correlation with diabetes risk, so we took the inverse value to compare them with HOMA-IR or HOMA2-IR.
Statistical analysis
Continuous variables are presented as mean±standard deviation, and the categorical variables are presented as frequency and proportion. HOMA1 and HOMA2 were compared for independent incident diabetes development by use of HRs from multivariable Cox proportional hazards models. The Kaplan-Meier method was used to compare the cumulative prevalence of diabetes for each HOMA value quartile. All of the data were analyzed using R version 3.1.1 (http://www.R-project.org). Statistical significance was defined as P<0.05.
RESULTS
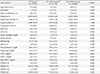
Baseline characteristics of study subjects are shown in Table 1. The median follow-up duration was 6.2 years (range, 1.5 to 15.1), and the mean subject age was 38.9±7.4 years. Our study population included 72,915 NGT subjects (69.6%) and 31,779 pre-diabetes subjects (30.4%). After follow-up, 1,939 subjects (1.9%) were newly diagnosed with T2DM. The subjects in the pre-diabetes group tended to be older, were more often male, and had higher systolic blood pressure, BMI, HbA1c, HDL-C, non-HDL-C, aspartate aminotransferase, alanine transaminase, HOMA-IR, and HOMA2-IR and lower eGFR, HO MA1-β, and HOMA2-β than the NGT group. There were statistically significant differences for all of the variables in the baseline characteristics.
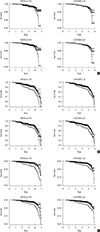
The cumulative incidence of diabetes by quartile for each HOMA value in the NGT group is shown in Fig. 1A, the pre-diabetes group is shown in Fig. 1B, and all subjects together are shown in Fig. 1C. The cumulative prevalence of diabetes tends to increase significantly along with the quartile of HOMA1 and HOMA2 except for 1/HOMA1-β and 1/HO MA2-β in the NGT group. Generally, the high HOMA-IR quartile group had a higher cumulative prevalence of diabetes at follow-up and vice versa in the HOMA-β quartile.
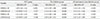
Table 2 compares the HRs for the development of diabetes based on the HOMA1 and HOMA2 estimations as the value increased by the standard deviation. In the NGT subjects, HOMA2-IR (HR, 1.18; 95% confidence interval [CI], 1.13 to 1.23; P<0.001) was more predictive than HOMA1-IR (HR, 1.13; 95% CI, 1.1 to 1.17; P<0.001), but there was no significant difference between HOMA2-IR and HOMA1-IR (P> 0.05). HOMA1-β and HOMA2-β did predict progression to diabetes. In the pre-diabetes group, HOMA1-IR (HR, 1.42; 95% CI, 1.38 to 1.46; P<0.001) was a more powerful marker than HOMA2-IR (HR, 1.33; 95% CI, 1.29 to 1.38; P<0.001) or HOMA2-β (HR, 1.26; 95% CI, 1.23 to 1.29; P<0.001). In the non-diabetic group, HOMA2-IR (HR, 1.25; 95% CI, 1.23 to 1.26; P<0.001) and HOMA2-β (HR, 1.26; 95% CI, 1.25 to 1.28; P<0.001) had stronger predictive power than the HOMA1 values.
HOMA-IR values were associated with the development of T2DM independent of age, sex, BMI, family history of diabetes, smoking history, systolic blood pressure, lipid profile, and HbA1c, but there were no differences between HOMA1-IR (HR, 1.09; 95% CI, 1.04 to 1.14; P<0.001) and HOMA2-IR (HR, 1.11; 95% CI, 1.04 to 1.19; P<0.001) in the NGT group. HOMA2-β was the most significant predictive marker in both the pre-diabetic group (HR, 1.29; 95% CI, 1.26 to 1.31; P< 0.001) and the non-diabetic group (HR, 1.27; 95% CI, 1.25 to 1.29; P<0.001) (Table 3).
DISCUSSION
In this study, after adjusting for diabetes-related variables, both HOMA1-IR and HOMA2-IR were statistically significant markers for predicting the development of diabetes in the NGT group. All HOMA values were predictive in the pre-diabetes and non-diabetic groups. In particular, HOMA2-β was the potential marker for predicting the future development of T2DM in the pre-diabetes and non-diabetic groups.
A previous study compared the performance of HOMA2 with HOMA1 in pre-diabetic and diabetic patients using the OGTT and found that HOMA2 reflected IR and β-cell function more accurately than HOMA1 [13]. In another study, HOMA2 more significantly affected the identification of IR and the detection of metabolic syndrome and polycystic ovarian disease than HOMA1 [18]. In this study, HOMA1-IR and HOMA2-IR were not significantly different in their ability to predict the progression to T2DM in the NGT group, but HOMA2, especially HOMA2-β, was more predictive in pre-diabetic and non-diabetic Koreans than HOMA1. In particular, HOMA2-β was the most predictive marker for the pre-diabetic group, probably due to differences in age, race, and BMI. The β-cell function of Asians is usually lower than in Western ethnic groups [1920] based on a multiethnic cohort study of diet and cancer [21]. Further, the low HOMA-β group had a higher risk of progression to diabetes than the high HOMA-IR group in a prospective study of Korean men [10]. These outcomes point to the need for a standard model appropriate for Koreans because the factors that affect the development of diabetes vary depending on ethnicity. At a minimum, if we use the established HOMA model, we need to select the best model according to glycemic status.
We also observed that HOMA1-β and HOMA2-β were not significantly predictive in the NGT group. The normoglycemic state results from the homeostasis of glucose production, and consumption is mediated by the liver, skeletal muscle, and pancreas β-cells [22]. Accordingly, both IR and impaired insulin secretion are thought to be critical to the pathophysiology of pre-diabetes although controversy remains about the leading factor for diabetes. Both IR and impaired insulin secretion are independent determinants of the progression from NGT to pre-diabetes and from pre-diabetes to diabetes [232425]. In the NGT group, the level of insulin secretion was low to normal in a person with good insulin sensitivity, so it is difficult to think that HOMA-β alone can predict the progression to diabetes in a healthy person.
The strength of this study is that it was a longitudinal observational study, not a cross-sectional study, and it investigated the usefulness of HOMA2 in a large number of Koreans. Our large sample size gave us the ability to divide the subjects into the NGT and pre-diabetic groups, allowing us to compare the performance of HOMA1 and HOMA2 in the NGT and prediabetes groups.
Even so, this study had several limitations. First, all of the study subjects were enrolled in the health screening center of our hospital, and the study was conducted at a single center. Therefore, the results may not be representative of the entire Korean population. In addition, except for oral hypoglycemic agents, we did not confirm previous medication history, which could affect IR or β-cell function. Finally, we defined pre-diabetes using fasting plasma glucose, so there were no data about the progression to diabetes according to impaired glucose tolerance.
In conclusion, HOMA2, especially HOMA2-β, was more predictive for the progression to diabetes in pre-diabetes or non-diabetic Koreans. HOMA2 may offer a meaningful predictor of diabetes in Koreans if appropriate values are selected depending on individual glycemic status.

 XML Download