Journal List > Diabetes Metab J > v.40(1) > 1084929

Kim, Back, Yi, Joung, Kim, and Ku: Effect of Atorvastatin on Growth Differentiation Factor-15 in Patients with Type 2 Diabetes Mellitus and Dyslipidemia

Abstract

Background

Elevated serum levels of growth differentiation factor-15 (GDF-15) are associated with type 2 diabetes. Therefore, the effects of atorvastatin on metabolic parameters and GDF-15 levels in patients with type 2 diabetes and dyslipidemia were evaluated.

Methods

In this prospective randomized trial from February 2013 to March 2014, 50 consecutive type 2 diabetic patients with a low density lipoprotein cholesterol (LDL-C) levels ≥100 mg/dL were enrolled. The patients were divided into two groups based on the amount of atorvastatin prescribed, 10 mg/day (n=23) or 40 mg/day (n=27). The effect of atorvastatin on metabolic parameters, including lipid profiles and GDF-15 levels, at baseline and after 8 weeks of treatment were compared.

Results

The baseline metabolic parameters and GDF-15 levels were not significantly different between the two groups. After 8 weeks of treatment, the total cholesterol (TC) and LDL-C levels were significantly decreased in both groups. The mean changes in TC and LDL-C levels were more significant in the 40 mg atorvastatin group. The GDF-15 level was decreased in the 10 mg atorvastatin group, from 1,460.6±874.8 to 1,451.0±770.8 pg/mL, and was increased in the 40 mg atorvastatin group, from 1,271.6±801.0 to 1,341.4±855.2 pg/mL. However, the change in the GDF-15 level was not statistically significant in the 10 or 40 mg atorvastatin group (P=0.665 and P=0.745, respectively).

Conclusion

The GDF-15 levels were not significantly changed after an 8-week treatment with atorvastatin in type 2 diabetic patients.

INTRODUCTION

Growth differentiation factor-15 (GDF-15), also known as macrophage inhibiting cytokine-1 and nonsteroidal anti-inflammatory drug-activated gene-1 [1], is synthesized as a propeptide and undergoes cleavage of its N-terminus to generate an active 25-kD disulfide-linked dimeric active protein. Normally, GDF-15 is highly expressed in the prostate and placenta, as well as in the heart, pancreas, liver, kidney, and colon [23]. GDF-15 is a member of the transforming growth factor-β (TGF-β) superfamily and is rapidly expressed in response to cytokines and growth factors, such as interleukin 1β (IL-1β), tumor necrosis factor-α (TNF-α), angiotensin II, macrophage colony stimulating factor, and TGF-β [24]. High levels of GDF-15 are associated with both cardiovascular and noncardiovascular mortality [5]. GDF-15 levels are independently positively correlated with smoking, diabetes, cardiovascular disorders, renal dysfunction and markers of inflammation, such as C-reactive protein (CRP). High GDF-15 levels are also a strong predictor of overall mortality in healthy subjects without previous cardiovascular disease or cancer [6].
Statins not only lower blood cholesterol levels by inhibiting 3-hydroxy-3-methylglutaryl coenzyme A reductase but also have anti-inflammatory effects. As a modulator of several inflammatory mechanisms [7], statins can improve cardiac outcomes [8910]. In the pravastatin inflammation/CRP evaluation (PRINCE) trial, the serum CRP level was significantly decreased independent of low density lipoprotein cholesterol (LDL-C) changes after treatment with pravastatin (40 mg/day for 24 weeks) in patients with coronary artery disease [11]. In another trial, statin treatment reduced inflammation-associated markers, such as CRP, TNF-α, IL-1, IL-6, and soluble intercellular adhesion molecule-1 in hypercholesterolemic patients [1213].
The role of inflammation in the pathogenesis of type 2 diabetes and associated complications is well established [14]. Recent studies regarding the treatment of type 2 diabetes focused on delaying disease progression using anti-inflammatory drugs and not only on lowering glucose [15]. Recently, several studies showed GDF-15 to be a stress-responsive cytokine that is increased in obesity, prediabetes and type 2 diabetic patients [16171819] and is a predictive and prognostic factor for cardiovascular disease and diabetes [2021]. However, reports regarding the effect of statins on GDF-15 levels are lacking, although statins are commonly prescribed to patients with cardiovascular risk factors. Statins decrease the level of LDL-C and the risk of cardiovascular disease. This study was performed to verify the effectiveness of GDF-15 as a prognostic factor for cardiovascular disease in diabetes and as a diagnostic marker of diabetes and cardiovascular disease by observing the change in GDF-15 levels as LDL-C levels decrease in response to statin therapy.

METHODS

Study design

Fifty-nine type 2 diabetic patients with LDL-C levels ≥100 mg/dL that visited the Endocrinology Department of Chungnam National University Hospital from February 2013 to March 2014 were enrolled in this study. Exclusion criteria were a history of lipid lowering medication within 4 weeks (including the screening period), hypersensitivity or resistance to atorvastatin, elevated aspartate transaminase (AST) or alanine transaminase (ALT; more than two times the normal highest value), elevated creatinine (Cr ≥1.5 mg/dL), elevated creatine kinase (more than two times the normal highest value). Patients with acute infectious disease and a history of acute myocardial infarctions within 6 months were also excluded.
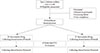
Of the 59 participants, 50 were included in the final analysis and 9 were excluded due to the cancellation of acceptance (n=3), screening failure (n=3), or poor compliance (n=3). The patients were randomly divided into two groups based on the amount of atorvastatin prescribed as the 10 mg/day (n=23) and 40 mg/day atorvastatin groups (n=27). Plasma samples were obtained from all patients for the measurement of biochemical markers at baseline and after 8 weeks of treatment (Fig. 1). Side effects due to atorvastatin were not observed during the study.

Biochemical data

The blood samples were collected using ethylenediaminetetraacetic acid tubes in the morning after an overnight fast of more than 8 hours, and the lipid profiles (high density lipoprotein cholesterol [HDL-C], LDL-C, total cholesterol [TC], and triglycerides [TGs]) were measured using a blood chemistry analyzer (Hitachi 747; Hitachi, Tokyo, Japan). CRP was measured using the photometric latex agglutination method (TBA-2000FR; Toshiba, Tokyo, Japan). Insulin was quantified using an immunoradiometric assay kit (DIAsource INS-IRMA Kit; DIAsource, Louvain-la-Neuve, Belgium). Glycosylated hemoglobin (HbA1c) was measured using high-performance liquid chromatography (BioRad, Hercules, CA, USA). Homeostasis model assessment-estimated insulin resistance (HOMA-IR) was calculated as the fasting serum insulin (µU/mL)×fasting plasma glucose (mmol/L)/22.5. The fasting serum GDF-15 level was measured using a quantitative sandwich enzyme immunoassay technique with an enzyme-linked immunosorbent assay (ELISA; R&D systems, Minneapolis, MN, USA; and Quantikine ELISA, Human GDF-15, catalog number: DGD150).

Statistical analyses

All parameter values were calculated as the mean±standard deviations. A P<0.05 was considered statistically significant. Chi-square and Mann-Whitney U tests were used to compare the clinical characteristics and biochemical data between the two groups. The Wilcoxon signed-rank test was used to compare the biochemical data at baseline and after 8 weeks of treatment. The difference in biochemical data was compared before and after 8 weeks of treatment using the Mann-Whitney U test. To analyze the strength of the relationship between the differences in GDF-15 and biochemical data, Pearson correlation coefficients were used. Differences in the evaluated variables between the responder group (GDF-15 decreased after treatment) and nonresponder group (GDF-15 not decreased after treatment) were compared using the Mann-Whitney U test. Statistical analyses were performed using SPSS version 18.0 (SPSS Inc., Chicago, IL, USA).

RESULTS

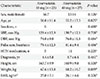
The clinical characteristics of the study population are shown in Table 1. The mean age was not significantly different between the 10 mg atorvastatin (56.0±11.4 years) and 40 mg atorvastatin groups (55.2±13.3 years). Other variables, including gender, weight, height, blood pressure, and pulse rate were not significantly different between the two groups (Table 1).
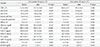
Multiple variables were compared between the two groups at baseline and after 8 weeks of treatment. The TC, LDL-C, and TGs were significantly decreased in both groups after 8 weeks of treatment. However, the changes in creatine phosphokinase, ALT, AST, insulin, C-peptide, HbA1c, glucose, HDL-C, and HOMA-IR index were not significant. Among the 50 participants, high-sensitivity C-reactive protein (hsCRP) was measured in 31 subjects (16 in the 10 mg atorvastatin group and 15 in the 40 mg atorvastatin group). A significant reduction in hsCRP was found in the 10 mg atorvastatin group (P=0.020) and 40 mg atorvastatin group (P=0.018). However, GDF-15 was not significantly changed in either group (Table 2).
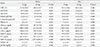
Comparison of the two groups showed that none of the variables were significantly different compared to the baseline levels, except LDL-C (82.7±18.8 mg/dL vs. 68.0±22.7 mg/dL, P=0.006) and TC (148.2±24.1 mg/dL vs. 132.3±26.2 mg/dL, P=0.023), which were lower in the 40 mg group than the 10 mg atorvastatin group after treatment. Other variables were not significantly different between the two groups after treatment (Table 3).
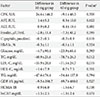
After analyzing the changes in numerous clinical parameters for each group, the differences in TC (P=0.012) and LDL-C (P=0.019) were significantly greater in the 40 mg atorvastatin group. The degree of difference for all other factors was not significantly different (Table 4).
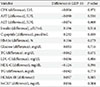
The extent of change in the GDF-15 levels and other diverse clinical factors after treatment was not statistically significantly correlated (Table 5).
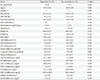
Cases with reduced GDF-15 levels after treatment were classified as 'responders' and those without reduced levels as 'non-responders,' and the clinical characteristics were then analyzed in each group. The responder group had more patients with hypertension (P=0.026), whereas the other factors were not significant (Table 6).

DISCUSSION

This study investigated the effect of treatment with atorvastatin on metabolic parameters and GDF-15 levels in type 2 diabetic patients. After treatment with atorvastatin, the levels of TC, LDL-C, and TGs were reduced, with greater reductions in the 40 mg compared to the 10 mg atorvastatin group, as expected. Additionally, hsCRP was reduced after treatment with atorvastatin; however, GDF-15 was not significantly changed in either group.
Comparison of the responder group, which showed decreased GDF-15 levels after statin therapy, and the non-responder group, which showed no decreased GDF-15, indicated that hypertension was only the significant common factor in the responder group. Other factors showed no significant difference between the two groups. In general, the GDF-15 level is increased in patients with hypertension, and Xu et al. [22] reported a positive correlation between GDF-15 and left ventricular hypertrophy, norepinephrine, and brain natriuretic peptide levels. Chen et al. [23] reported that the GDF-15 level was elevated in heart tissue based on a mouse model study of myocardial infarction after olmesartan treatment. In this study, there were 16 patients with hypertension, and 13 of 16 were treated with angiotensin receptor blockers or angiotensin converting enzyme inhibitors. These treatments may influence the baseline GDF-15 levels; however, because the type or dosage of these medications was not changed during the study, the effect was predicted to be insignificant.
The expression of GDF-15 is increased by high glucose or obesity [116172425], and high glucose induced GDF-15 expression is reactive oxygen species (ROS)- and p53-dependent [1]. High levels of GDF-15 indicate endothelial dysfunction and increase the risk of metabolic dysfunction, inflammation, vascular injury and accompanying cardiovascular complications [17]. Additionally, recent studies found that GDF-15 is a useful marker for the diagnosis of chronic inflammatory diseases, including prediabetes, diabetes, and acute coronary syndrome, cancer, chronic kidney diseases associated with oxidative stress, inflammation and endothelial dysfunction [262728293031]. However, reports on drugs affecting GDF-15 expression other than nonsteroidal anti-inflammatory drugs, which increase GDF-15 expression, are lacking [32]. Several studies analyzed the correlation between statins and GDF-15; however, the results were inconsistent. The pravastatin or atorvastatin evaluation and infection therapy-thrombolysis in myocardial infarction (PROVE-IT-TIMI) trial compared the mortality rates between intensive versus moderate statin therapy groups in acute coronary syndrome patients, and no significant change in GDF-15 after treatment with statins for 4 months was observed, which is consistent with our study results [33]. Conversely, another study evaluating the efficacy of GDF-15 for screening patients with heart failure showed that GDF-15 was lower in patients treated with statins due to a reduction in vascular inflammation but did not show changes of GDF-15 according to treatment with a statin [34].
Statins effectively modulate oxidative stress by reducing the generation of ROS [3536]. In an animal allograft model of atherosclerosis, statins inhibited the infiltration of inflammatory cells into the arterial wall by reducing the expression of chemokines, such as monocyte chemoattractant protein-1 [37]. Because oxidative stress and proinflammatory cytokines induce the expression of GDF-15 in macrophages, the authors hypothesized a negative correlation between statins and GDF-15 expression. However, in previous studies and our study, statin treatment did not affect GDF-15 levels. The short-term 4-month treatment period in our study and other previous studies, or the insufficient amount of atorvastatin (10 and 40 mg) may not cause any significant correlation between the two factors. In an apolipoprotein E-deficient mouse model, 10 g/kg/day atorvastatin significantly reduced macrophage infiltration in atherosclerotic plaques and the number of vulnerable plaques independently of a reduction in TC levels, and this treatment reduced chemokines and inflammatory markers, such as CRP and TNF-α [38]. Based on our study results, the dose of statins used was possibly insufficient, and further studies on the effect of high-dose statins on GDF-15 levels are needed. In another study, the effect of lowering the acute coronary event risk using statins was only significant in patients with low LDL-C levels [12]. However, because our study included patients with LDL-C over 100 mg/dL, these factors may have affected the results.
This study had several limitations, including insufficient dosage, duration of statin treatment and a small patient cohort. Although selection bias may have occurred due to a small study population, such bias was minimized through randomized control. Further studies are necessary to overcome such drawbacks.
In summary, treatment with 10 and 40 mg atorvastatin for 8 weeks reduced TC, LDL-C, and TG levels due to its lipid lowering effects and may affect inflammatory modulation by lowering hsCRP. However, atorvastatin had no significant effect on GDF-15 levels. Based on these results, we expect GDF-15 to be useful for the diagnosis of diabetes and acute coronary syndrome even when the patient is administered standard doses of statins.

Figures and Tables

Fig. 1

Flow diagram of the study patients. LDL-C, low density lipoprotein cholesterol; F/U, follow-up; Premed, before medication; Postmed, after medication.

dmj-40-70-g001
Table 1

General characteristics of the study subjects

dmj-40-70-i001
Characteristic Atorvastatin 10 mg (n=23) Atorvastatin 40 mg (n=27) P value
Sex, male:female 16:7 13:14 0.126a
Age, yr 56.0±11.4 55.2±13.3 0.825b
Smokers, n 6 4 0.480a
SBP, mm Hg 129.4±12.3 130.7±12.1 0.708b
DBP, mm Hg 74.0±9.0 76.0±11.0 0.484b
Pulse rate, beat/min 79.4±12.5 81.6±9.4 0.486b
HTN medication, n 5 11 0.225a
Diagnosis, yr 4.4±5.8 5.7±6.4 0.461b
Height, cm 163.7±9.9 160.9±9.8 0.320b
Weight, kg 67.6±13.8 68.2±16.7 0.889b
BMI, kg/m2 25.0±3.1 26.1 ± 4.6 0.326b

Values are presented as mean±standard deviation.

SBP, systolic blood pressure; DBP, diastolic blood pressure; HTN, hypertension; BMI, body mass index.

aP value determined using an independent chi-square test, bP value determined by Mann-Whitney U test.

Table 2

Comparison of various clinical factors before and after treatment

dmj-40-70-i002
Variable Atorvastatin 10 mg (n=23) Atorvastatin 40 mg (n=27)
Before After P valuea Before After P valuea
CPK, U/L 113.8±94.0 131.9±136.0 0.459 104.0±43.7 96.5±46.4 0.306
AST, IU/L 22.7±16.0 24.2±14.9 0.190 21.4±9.3 21.8±8.4 0.647
ALT, IU/L 25.9±19.9 26.8±16.6 0.312 27.0±17.0 27.4±14.8 0.484
Insulin, µIU/mL 13.6±11.5 10.8±8.3 0.171 21.6±45.6 14.3±15.3 0.377
C-peptide, pmol/mL 1.1±0.7 0.9±0.5 0.322 1.2±1.1 1.0±0.6 0.201
HbA1c, % 7.6±1.6 7.3±1.2 0.235 7.3±1.8 7.2±1.4 0.562
Glucose, mg/dL 158.9±53.0 154.2±62.0 0.110 167.9±75.0 144.0±49.0 0.053
TC, mg/dL 209.1±30.0 148.2±24.1 <0.001 211.0±22.8 132.3±26.2 <0.001
LDL-C, mg/dL 138.6±23.9 82.7±18.8 <0.001 139.5±24.2 68.0±22.7 <0.001
HDL-C, mg/dL 48.7±12.3 47.3±10.7 0.551 46.7±10.6 47.6±11.8 0.977
TG, mg/dL 181.3±93.1 133.7±75.9 0.012 191.3±117.4 129.8±62.6 0.001
GDF-15, pg/mL 1,460.6±874.8 1,451.0±770.8 0.745 1,271.6±801.0 1,341.4±855.2 0.665
HOMA-IR 5.1±4.0 4.2±4.8 0.463 6.5±9.6 4.9±4.7 0.253
hsCRP, mg/dL 2.6±2.7 1.3±1.1 0.020 2.3±2.6 1.0±0.7 0.018

Values are presented as mean±standard deviation.

CPK, creatine phosphokinase; AST, aspartate transaminase; ALT, alanine transaminase; HbA1c, glycosylated hemoglobin; TC, total cholesterol; LDL-C, low density lipoprotein cholesterol; HDL-C, high density lipoprotein cholesterol; TG, triglyceride; GDF-15, growth differentiation factor 15; HOMA-IR, homeostasis model assessment-estimated insulin resistance; hsCRP, high-sensitivity C-reactive protein.

aP value determined using the Wilcoxon signed rank test.

Table 3

Comparison of various clinical factors between the 10 and 40 mg groups before and after treatment

dmj-40-70-i003
Factor Before After
10 mg 40 mg P valuea 10 mg 40 mg P valuea
CPK, U/L 113.8±94.0 104.0±43.7 0.765 131.9±136.0 96.5±46.4 0.368
AST, IU/L 22.7±16.0 21.4±9.3 0.632 24.2±14.9 21.8±8.4 0.984
ALT, IU/L 25.9±19.9 27.0±17.0 0.447 26.8±16.6 27.4±14.8 0.572
Insulin, µIU/mL 13.6±11.5 21.6±45.6 0.624 10.8±8.3 14.3±15.3 0.408
C-peptide, pmol/mL 1.1±0.7 1.2±1.1 0.794 0.9±0.5 1.0±0.6 0.763
HbA1c, % 7.6±1.6 7.3±1.8 0.267 7.3±1.2 7.2±1.4 0.606
Glucose, mg/dL 158.9±53.0 167.9±75.0 0.640 154.2±62.0 144.0±49.0 0.540
TC, mg/dL 209.1±30.0 211.0±22.8 0.654 148.2±24.1 132.3±26.2 0.023
LDL-C, mg/dL 138.6±23.9 139.5±24.2 0.992 82.7±18.8 68.0±22.7 0.006
HDL-C, mg/dL 48.7±12.3 46.7±10.6 0.559 47.3±10.7 47.6±11.8 0.907
TG, mg/dL 181.3±93.1 191.3±117.4 0.968 133.7±75.9 129.8±62.6 0.876
GDF-15, pg/mL 1,460.6±874.8 1,271.6±801.0 0.280 1,451.0±770.8 1,341.4±855.2 0.376
HOMA-IR 5.1±4.0 6.5±9.6 0.984 4.2±4.8 4.9±4.7 0.355
hsCRP, mg/dL 2.6±2.7 2.3±2.6 0.486 1.3±1.1 1.0±0.7 0.989

Values are presented as mean±standard deviation.

CPK, creatine phosphokinase; AST, aspartate transaminase; ALT, alanine transaminase; HbA1c, glycosylated hemoglobin; TC, total cholesterol; LDL-C, low density lipoprotein cholesterol; HDL-C, high density lipoprotein cholesterol; TG, triglyceride; GDF-15, growth differentiation factor 15; HOMA-IR, homeostasis model assessment-estimated insulin resistance; hsCRP, high-sensitivity C-reactive protein.

aP value determined using the Mann-Whitney U test.

Table 4

Comparison of differences among various clinical factors between the 10 and 40 mg groups

dmj-40-70-i004
Factor Difference in 10 mg group Difference in 40 mg group P valuea
CPK, U/L 24.6±146.2 -9.1±48.3 0.359
AST, IU/L 1.4±5.2 0.3±10.0 0.622
ALT, IU/L 0.9±8.2 0.4±19.4 0.901
Insulin, µIU/mL -2.8±11.4 -7.3±41.2 0.599
C-peptide, pmol/mL -0.2±0.5 -0.2±0.9 0.818
HbA1c, % -0.3±1.1 -0.1±1.1 0.524
Glucose, mg/dL -4.7±90.4 -23.9±61.4 0.393
TC, mg/dL -60.9±21.6 -78.7±26.3 0.012
LDL-C, mg/dL -55.9±20.8 -71.5±24.7 0.019
HDL-C, mg/dL -1.4±7.9 0.7±7.5 0.351
TG, mg/dL -47.6±76.4 -54.4±107.8 0.794
GDF-15, pg/mL -9.5±398.7 69.7±480.0 0.527
HOMA-IR -0.9±6.0 -1.5±6.7 0.738
hsCRP, mg/dL -1.3±2.5 -1.3±2.4 0.979

Values are presented as mean±standard deviation.

CPK, creatine phosphokinase; AST, aspartate transaminase; ALT, alanine transaminase; HbA1c, glycosylated hemoglobin; TC, total cholesterol; LDL-C, low density lipoprotein cholesterol; HDL-C, high density lipoprotein cholesterol; TG, triglyceride; GDF-15, growth differentiation factor 15; HOMA-IR, homeostasis model assessment-estimated insulin resistance; hsCRP, high-sensitivity C-reactive protein.

aP value determined using the Mann-Whitney U test.

Table 5

Pearson's correlation coefficient between the differences in GDF-15 levels and the differences in various variables

dmj-40-70-i005
Variable Difference in GDF-15 P value
CPK (difference), U/L -0.006 0.971
AST (difference), IU/L -0.090 0.536
ALT (difference), IU/L -0.074 0.608
Insulin (difference), µIU/mL 0.196 0.314
C-peptide (difference), pmol/mL 0.232 0.109
HbA1c (difference), % 0.196 0.173
Glucose (difference), mg/dL 0.053 0.716
TC (difference), mg/dL -0.062 0.671
LDL-C (difference), mg/dL -0.036 0.806
HDL-C (difference), mg/dL -0.124 0.396
TG (difference), mg/dL -0.042 0.773
HOMA-IR (difference) 0.097 0.505
hsCRP (difference), mg/dL 0.016 0.504

All clinical factors are differences of the mean. Difference: after medication–before medication.

GDF-15, growth differentiation factor 15; CPK, creatine phosphokinase; AST, aspartate transaminase; ALT, alanine transaminase; HbA1c, glycosylated hemoglobin; TC, total cholesterol; LDL-C, low density lipoprotein cholesterol; HDL-C, high density lipoprotein cholesterol; TG, triglyceride; HOMA-IR, homeostasis model assessment-estimated insulin resistance; hsCRP, high-sensitivity C-reactive protein.

Table 6

Comparison of various clinical factors between GDF-15 responders and non-responders

dmj-40-70-i006
Factor Responders (n=26) Non-responders (n=24) P valuea
Sex, male:female 16:10 13:11 0.405
Age, yr 54.7±12.0 56.5±12.9 0.604
Smokers, n 5 5 0.582
SBP, mm Hg 131.2±12.4 129.0±11.9 0.542
DBP, mm Hg 76.7±9.4 73.2±10.4 0.217
Pulse rate, beat/min 81.3±10.2 79.9±11.8 0.658
HTN medication, n 12 4 0.026
Atorvastatin (10 mg/40 mg), n 12/14 11/13 0.603
Diagnosis, yr 4.9±5.3 5.3±6.9 0.818
Height, cm 164.0±10.2 160.1±9.2 0.162
Weight, kg 71.0±17.7 64.6±11.6 0.130
BMI, kg/m2 26.1±4.8 25.0±2.8 0.318
CPK (difference), U/L 33.2±143.5 -18.5±36.4 0.143
AST (difference), IU/L 2.1±6.4 -0.5±9.6 0.261
ALT (difference), IU/L 3.1±11.8 -2.1±18.0 0.239
Insulin (difference), µIU/mL -10.6±42.4 0.5±6.2 0.210
C-peptide (difference), pmol/mL -0.4±0.9 0.0±0.4 0.061
HbA1c (difference), % -0.3±1.0 -0.1±1.3 0.592
Glucose (difference), mg/dL -21.7±68.9 -7.9±83.8 0.528
TC (difference), mg/dL -91.7±25.1 -69.3±26.7 0.745
LDL-C (difference), mg/dL -65.8±25.0 -62.7±23.5 0.654
HDL-C (difference), mg/dL 1.2±8.4 -1.9±6.8 0.169
TG (difference), mg/dL -52.7±106.0 -49.8±80.8 0.912
GDF-15 (difference), pg/mL -219.9±319.3 307.6±392.5 <0.001
HOMA-IR (difference) -1.8±8.0 -0.7±3.9 0.556
hsCRP (difference), mg/dL -1.6±3.3 -1.0±1.0 0.356

Values are presented as mean±standard deviation. Responders: GDF-15 decreased after treatment. Non-responders: GDF-15 not decreased after treatment.

GDF-15, growth differentiation factor 15; SBP, systolic blood pressure; DBP, diastolic blood pressure; HTN, hypertension; BMI, body mass index; CPK, creatine phosphokinase; AST, aspartate transaminase; ALT, alanine transaminase; HbA1c, glycosylated hemoglobin; TC, total cholesterol; LDL-C, low density lipoprotein cholesterol; HDL-C, high density lipoprotein cholesterol; TG, triglyceride; HOMA-IR, homeostasis model assessment-estimated insulin resistance; hsCRP, high-sensitivity C-reactive protein.

aP value determined using the Mann-Whitney U test.

ACKNOWLEDGMENTS

This work was supported by a grant (HJK, 2010) from the Korean Diabetes Association.

Notes

CONFLICTS OF INTEREST No potential conflict of interest relevant to this article was reported.

References

1. Li J, Yang L, Qin W, Zhang G, Yuan J, Wang F. Adaptive induction of growth differentiation factor 15 attenuates endothelial cell apoptosis in response to high glucose stimulus. PLoS One. 2013; 8:e65549.
2. Bootcov MR, Bauskin AR, Valenzuela SM, Moore AG, Bansal M, He XY, Zhang HP, Donnellan M, Mahler S, Pryor K, Walsh BJ, Nicholson RC, Fairlie WD, Por SB, Robbins JM, Breit SN. MIC-1, a novel macrophage inhibitory cytokine, is a divergent member of the TGF-beta superfamily. Proc Natl Acad Sci U S A. 1997; 94:11514–11519.
3. Tan M, Wang Y, Guan K, Sun Y. PTGF-beta, a type beta transforming growth factor (TGF-beta) superfamily member, is a p53 target gene that inhibits tumor cell growth via TGF-beta signaling pathway. Proc Natl Acad Sci U S A. 2000; 97:109–114.
4. Breit SN, Johnen H, Cook AD, Tsai VW, Mohammad MG, Kuffner T, Zhang HP, Marquis CP, Jiang L, Lockwood G, Lee-Ng M, Husaini Y, Wu L, Hamilton JA, Brown DA. The TGF-beta superfamily cytokine, MIC-1/GDF15: a pleotrophic cytokine with roles in inflammation, cancer and metabolism. Growth Factors. 2011; 29:187–195.
5. Lindahl B. The story of growth differentiation factor 15: another piece of the puzzle. Clin Chem. 2013; 59:1550–1552.
6. Wallentin L, Zethelius B, Berglund L, Eggers KM, Lind L, Lindahl B, Wollert KC, Siegbahn A. GDF-15 for prognostication of cardiovascular and cancer morbidity and mortality in men. PLoS One. 2013; 8:e78797.
7. Blanco-Colio LM, Tunon J, Martin-Ventura JL, Egido J. Anti-inflammatory and immunomodulatory effects of statins. Kidney Int. 2003; 63:12–23.
8. Hornung RS. Reducing cholesterol and atherosclerosis. QJM. 2002; 95:339–341.
9. Cholesterol Treatment Trialists' (CTT) Collaborators. Kearney PM, Blackwell L, Collins R, Keech A, Simes J, Peto R, Armitage J, Baigent C. Efficacy of cholesterol-lowering therapy in 18,686 people with diabetes in 14 randomised trials of statins: a meta-analysis. Lancet. 2008; 371:117–125.
10. Baigent C, Keech A, Kearney PM, Blackwell L, Buck G, Pollicino C, Kirby A, Sourjina T, Peto R, Collins R, Simes R. Cholesterol Treatment Trialists' (CTT) Collaborators. Efficacy and safety of cholesterol-lowering treatment: prospective meta-analysis of data from 90,056 participants in 14 randomised trials of statins. Lancet. 2005; 366:1267–1278.
11. Albert MA, Danielson E, Rifai N, Ridker PM. PRINCE Investigators. Effect of statin therapy on C-reactive protein levels: the pravastatin inflammation/CRP evaluation (PRINCE): a randomized trial and cohort study. JAMA. 2001; 286:64–70.
12. Ridker PM, Rifai N, Clearfield M, Downs JR, Weis SE, Miles JS, Gotto AM Jr. Air Force/Texas Coronary Atherosclerosis Prevention Study Investigators. Measurement of C-reactive protein for the targeting of statin therapy in the primary prevention of acute coronary events. N Engl J Med. 2001; 344:1959–1965.
13. Ascer E, Bertolami MC, Venturinelli ML, Buccheri V, Souza J, Nicolau JC, Ramires JA, Serrano CV Jr. Atorvastatin reduces proinflammatory markers in hypercholesterolemic patients. Atherosclerosis. 2004; 177:161–166.
14. Mirmiran P, Bahadoran Z, Azizi F. Lipid accumulation product is associated with insulin resistance, lipid peroxidation, and systemic inflammation in type 2 diabetic patients. Endocrinol Metab (Seoul). 2014; 29:443–449.
15. Donath MY. Targeting inflammation in the treatment of type 2 diabetes: time to start. Nat Rev Drug Discov. 2014; 13:465–476.
16. Ding Q, Mracek T, Gonzalez-Muniesa P, Kos K, Wilding J, Trayhurn P, Bing C. Identification of macrophage inhibitory cytokine-1 in adipose tissue and its secretion as an adipokine by human adipocytes. Endocrinology. 2009; 150:1688–1696.
17. Kempf T, Guba-Quint A, Torgerson J, Magnone MC, Haefliger C, Bobadilla M, Wollert KC. Growth differentiation factor 15 predicts future insulin resistance and impaired glucose control in obese nondiabetic individuals: results from the XENDOS trial. Eur J Endocrinol. 2012; 167:671–678.
18. Hotamisligil GS, Arner P, Caro JF, Atkinson RL, Spiegelman BM. Increased adipose tissue expression of tumor necrosis factor-alpha in human obesity and insulin resistance. J Clin Invest. 1995; 95:2409–2415.
19. Hong JH, Chung HK, Park HY, Joung KH, Lee JH, Jung JG, Kim KS, Kim HJ, Ku BJ, Shong M. GDF15 is a novel biomarker for impaired fasting glucose. Diabetes Metab J. 2014; 38:472–479.
20. Daniels LB, Clopton P, Laughlin GA, Maisel AS, Barrett-Connor E. Growth-differentiation factor-15 is a robust, independent predictor of 11-year mortality risk in community-dwelling older adults: the Rancho Bernardo Study. Circulation. 2011; 123:2101–2110.
21. Rohatgi A, Patel P, Das SR, Ayers CR, Khera A, Martinez-Rumayor A, Berry JD, McGuire DK, de Lemos JA. Association of growth differentiation factor-15 with coronary atherosclerosis and mortality in a young, multiethnic population: observations from the Dallas Heart Study. Clin Chem. 2012; 58:172–182.
22. Xu XY, Nie Y, Wang FF, Bai Y, Lv ZZ, Zhang YY, Li ZJ, Gao W. Growth differentiation factor (GDF)-15 blocks norepinephrine-induced myocardial hypertrophy via a novel pathway involving inhibition of epidermal growth factor receptor transactivation. J Biol Chem. 2014; 289:10084–10094.
23. Chen B, Lu D, Fu Y, Zhang J, Huang X, Cao S, Xu D, Bin J, Kitakaze M, Huang Q, Liao Y. Olmesartan prevents cardiac rupture in mice with myocardial infarction by modulating growth differentiation factor 15 and p53. Br J Pharmacol. 2014; 171:3741–3753.
24. Dostalova I, Roubicek T, Bartlova M, Mraz M, Lacinova Z, Haluzikova D, Kavalkova P, Matoulek M, Kasalicky M, Haluzik M. Increased serum concentrations of macrophage inhibitory cytokine-1 in patients with obesity and type 2 diabetes mellitus: the influence of very low calorie diet. Eur J Endocrinol. 2009; 161:397–404.
25. Wollert KC, Kempf T. Growth differentiation factor 15 in heart failure: an update. Curr Heart Fail Rep. 2012; 9:337–345.
26. Ho JE, Hwang SJ, Wollert KC, Larson MG, Cheng S, Kempf T, Vasan RS, Januzzi JL, Wang TJ, Fox CS. Biomarkers of cardiovascular stress and incident chronic kidney disease. Clin Chem. 2013; 59:1613–1620.
27. Schlittenhardt D, Schober A, Strelau J, Bonaterra GA, Schmiedt W, Unsicker K, Metz J, Kinscherf R. Involvement of growth differentiation factor-15/macrophage inhibitory cytokine-1 (GDF-15/MIC-1) in oxLDL-induced apoptosis of human macrophages in vitro and in arteriosclerotic lesions. Cell Tissue Res. 2004; 318:325–333.
28. Lind L, Wallentin L, Kempf T, Tapken H, Quint A, Lindahl B, Olofsson S, Venge P, Larsson A, Hulthe J, Elmgren A, Wollert KC. Growth-differentiation factor-15 is an independent marker of cardiovascular dysfunction and disease in the elderly: results from the Prospective Investigation of the Vasculature in Uppsala Seniors (PIVUS) Study. Eur Heart J. 2009; 30:2346–2353.
29. Kempf T, von Haehling S, Peter T, Allhoff T, Cicoira M, Doehner W, Ponikowski P, Filippatos GS, Rozentryt P, Drexler H, Anker SD, Wollert KC. Prognostic utility of growth differentiation factor-15 in patients with chronic heart failure. J Am Coll Cardiol. 2007; 50:1054–1060.
30. Clerk A, Kemp TJ, Zoumpoulidou G, Sugden PH. Cardiac myocyte gene expression profiling during H2O2-induced apoptosis. Physiol Genomics. 2007; 29:118–127.
31. Han ES, Muller FL, Perez VI, Qi W, Liang H, Xi L, Fu C, Doyle E, Hickey M, Cornell J, Epstein CJ, Roberts LJ, Van Remmen H, Richardson A. The in vivo gene expression signature of oxidative stress. Physiol Genomics. 2008; 34:112–126.
32. Kim JS, Baek SJ, Sali T, Eling TE. The conventional nonsteroidal anti-inflammatory drug sulindac sulfide arrests ovarian cancer cell growth via the expression of NAG-1/MIC-1/GDF-15. Mol Cancer Ther. 2005; 4:487–493.
33. Bonaca MP, Morrow DA, Braunwald E, Cannon CP, Jiang S, Breher S, Sabatine MS, Kempf T, Wallentin L, Wollert KC. Growth differentiation factor-15 and risk of recurrent events in patients stabilized after acute coronary syndrome: observations from PROVE IT-TIMI 22. Arterioscler Thromb Vasc Biol. 2011; 31:203–210.
34. Wang F, Guo Y, Yu H, Zheng L, Mi L, Gao W. Growth differentiation factor 15 in different stages of heart failure: potential screening implications. Biomarkers. 2010; 15:671–676.
35. Beltowski J. Statins and modulation of oxidative stress. Toxicol Mech Methods. 2005; 15:61–92.
36. Lim S, Barter P. Antioxidant effects of statins in the management of cardiometabolic disorders. J Atheroscler Thromb. 2014; 21:997–1010.
37. Shimizu K, Aikawa M, Takayama K, Libby P, Mitchell RN. Direct anti-inflammatory mechanisms contribute to attenuation of experimental allograft arteriosclerosis by statins. Circulation. 2003; 108:2113–2120.
38. Nie P, Li D, Hu L, Jin S, Yu Y, Cai Z, Shao Q, Shen J, Yi J, Xiao H, Shen L, He B. Atorvastatin improves plaque stability in ApoE-knockout mice by regulating chemokines and chemokine receptors. PLoS One. 2014; 9:e97009.
TOOLS
ORCID iDs

Hyun Jin Kim
https://orcid.org/http://orcid.org/0000-0002-6760-4963

Bon Jeong Ku
https://orcid.org/http://orcid.org/0000-0002-3414-8949

Similar articles