

 PDF
PDF ePub
ePub Citation
 Print
Print


Introduction
Hypertension is one of the leading risk factors for developing cerebrovascular disease, stroke, myocardial infarction, congestive heart failure, renal disease, and peripheral vascular disease.1) Cerebrovascular disease is the second most prevalent disease after cancer, and is the greatest cause of mortality in Korea. In addition, patients with cerebrovascular disease are burdened with socio-economic problems, particularly following the acute medical event. In fact, medical costs due to cerebrovascular disease accounted for 5% of the 2010 total health care costs.2)
According to the 2010 Korea National Health and Nutrition Examination Survey, the recognition, treatment, and control of hypertension patients was 67.9%, 61.9% and 69.7%, respectively.3) Health insurance fees in 2010 were estimated to be approximately $1.96 billion for patients with hypertension.4) In particular, anti-hypertensive drug costs, based on outpatient prescriptions, were estimated to be approximately $1.47 billion.5)
Hypertension is one of the diseases with which Koreans are greatly burdened, and it has been reported to have a significant effect on their overall medication adherence (MA), hospitalization rates, number of visits to an emergency department, and the natural history of other conditions.6) This has led to the speculation that MA and anti-hypertensive pharmacological treatments may be useful in preventing the occurrence of complications and in successfully controlling blood pressure.7)
According to studies that have been conducted to examine MA, anti-hypertensive treatments are effective in the primary prevention of both hemorrhagic and ischemic strokes (relative risk decreased by 35-45%).8) Additionally, a meta-analysis of randomized controlled trials using antihypertensive agents found a 20-30% reduction in stroke risk when there was a 1-3 mmHg decrease in systolic blood pressure.8)
Furthermore, hypertensive patients with an MA of <80% were at a 2.38 times higher risk of hospitalization compared to those whose MA was ≥80%.9) Moreover, patients with a greater anti-hypertensive MA, who presented with complications, incurred lower medical costs.10)
MA is essential for not only for managing patients with hypertension but also for preventing the occurrence of complications. Therefore, we measured health outcomes according to the level of MA, analyzed the incidence of complications in patients with good MA, and clarified the effects that might affect MA. We attempted to identify the relationship between level of MA and complication incidence among new hypertensive patients in Korea.
Subjects and Methods
Study population
We defined the study patients using claims data from the National Health Insurance Service (NHIS), which collected health utilization on a nationwide scale. Korea's National Health Insurance (NHI) system manages mandatory universal health insurance. The Korean NHI claims database contains information on the entire population covered by the health insurance system and is nationally representative of all medical and prescription drug claims records.11)12) We used this data to identify patients with hypertension.
The inclusion criteria were as follows:
(1) patients with hypertension whose major diagnoses included ICD-10 code: I10-I15, excluding I14
(2) patients aged 20 years or older
(3) patients with newly diagnosed hypertension who have not used medical services for the past year
(4) patients who filed claims for health insurance coverage for hypertension more than once in the year 2008
(5) patients who were prescribed anti-hypertensive drugs at least once.
The date of the first prescription (index date) was defined as that when the study patients were first prescribed with anti-hypertensive drugs in 2008
The exclusion criteria for the current study were as follows:
(1) patients with newly diagnosed hypertension who died within two years after they received their first prescription
(2) patients who suffered complications such as stroke or ischemic heart disease within one year before medication was first prescribed and two years following the first prescription; the purpose of this criterion was to identify the association between the MA of newly hypertensive patients and complication incidence during the 2-year follow-up.13)
We also defined patients who were in need of anti-hypertensive pharmacological treatment as those who had been given anti-hypertensive agents for more than 14 days over the past six months.10)
Study design
Data from January 1, 2007 to December 31, 2011 were used in this retrospective cohort study. We also performed follow-up for up to three years, depending on the cohorts. The 3-year follow-up period was composed of a 2-year period, where the MA was evaluated based on the index date when patients initially used the anti-hypertensive medical service treatments as well as a 1-year period where treatment outcomes, such as complications, were evaluated. In the present study, the same length of time was applied to all patients, but there was variability in the accuracy of the length of follow-up period depending on the patients. For instance, if patients were first diagnosed with hypertension on January 1, 2008, they would be followed up with until December 31, 2010. In addition, if they were first diagnosed with hypertension on June 1, 2008, the follow-up period lasted until June 30, 2011.
Measures
Independent variable: medication adherence
MA is defined as the degree to which patients adhere to the drugs that have been prescribed for them by their physicians.7) Indicators of MA include the medication possession ratio (MPR), medication adherence rating, cumulative medication adherence, and proportion of days covered. Of these, the MPR is based on billing claims data and is useful in evaluating MA in patients with chronic diseases.13) We therefore measured the MPR using in-hospital and hospital pharmacy dispensing data.
MPR was calculated as the proportion of the number of days of the drug was used following its prescription out of the total number of days accounted for by the prescription end date.14) The MPR measurement period was established as 2 years from the date of the first prescription, since this time period was similar to that in which the MA was measured. MPR was calculated for each patient according to the following formula:
MPR (%)=(the total number of days of prescription treatment during the follow-up period/the length of the follow-up period, ranging from prescription beginning to end date)×100
Where the total number of days of prescription treatment was greater than the length of the follow-up period, all the MPRs indicating >100% were considered to be 100%. In addition, the simultaneous prescription of multiple anti-hypertensive treatment agents was defined as concomitant medication. In these cases, the number of the days of prescription was defined as the maximal value, with adjustments made for variability.10)
MPR was classified into five categories: 0-19%, 20-39%, 40-59%, 60-79%, and 80-100%. As previously reported, depending on an MPR cut-off value of 80%, the study patients were assigned to either the MA (MPR≥80%) or non-MA group (MPR<80%).15)
Anti-hypertensive treatment agents were classified into 12 groups based on a list of drugs that were covered by health insurance as of July 2011, with reference to the World Health Organization Anatomical Therapeutic Chemical classification system (Supplementary Table in the online-only Data Supplement).
Covariates
To evaluate hypertension severity, we analyzed controlled variables, such as MA, the main types and location of medical institutions, Charlson Comorbidity Index (CCI) scores, history of hospitalization during the past year, and history of diabetes mellitus.
To evaluate the severity of disease depending on the number of anti-hypertensive treatment agents, we evaluated their constituents at the time of the first prescription as well as the medical institutions the study patients visited during the year following their first prescription (1, 2-3 and 4+), as surrogate variables.
Dependent variables
In the present study, for complications of hypertension, we selected ischemic heart disease (ICD-10 code I20-I25) and cerebrovascular disease (ICD-10 code I60-I63).16) Moreover, to include the incident case of complications arising from hypertension only, we used defined hospitalization due to complications as well as when individuals visited outpatient clinics for the management of corresponding morbidities as major diagnoses for more than three times or when they were hospitalized more than once.10) MA was evaluated based on health outcomes, which was assessed according to the number of complications arising during the final year of the 3-year follow-up period.
Statistical analysis
To identify the correlation between MA and complication incidence, based on sex, age, type of health insurance coverage, main types and locations of medical institutions, CCI scores, past history of hospitalization, and past history of diabetes mellitus, MPR mean and standard deviation were analyzed using Student's t-test and ANOVA. The MPR was classified into five categories, for which a Chi-squared test was performed to analyze the statistical significance of the MPR differences.
To compare complication incidence depending on MPR level, we controlled for possible confounding variables including sex, age, and type of health insurance coverage, main types and locations of medical institutions, CCI scores, a past history of hospitalization or diabetes, the number of prescribed drugs taken, and the number of medical institutions visited during the first year. Subsequently, we performed an analysis using Cox's proportional hazards model, for which we defined the time to event as the length of the period extending from the index date to the date at which medical services were used to treat complications. All statistical analyses were conducted using SAS 9.2 (SAS Institute Inc., Cary, NC, USA). The level of statistical significance was determined as below 5%. The study was approved by the Institutional Review Board of Korea University (1040548-KU-IRB-13-164-A-1).
Results
Baseline and clinical characteristics of the patients
In 2008, a total of 4294773 patients were diagnosed with hypertension and were prescribed anti-hypertensive medications. Of these, 985722 were classified as newly hypertensive patients. In the present study, we enrolled 564782 patients (who met the inclusion/exclusion criteria (Fig. 1).
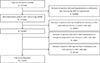
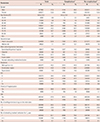
The number of newly-diagnosed patients who underwent treatment in 2008 was 564782, and there were slightly more females treated than males (52.6% vs. 47.5%). The mean age of the study patients was 58.8 years. The proportion of study patients in each age group was as follows: 50-59 years: 26.4%, 60-69 years: 25.2%, and 40-49 years: 19.7%. The overwhelming majority (92.9%) of patients had health insurance.
Concerning the treatment facilities, most patients (67.7%) were seen at local clinics, followed by 14.0% at public health centers, and 10.6% at specialized and general hospitals. Just under half of these facilities (45.2%) were located in metropolitan areas, 43.0% were in small urban areas, and 11.8% were in rural districts. The breakdown of patients' CCI scores was as follows: 0 points (58.5%), 1 point (25.2%), 2 points (9.9%), and 3 points (6.4%).
The proportion of patients who were hospitalized during the first year prior to the time of the first prescription was 1.1%. The proportion of patients with a past history of diabetes was 12.1%. The proportions of anti-hypertensive drug constituents at the time of first prescription date were as follows: 1 (69.2%), 2 (25.6%), and more than 3 (5.2%). In addition, the number of medical institutions used by the patients during the first year of follow-up is shown in Table 1. Most patients (82.1%) used only one institution during their first year of follow up.
Table 1
General characteristics of patients with newly-diagnosed hypertension
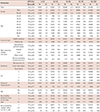
Concerning changes in MA based on patient characteristics, the level of MA was 77.0% in men, which was relatively higher than that of women. In addition, mean MPR was greater in the older age group (77.9% in the 50-59-year-old group being the highest) as compared to the younger age group. Additionally, mean MPR was the highest in patients who used health insurance. Most (82.6%) of the patients visited public health centers, while 77.0% used specialized and general hospitals and 76.0% used local clinics. Mean MPR was relatively higher among patients who used medical institutions in metropolitan cities, those who had no past history of hospitalization, and those who had no past history of diabetes (Table 2). During the 3 years of follow up, 1.5% of the study sample developed complications. The incidence of cardiovascular complications was 0.1%, 0.2%, 0.2%, 0.3%, and 0.8% among the participants with MPRs of 0-19%, 20-39%, 40-59%, 60-79%, and 80-100%, respectively.
Table 2
Medication possession ratio in patients newly diagnosed with hypertension in 2008
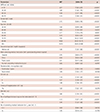
To examine the risk of developing complications based on MA level, we applied Cox's proportional hazards model (Table 3). There was a 1.36 times higher risk of developing complications in the 40-59% MPR group (95% confidence interval [CI]: 1.27-1.45) compared to the MA group (MPR≥80%) and a 2.01 times higher risk of developing complications in the <20% MPR group (95% CI: 1.82-2.23). Overall, those who had a poorest MA were at the highest risk of developing complications.
Table 3
Multivariable-adjusted hazard ratios for the association between medication possession ratio and complication rate among patients with newly-diagnosed hypertension
*
Cox's proportional hazards model: adjusted for gender, age (20-29, 30-39, 40-49, 50-59, 60-69, 70-79, 80-89, and ≥90 years), the type of health insurance coverage (health insurance or medical aid), the main types of medical institutions (specialized or general hospitals, hospitals, local clinics, public health centers, and non-applicable), the location of medical institutions (metropolitan city, small urban areas, and rural districts), CCI (0, 1, 2, and ≥3), past history of hospitalization (yes or no) and diabetes mellitus (yes or no), the number of anti-hypertensive drugs on the index date (1, 2, and ≥3), and the number of medical institutions for the 1st one year (1, 2-3, and ≥4). HR: hazard ratio, CI: confidence interval, MPR: medication possession ratio, ref.: reference, CCI: Charlson Comorbidity Index, DM: diabetes mellitus
The risk of developing complications was higher with increasing patient age. As compared to patients in their 20's, the complication risk was double that for those in their 40 s and was 7.63 times higher for those in their 70 s. Importantly, the risk of developing complications was 1.45 times higher among those who did not have health insurance. The risk of developing complications was lower among patients who mainly used hospitals, local clinics, and public health centers compared to those who used specialized or general hospitals. With respect to the location of medical institutions, as compared with metropolitan cities, the risk of developing complications among patients at medical institutions in small urban cities and rural districts was 1.07 and 1.09 times greater, respectively. As compared to patients with a CCI score of 0, the risk of developing complications was 1.49 times greater among those whose CCI scores were 3 points. In patients who had a past history of hospitalization or diabetes mellitus over the past year, the risk of developing complications was 1.20 and 1.80 times higher, respectively. Among patients taking more than 3 different anti-hypertensive medicines at the time of the first prescription date, the risk of developing complications was 1.44 times greater, as compared to those who took only 1 anti-hypertensive drug at that time.
Discussion
In the present study, MA was relatively higher in men compared to women as well as among the 50-59 year-old age group. MA was lower, however, for those in the older age groups. In addition, higher rates of MA was associated with having health insurance services, public health centers located in metropolitan cities, more than three therapeutic agents at the time of the first prescription, and a smaller number of medical institutions visited during the first year after prescription.
According to a study using the Ontario Prescription Database with newly hypertensive patients, the 1-year and 2-year MPRs were 73% and 66%, respectively, both of which were slightly lower, compared to our results.17) In addition, according to a previous study that was conducted among newly hypertensive patients in 2006, the mean MPR value was 76.4%. The proportion of the patients in the MA group was 52.9%.18) This discrepancy may be due to baseline differences between the study populations, definition, data, the types of prescribed drugs, and methods for measuring MA in the present and aforementioned studies. Although it is difficult to directly compare between previous reports and our results, the level of medication adherence among Korean hypertensive patients appears to be relatively higher, based on overall mean MPR.
Of the factors that may affect MA, older age (up to the age of 60 years) was associated with improved adherence to antihypertensive medications. This is consistent with previous reports. According to a study conducted among individuals from Gwacheon, medication adherence was relatively higher in the 50-59-years-old age group, followed by the 60-69-years-old group. In addition, it was the lowest among those between the ages of 40 and 49.19) According to previous reports, both MA and continuity of care were lower for younger patients.20) Moreover, in the present study, the mean MPR was 69.31% for those between the ages of 20 and 29 years old, which was the lowest among all groups. However, the degree of MA was lowest among those aged 60 and older.
This was may be due to the following reasons:
(1) Most of the elderly received multiple medications due to the presence of one or more comorbidity.
(2) The age-related decrease in psychomotor abilities and decreased independence in completing daily activities eventually leads to decreased MA levels.
(3) In the presence of pharmaceutical treatment for chronic diseases other than hypertension anti-hypertensive treatment agents, it is often more difficult for patients to take the anti-hypertensive treatment agents as well.21)
It can, therefore, be quite reasonably assumed that the degree of MA would be lower among those aged 60 and older.21)
As CCI scores increased, the level of MA also increased. Moreover, previous studies have shown that the degree of MA was relatively higher among patients who concurrently suffered from cardiovascular diseases or diabetes.22) In addition, a past history of angina pectoris or myocardial infarction had a positive effect (improved) on MA.23) The level of MA was higher among patients who used health insurance services, an observation that is in keeping with findings from previous studies. This may, in part, be due to the cost of anti-hypertensive medications. However, for Medical aid in Korea, out-of-pocket payment is low; thus, the economic burden for Medical aid is relatively small.24)
However, prior studies have reported that cost-related non-adherence is prevalent among patients with mood disorders and those who have greater disease burden, irrespective of drug coverage status, poverty level, or out-of-pocket drug costs.25) Thus, one may speculate that high disease burden can contribute to lower MA.
Previous studies have shown that MA increased when there was a greater number of treatment agents, which is consistent with our results.26) Further studies are warranted, however, to examine differences depending on the constituents of treatment agents because there was a significant difference in MA.
The risk of developing complications was 1.36 times higher (95% CI: 1.27-1.45) in the MA group (MPR≥80%) compared to the MPR 40-59%. When MPR was lower than 20%, the complication risk was 2.01 times higher (95% CI: 1.82-2.23). Taken together, these findings indicate that patients with a lower MA are at a higher risk of developing complications.
In patients with a lower MA for anti-hypertensive drugs, the incidence of cerebrovascular disease was significantly increased, leading to a direct increase in overall medical costs. According to a study conducted among newly hypertensive patients, there was an increase in the risk of developing coronary artery diseases, cerebrovascular disease, and congestive heart failure by 1.07, 1.13, and 1.42 times, respectively, in the non-MA group (MPR<80%).27) In addition, according to a study conducted in Australia, there was a lower risk of developing a first, or fatal, cerebrovascular disease event in the MA group (MPR>80%) by 0.81 times and a 0.58 times decreased risk of cardiac failure compared to the non-MA group.28) These findings are in keeping with our results. Based on these findings, there may be an increased risk of developing complications when there is a reduction in anti-hypertensive MA followed by increased hospitalization and mortality. Further studies are therefore warranted to reduce the risk of developing complications by raising the MA for anti-hypertensive drugs.
There are several limitations to the current study. First, we analyzed the NHIS data and did not completely consider patient-related characteristics, such as economic status and health-seeking behavior. In particular, although there is a close relationship between the economic status of the patients and their health-seeking behaviors, we did not consider it due to a limited amount of available data. To resolve this, we used the main types of medical institutions as surrogate variables. In addition, as the surrogate variables are indicative of the severity of hypertension, an examination of risk factors associated with the occurrence of complications, such as a past history of smoking, serum cholesterol levels, blood pressure, and obesity were also needed. However, these key risk factor data are not documented in the NHIS database. We therefore analyzed surrogate variables that are indicative of hypertension severity, such as a past history of hospitalization, the frequency of visits to the outpatient desk of a clinical department, CCI scores, and a past history of diabetes. However, because we did not adjust the characteristics of patients such as hypertension, hyperlipidemia and obesity directly, the effect of MA may be overestimated in this study. Therefore, further studies are warranted to identify the relationship between MA and health outcomes.
In addition, we measured medication adherence indirectly from administrative claims data using MPR. MPR is an indirect method for calculating adherence based on billing claims data. According to the MPR formula, it is necessary to hypothesize that the number of days since the time of the prescription is exactly the same as the number of days during which the patients actually took the drugs. It is certainly possible that there may be a difference between the records of long-term administration of drugs and their actual records. Nevertheless, the MPR mode was used to easily evaluate the status of MA in patients with chronic diseases and enabled comparison with the results of other studies. Therefore, to assess compliance to anti-hypertensive medications using retrospective data, MPR may be the best predictive measure.13)
Our results indicate that MA affected health outcomes due to hypertension in hypertensive patients. In newly hypertensive patients, assessing MA may be one of the strategies for reducing the risks of developing cerebrovascular disease complications. Moreover, it could also be used as an alternative for preventing long-term loss of productivity due to medical costs and disability arising from cerebrovascular disease.
Various policy-based approaches are essential for strengthening MA for the purposes of controlling hypertension in a patient-customized manner. In particular, our results showed there was a close relationship between MA and health outcomes in newly hypertensive patients and in those who were in need of primary medical services. These findings suggest that the current system used to manage chronic diseases should be strengthened by the development of polices that enable continuing therapy by primary care physicians.20)
Finally, factors that may interfere with MA include psychological factors such as depression, patients' attitudes toward treatment, complex drug therapy, amnesia, and decreased social support. Therefore, healthcare providers should maintain a continuous relationship between patients and physicians and should provide consultation for them on a regular basis. This should also be accompanied by the preparation of a policy establishing healthcare promotion medical fees and incentive payments for the purpose of compensating the efforts of medical institutions on a nationwide scale. Furthermore, by reducing unnecessary in-hospital treatments through the promotion of patient health, medical costs arising from complications may decrease in the long term.
 XML Download