

 PDF
PDF ePub
ePub Citation
 Print
Print


Abstract
Purpose
This study was done to investigate the prevalence and factors affecting body shape misperception among Korean adult women.
Methods
We analyzed raw data from the fourth Korean Longitudinal Survey of Women and Families, for 7,658 women over 20 years of age. For the multiple logistic regression model, the dependent variable was existence of misperception (yes/no).
Results
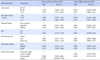
The prevalence of body shape misperception was 42.6% (overestimation 6.5%, underestimation 36.1%). Multiple logistic regression analysis revealed that age, education level, marital status, economic status and BMI were significantly associated with body shape underestimation. Education level and BMI were significantly associated with body shape overestimation.
Figures and Tables
Table 1
Characteristics and Body Shape Perception of Subjects (N=7,658)
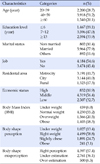
Table 2
Distribution of Body Shape Perception within Each BMI based Weight Status (N=7,658)
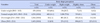
Table 3
Comparison of Characteristics of Subjects between Right and Misperception of Body Shape (N=7,658)
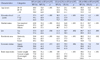
Table 4
Affecting Factors on Body Shape Misperception (N=7,658)
Summary Statement
▪ What is already known about this topic?
The misperception of body shape is different depending on gender, age, weight status, a factor harmful to physical and mental health.
▪ What this paper adds?
Age, education level, marital status, economic status and BMI are associated with body shape underestimation. Education level and BMI are associated with body shape overestimation.
▪ Implications for practice, education and/or policy
Identifying ways to correct body shape misperception and provide women with effective policies for maintaining proper weight and obesity management.
References
1. Jin YH. A comparative study on dietary habits and dietary attitudes among middle school students with different obesity indexes. Korean J Community Nutr. 2002; 7(2):156–166.
2. Al Sabbah H, Vereecken C, Abdeen Z, Kelly C, Ojala K, Németh A, et al. Weight control behaviors among overweight, normal weight and underweight adolescents in Palestine: Findings from the national study of Palestinian school children (HBSC-WBG2004). Int J Eat Disord. 2010; 43(4):326–336.
3. Kim IH. The effect of body image on clothing behavior and weight control of women. J Korean Soc Cloth Text. 2010; 34(9):1442–1453.
4. Chung MY, Kim SH, Oh JS. Comparison of obesity-related life patterns with according to body mass index and self-awareness of body shape. Asian J Beauty Cosmetol. 2013; 11(6):1109–1115.
5. Stein KF, Hedger KM. Body weight and shape self-cognitions, emotional distress and disordered eating in middle adolescent girls. Arch Psychiatr Nurs. 1997; 11(5):264–275.

6. Brener ND, Eaton DK, Lowry R, McMauns T. The association between weight perception and BMI among high school students. Obes Res. 2004; 12(11):1866–1874.
7. Kwon BY. The relationship between socioeconomic status and distorted body image [master's thesis]. Seoul: Korea University;2010.
8. Kim DS, Cho Y, Cho SI, Lim IS. Body weight perception, unhealthy weight control behaviors, and suicidal ideation among Korean adolescents. J Sch Health. 2009; 79(12):585–592.
9. Kim MO, Chang UJ. A study on the perception of obesity by age and the attitude toward weight control. Korean J Food Nutr. 2009; 22(1):110–122.
10. Calle EE, Rodriguez C, Walker-Thurmond K, Thun MJ. Overweight, obesity, and mortality from cancer in a prospectively studied cohort of US adults. N Engl J Med. 2003; 348(17):1625–1638.
11. Berrington de Gonzalez A, Hartge P, Cerhan JR, Flint AJ, Hannan L, Maclnnis RJ, et al. Body mass index and mortality among 1.46 million white adults. N Engl J Med. 2010; 363(23):2211–2219.
12. Oh SW, Yoon YS, Shin SA. Effects of excess weight on cancer incidences depending on cancer sites and histologic findings among men: Korea National Health Insurance Corporation Study. J Clin Oncol. 2005; 23(21):4742–4754.
13. Bennett GG, Wolin KY. Satisfied or unaware? Racial differences in perceived weight status. Int J Behav Nutr Phys Act. 2006; 3:40.
14. Yoo JE, Oh DS, Kim NK. How does body-shape perception affect the weight control practices?: 2012 Korea National Health and Nutrition Examination Survey. J Soc Korean Med Obes Res. 2014; 14(1):29–35.
15. Wardle J, Johnson F. Weight and dieting: Examining levels of weight concern in British adults. Int J Obes Relat Metab Disord. 2002; 26(8):1144–1149.
16. Chang VW, Christakis NA. Self-perception of weight appropriateness in the United States. Am J Prev Med. 2003; 24(4):332–339.
17. Dorsey RR, Eberhardt MS, Ogden CL. Racial/ethnic differences in weight perception. Obesity. 2009; 17(4):790–795.
18. Odone A, Gallus S, Lugo A, Zuccaro P, Colombo P, Bosetti C, et al. Weight perception among Italian adults, 2006-2010. Eur J Cancer Prev. 2014; 23(2):141–146.
19. Yaemsiri S, Slining MM, Agarwal SK. Perceived weight status, overweight diagnosis, and weight control among US adults: The NHANES 2003-2008 Study. Int J Obes. 2011; 35(8):1063–1070.
20. Chuang HT, Lee YC. Analysis of factors found to affect self-perceived weight status in Australia. J Nurs Res. 2010; 18(3):227–237.
21. Kim S, So WY. Prevalence and sociodemographic trends of weight misperception in Korean adolescents. BMC Public Health. 2014; 14:452.
22. Korean Society for the Study of Obesity. Practice guideline for obesity 2012 [internet]. Seoul: Korean Society for the Study of Obesity;2015. cited 2015 November 30. Available from: http://www.kosso.or.kr/.
23. Ministry of Health and Welfare. Korea Centers for Disease Control and Prevention. Korea Health Statistics 2012: Korea National Health and Nutrition Examination Survey (KNHANES V-3). Cheongwon: Korea Centers for Disease Control and Prevention;2013.
24. Lim H, Wang Y. Body weight misperception patterns and their association with health-related factors among adolescents in South Korea. Obesity. 2013; 21(12):2596–2603.
25. Kim BS. A difference on body-type recognition and weight adjustment according to BMI of sport center members [master's thesis]. Yongin: Yongin University;2009.
26. Boo S. Misperception of body weight and associated factors. Nurs Health Sci. 2014; 16(4):468–475.
27. Wardle J, Haase AM, Steptoe A. Body image and weight control in young adults: International comparisons in university students from 22 countries. Int J Obes. 2006; 30(4):644–651.
28. Wardle J, Cooke L. The impact of obesity on psychological well-being. Best Pract Res Clin Endocrinol Metab. 2005; 19(3):421–440.
 XML Download