

 PDF
PDF ePub
ePub Citation
 Print
Print


INTRODUCTION
Dental clinics often use two-dimensional (2D) photographs for examination of treatment procedures step-by-step or comparison of patient's states between before- and aftertreatment. However, because photographs are 2D representations of three-dimensional (3D) objects, the use of photographs is limited. Using a 3D camera can overcome these limitations. If the 3D coordinates of points from 2D images can be predicted, distances and angles between points can be calculated.
When two cameras are installed on a computer and arranged as the human eye, the two cameras provide different imaging information, that is, caused by so-called disparity like the eyes. Points from the two images can be matched and depth maps (autostereograms) can be created using information about the corresponding points and the baseline separation of the two cameras. The 3D position information of objects can be calculated using this technique.1 Recently, stereoscopic-based methods have been used in various research fields. Dentistry might benefit from this method.
Retention is a long-standing topic of research on fixed dental prosthodontics.2 Several studies have investigated the axial wall inclination to the tooth axis in abutment tooth preparation.3,4,5,6,7,8,9 Typical ways to express axial wall convergence angles are taper and convergence angle. Taper indicates the angle between one axial wall and the long axis of abutment. Convergence angles are the angles between two axial walls.6 As the degree of taper or convergence angle decreases, the retention of a complete veneer crown increases.6,7,10,11 A convergence angle of 4-14° is recommended by many studies.12,13,14 Obtaining the recommended inclination angle when forming an abutment tooth in the oral cavity is difficult because of limitations in accessibility, vision and operator skill.15,16 Clinical research on dental students, intern dentists, and professional dentists shows a clinically acceptable tooth inclination angle of 10-24° which is larger than the theoretically recommended value.5,11,17,18,19,20,21,22
Studies on abutment slope angle have mainly focused on teeth prepared in clinical practice and in vitro experiments on tooth inclination to obtain maximum retention. Measurement methods have not been standardized among different studies. The method most commonly used is a tracing technique, introduced in an initial study.17,19,23,24,25 This method uses an image output or an image magnified with a projector. Convergence angles from the extension lines of abutment teeth are measured wi th a protractor. Conventional methods of measuring 3D objects based on 2D projected images can distort the angle of 3D surfaces. Thus, values can differ among measurers, giving the method a low reliability. The purpose of this study was to develop a new dental image processing system using a 3D camera and to evaluate the reliability of the system by using it for axial wall convergence angle measurements.
MATERIALS AND METHODS
A stereovision-based dental image processing system using a stereo camera (Bumblebee2, Pointgrey, Richmond, Canada), notebook computer (E210, LG electronics, Seoul, Korea) and C++ programming (Visual Studio 2010, Microsoft, Seattle, WA, USA) was developed. The system was designed to take photographs of a prepared tooth and show relative and absolute coordinates, length and angulation, degree of enlargement, and information about the translation pixels assigned to the tooth. A 3D coordinate window allows the operator to measure the slope angle of the abutment tooth by taking points and drawing lines.
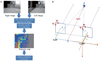
The image processing flow and a diagram showing the principle of the 3D image mounted on the stereo system are in Fig. 1. Each image was obtained from two cameras. A point on the right image was selected and the corresponding points from the left image were found. Disparity was calculated between two points and a disparity map created. Distance on Z-axis using the disparity was calculated and a depth map created. The 3D coordinates of each point were calculated to generate a depth map.1
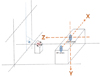
Examiners measured the axial wall convergence angles for artificial abutments using the stereovision-based image processing system. The measured axial wall was photographed using the camera and four lines were drawn on the captured image. The four lines were converted into four vectors and the angles between each vector and the XY plane were calculated (Fig. 2). The taper of the axial wall was the arithmetic mean of the four calculated angles (Bucco-palatal convergence angle = buccal taper + palatal taper, mesio-distal convergence angle = mesial taper + distal taper).
Right maxillary second molars that were made of resin (Nissin Dental Product Inc., Kyoto, Japan) were used in this study. These artificial teeth were prepared by students from the Seoul National University School of Dentistry. A dental model (D85S-TRM.406, Nissin Dental Product Inc., Kyoto, Japan) was mounted on a phantom jaw (Shinhung Co., Ltd., Seoul, Korea) and abutments were prepared. Seven abutments were selected from the collected abutments.
Two examiners measured axial wall convergence angles for the seven artificial abutments using the tracing-based method (TBM); two examiners took photographs of the mesial and distal surfaces with a digital camera (IXY 600, Cannon Inc., Tokyo, Japan). The pictures were printed on A4-sized paper, and the printed image size was 1.4 times the actual size. The TBM for measuring the cervical one-third of the axial wall convergence angle used a protractor after tracing. This test was repeated three times.
Two examiners measured axial wall convergence angles for same artificial abutments using the stereovision-based method (SVBM) described above. Tests were also repeated three times.
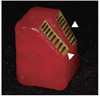
To assess the accuracy of measurement methods used to determine the value of angles, five wax abutment models in simplified abutment forms were made (Fig. 3). The models were designed to get angles that were designated as true values in this study. The buccal walls of wax abutment models were divided in half to give two kinds of convergence angles (Fig. 3, Table 1).
Two examiners measured axial wall convergence angles for five wax abutment models using the TBM. Pictures of mesial surfaces were taken with a digital camera (IXY 600, Cannon Inc., Tokyo, Japan). As above, tests were repeated three times, pictures were printed to images 1.4 times actual size and a TBM for measuring the axial wall convergence angle used a protractor after tracing. Examiners measured axial wall convergence angles for the same wax abutment models using the SVBM. Tests were repeated three times.
Intraclass correlation coefficient (ICC) was used to assess intra- and inter-examiner reliabilities.26,27,28,29 A 2D mixed model was used and 95% confidence intervals were determined. Bland-Altman plots were used to determine differences in graphs between TBMs and SVBMs versus the mean of the results of the two methods. Paired t-test was used to determine the significance of differences between tracing- and the stereovision-based measurements, and between the bucco-palatal and mesio-distal convergence angles.
The method that gave the values closest to true values was determined. Paired t-tests compared measured angles with true angle values. Statistical operations were performed using PASW Statistics 21 (IBM Co., Armonk, NY, USA) with 95% reliability.
RESULTS
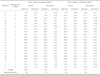
ICC was used to assess intra-examiner reliability (Table 2). ICC values for examiners measuring mesio-distal axial wall convergence angles using the TBM were 0.902 (95% confidence interval: 0.691 < ICC < 0.981) for examiner 1 and 0.923 (95% confidence interval: 0.750 < ICC < 0.985) for examiner 2. For mesio-distal axial wall convergence angles using the SVBM, ICC was 0.925 (95% confidence interval: 0.755 < ICC < 0.986) for examiner 1 and 0.924 (95% confidence interval: 0.751 < ICC < 0.985) for examiner 2. For bucco-palatal axial wall convergence angles using the TBM, ICCs were 0.880 (95% confidence interval: 0.633 < ICC < 0.976) for examiner 1 and 0.885 (95% confidence interval: 0.645 < ICC < 0.977) for examiner 2. For bucco-palatal axial wall convergence angles using the SVBM, ICCs were 0.882 (95% confidence interval: 0.639 < ICC < 0.978) for examiner 1, and 0.887 (95% confidence interval: 0.651 < ICC < 0.978) for examiner 2. Reliability was higher than 0.8 in all cases. For the assessment of inter-examiner reliabilities, the ICC analysis also showed that reliability was higher than 0.8 in all cases (Table 3).
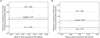
Bland-Altman plots were used to determine differences in graphs between TBMs and SVBMs versus the mean of results for the two methods (Fig. 4). For mesio-distal axial wall convergence angles, the average difference between the tracing-based and stereovision-based measurements was 2.2° and the mean difference ± 2 standard deviations was -12.0° - +16.5°. For bucco-palatal axial wall convergence angles, the average difference between values from the tracing-based and stereovision-based measurements was 6.1° and the mean difference ± 2 standard deviations was -1.8° - +14.1°. A paired t-test was used to determine if differences between the tracing-based and the stereovision-based measurements for artificial abutments were significant. For mesio-distal axial wall convergence angles of artificial abutments, the average difference between the tracing-based and the stereovision-based measurements was 2.2° with standard deviation 7.1° and this difference between the two measurements was significant (P=.048). For bucco-palatal axial wall convergence angles of artificial abutments, the average difference between the tracing-based and stereovision-based measurements was significant at -6.0° with standard deviation 4.0° (P=.000).
A paired t-test was used to determine the significance of differences between bucco-palatal and mesio-distal convergence angle measurements of artificial abutments. The TBM to measure mesio-distal axial wall convergence angles of artificial abutments gave an average difference between mesio-distal and the bucco-palatal axial wall convergence angles of 2.9° with standard deviation 7.1°. The difference between the mesio-distal and the bucco-palatal axial wall convergence angle measurements was significant (P=.010). However, the SVBM gave mesio-distal axial wall convergence angles with an average difference between the mesiodistal and the bucco-palatal axial wall convergence angles of -1.0° with standard deviation 8.1°, which was not a significant difference (P=.441).
The TBM and the SVBM were analyzed for ability to determine true angle values. Paired t-tests compared measured angles with true angle values. For bucco-palatal axial wall convergence angles of wax abutment models, the mean difference between tracing-based measurements and true values was 4.9° with standard deviation 3.3°. The difference between the tracing-based measurements and true values was significant (P=.000). However, for bucco-palatal axial wall convergence angles of wax abutment models, the average difference between stereovision-based measurements and true values was 0.1° with standard deviation was 2.1°, and differences between stereovision-based measurements and true values were not significant (P=.981).
DISCUSSION
Axial wall convergence angles generally have a wide range because dentists prepare teeth in multiple planes and the dental hand-piece and cutting tools may also introduce variation. Therefore, three-dimensional shape information is needed to indicate the axial wall convergence angle. TBMs use the 3D contours of the wall orthogonal to a 2D plane, resulting in a loss of 3D information.
Our analysis determined inter-examiner and intra-examiner reliability of tracing-based and stereovision-based measurements, giving ICC values between 0.8 and 1.0. Therefore, both methods could be categorized as perfect agreement.30 The two methods were assumed to be reliable since one examiner performing multiple measurements could obtain similar results and different users acquired comparable measurement values. In this study, the cervical one-third of an abutment was measured and measuring criteria were defined according to a study by Kaufman.2
We determined which measurement method acquired angle information that was closest to actual values. For this reason, a wax abutment tooth model with a known tilt angle was fabricated for determining method validity. The TBM showed a significant difference between the actual inclination angle and the measured angle. No significant difference was found between the actual inclination angle and the angle value measured by the SVBM. Therefore, based on the results from this study, a method based on stereovision might provide inclination angles that are more accurate than angles obtained using a TBM.
The slope of an abutment tooth does not generally have a consistent inclination angle across the entire slope. A single tooth slope can have a wide range of tilt angles. Three-dimensional shape information of the slope is required to review inclinations with various values, depending on the site and to apply this information, conversion into numerical data from 3D visual information is required. The mean value of angular information at all points on the slope can be used as a representative value indicating the tilt angle of the slope. Measured values using a conventional TBM do not give accurate representative values. In the TBM, the slope of a 3D tooth shape is orthogonally projected onto a 2D plane. This process loses information about the 3D slope from the projected configuration.
To overcome these limitations, points constituting the 3D surface of the slope must be acquired as coordinated information. The inclination angle at all points on the slope and the average of the convergence angle can be calculated. As technology develops, this method, which a laser scanner currently uses, will improve through active 3D modeling. However, measuring moving objects is difficult, especially when used in open space. In this study, a system was developed using the technology of stereo-based passive 3D modeling. This system has advantages for measuring dynamic objects and can be used in open spaces such as the oral cavity. The SVBM was considered to be a useful tool for tooth preparation in dental clinics, which could be clinically applied to check quickly and to maintain the convergence angle adequately during the abutment preparation procedure.
CONCLUSION
A dental image processing system using a 3D camera and stereovision technology was developed. The system was used to measure axial wall convergence angles of prepared teeth. Both intra-examiner and inter-examiner reliabilities were excellent for the SVBM and the traditional TBM. The stereovision-based measurement might overcome errors that result from the limitations of 2D methods that measure convergence angles from only a single cross-sectional image of a solid body. The results of this study indicated that the SVBM might provide more accurate values than a TBM. This study also provided an example of how 3D computer science can be applied to clinical dentistry.


 XML Download