

 PDF
PDF ePub
ePub Citation
 Print
Print


INTRODUCTION
Issues pertaining to facial esthetics are common chief complaints of patients with malocclusion. These patients often seek improved facial esthetics through orthodontic treatment and appreciate an improvement in not only their sagittal but also their frontal facial profiles. However, other patients are concerned about their face becoming narrower after extraction treatment.
Numerous studies have explained the effects of orthodontic treatment on the facial profile and compared the differences between extraction and nonextraction treatments. However, most studies have focused on changes in the sagittal profile,12345 and only a few have documented frontal facial changes,67 even though the frontal profile is the most commonly visible profile of an individual.
Bishara et al.6 studied frontal facial widths by using two-dimensional photographs; however, the information provided by these photographs was limited, with only the zygion-zygion (zygion: the most lateral point of each zygomatic arch and is identified by trial measurement, not by anatomical relationship. It is identical to the bony zygion of the malar bones) and gonion-gonion distances measured as the upper facial and lower facial widths, respectively. Three-dimensional (3D) morphological characteristics of buccal facial parameters, such as the depth or curvature, have to be measured for the overall assessment of the frontal face. Advancements in 3D facial imaging devices and techniques, particularly stereophotogrammetry, laser scanning, and structured light scanning, have facilitated faster, noninvasive, 3D, and accurate measurements of facial changes.89
Using a 3D method, Moss et al.7 studied overall facial changes after extraction and nonextraction orthodontic treatments and found a decrease in facial width in both groups. However, their subjects were growing patients, and it was difficult to distinguish the treatment effects from the growth effects, considering that the cheeks flatten with natural growth in untreated children.10 Moreover, in both the above-mentioned studies, changes in facial width or cheeks were generally described after overall shell-to-shell deviation analysis, wherein the facial buccal region was not clearly defined. Clear definition of the buccal region and its differentiation from the other facial regions is necessary for elucidating the possible causes of frontal facial changes, such as changes in the underlying dentoalveolar structures.
This study aimed to examine buccal facial depth (BFD) changes after extraction and nonextraction orthodontic treatments in post-adolescent and adult female patients by using 3D facial scans, and to explore possible factors that influenced these changes. The null hypothesis was that there was no change in BFD after extraction and nonextraction orthodontic treatments in post-adolescent and adult female patients.
MATERIALS AND METHODS
Subjects
The subjects were recruited among consecutive patients during their initial visits to the Department of Orthodontics, Peking University School and Hospital of Stomatology. Patients requiring extraction of the four first premolars (PM1) and orthodontic mini-implants for maximum anchorage control, as necessitated by lip protrusion, were enrolled as the extraction group. Patients requiring nonextraction treatment for acceptable profiles were enrolled as the nonextraction group. All patients had mild crowding or spacing (below 4 mm), and the skeletal patterns were Class I or Class II (A point-Nasion-B point [ANB] values above 1°). Other inclusion criteria were as follows: female patients aged 16 to 30 years, absence of posterior crossbite, no requirement for third molar extraction, no previous facial esthetic operation, no scars around the face, and overall good health.
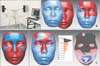
An initial sample of 12 patients in the extraction group and 10 patients in the nonextraction group was recruited after obtaining written informed consent. The study was approved by the Institutional Review Board of Peking University School and Hospital of Stomatology (IRB No. 201631134). Each patient had complete pretreatment (T1) and posttreatment (T2) records, including cephalometric radiographs, plaster models, body mass index (BMI, body mass [kg] divided by the square of the body height [m]), and 3D facial scans acquired using a 3D structured light scanning system (3D CaMega; Boweihengxin Technology Inc., Beijing, China; accuracy, ± 0.05 mm) (Figure 1A). Patients were encouraged to relax during facial scanning. The plaster models were scanned to obtain digital models by using a laser scanner (3Shape R700; 3Shape A/S, Copenhagen, Denmark; accuracy, ± 0.02 mm).
All patients were treated using the same appliance (Roth prescription, 0.022 × 0.028-inch bracket slot; Shinye, Hangzhou, China). Orthodontic mini-implants (1.6 × 11 mm; CB, Ningbo, China) in the extraction group were inserted between the second premolar (PM2) and first molar (M1) or between the M1 and second molar (M2).
One patient from the nonextraction group was excluded because of a BMI change of > 1.5. Overall, 12 patients (age range, 19–28 years) were included in the extraction group and nine (age range, 16–25 years) in the nonextraction group.
Facial and cast evaluations were conducted using reverse engineering software Rapidform 2006 (Inus Technology, Seoul, Korea), and major cephalometric variables were measured using lateral cephalograms. All measurements were performed using a computer (Intel Core i7-4790 CPU, x64, 8GB RAM, Windows 7 system) and a monitor (LS24D360; Samsung, Suwon, Korea) with a resolution of 1,680 × 1,050 at 59 Hz.
Facial evaluation
Set-up of reference planes
T1 and T2 facial scans were initially registered using five landmarks (bilateral outer and inner canthi, and pronasale) (Figure 1B), followed by regional registration based on the frontal-nasal-zygomatic region (forehead, dorsum of the nose, and upper zygoma) (Figure 1C). After superimposition, the reference planes were set up on the T1 scan by using the method described by Alqattan et al.11 and Nkenke et al.12 The sagittal reference plane was determined as the symmetry plane for the original-mirror face structure. The cylinder that fitted all data points on the original-mirror face structure was used to determine the transverse reference plane. The coronal reference plane was perpendicular to the previous two planes and passed through the midpoint of the line connecting the bilateral outer canthi (Figure 2A).
Set-up of measuring planes
The coronal reference plane was also defined as the coronal measuring plane_Co1, and the coronal measuring plane_Co2 was parallel and 10 mm posterior to plane_Co1 (Figure 2B). Four anthropometric landmarks (subnasale [Sn], labiale superius [Ls], labiale inferius [Li], and the soft tissue B-point [B′]) were manually placed on the midsagittal profile of the T1 facial scan (Figure 2C). Six planes parallel to the transverse reference plane and passing through the Sn, midpoint of the Sn and Ls (Sn-Ls), Ls, midpoint of the Ls and Li (Ls-Li), Li, and B′ were defined as the transverse measuring plane_Sn, Sn-Ls, Ls, Ls-Li, Li, and B′, respectively (Figure 2C and 2D).
Definition of the buccal region
The bilateral alar base points and oral angle points were marked on the T1 scan. The plane perpendicular to the coronal plane and passing through the unilateral alar base point and oral angle point was defined as plane_AO, while the plane parallel to the sagittal plane and passing through the unilateral oral angle point was defined as plane_O. Then, the buccal region of the 3D face was defined as follows. The planes parallel and 10 mm posterior to plane_AO and plane_O were set as the anterior border; the transverse measuring plane_Sn and plane_B′ were set as the upper and lower borders, respectively; and the coronal measuring plane_Co2 was set as the posterior border (Figure 2E–2G).
Measurements
Three variables were measured for facial evaluation.
Pretreatment facial width: Each coronal measuring plane intersected with every transverse measuring plane, resulting in two points on the facial profile, and the point-to-point distance was defined as the facial width (Figure 2I and 2J).
Changes in BFD in the buccal region: BFD was defined as the distance from the buccal facial surface inwards to the sagittal plane. The changes in BFD in the buccal region were measured as the mean value of the shell-to-shell deviation (signed) of the buccal region between T1 and T2. Bilateral changes were averaged (Figure 2H).
Changes in BFD in the measuring planes: The buccal region was bilaterally sliced by the transverse or coronal measuring plane, generating a transverse or coronal curve on each side of the face. The mean value of the curve-to-curve deviation of each generated curve between T1 and T2 was then calculated using MATLAB 10.0 (MathWorks Inc., Natick, MA, USA) with a self-compiled program. The program was compiled by the Center for Information Science, School of Electronics Engineering and Computer Science, Peking University. It output the mean value of curve-to-curve deviation as the average of the signed distances from each point on the T1 curve to the nearest point on the T2 curve. Bilateral changes were averaged (Figure 2K–2M).
Cast evaluation
Set-up of the transverse reference plane
The T1 and T2 maxillary digital casts were registered on the palatal stable region13 (Figure 3A). The average occlusal plane that fitted the cusps of M1, PM2, and PM1 (canines if the PM1s had been extracted) on both the T1 and T2 casts was selected as the mutual transverse reference plane (Figure 3B).
Definition of dental arch curve
The buccal cusps of the molars and premolars, cusps of the canines, and the mesial and distal incisal points on the incisors were digitized and projected onto the transverse reference plane, following which the dental arch curves for the T1 and T2 casts were generated by successively connecting the projected landmarks using the interpolation method (Figure 3C).
Definition of alveolar arch curve
The segment above the oral vestibular sulcus on the maxillary digital casts was cut off, and the left segment of the alveolar bone and dentition was projected as a whole onto the transverse reference plane by using the silhouette method, which generated an external contour curve. This reflected the outermost silhouette of the entire alveolar bone that supported the corresponding part of the face for the posterior tooth segment; therefore, it could also be regarded as the alveolar arch curve (Figure 3C).
Measurements
The transverse line connecting the bilateral dental landmarks intersected the dental arch curve and alveolar arch curve, and generated two points on each curve; the point-to-point distance was defined as the dental arch width or alveolar arch width, respectively. The pretreatment value and the changes in dental and alveolar arch widths were measured at two levels: M1 and PM2 on the T1 cast (Figure 3C).
Pretreatment age, overall treatment duration, BMI change, major cephalometric variables, pretreatment facial and dentoalveolar arch widths, and changes in BFD and dentoalveolar arch width were compared between the extraction and nonextraction groups.
Statistical analysis
Data were analyzed using IBM SPSS Statistics for Windows (version 19.0; IBM Co., Armonk, NY, USA). The measurements of BFD changes were repeated twice by a single operator. Intraclass correlation coefficients (ICCs) were determined to assess the reliability of measurements: the ICCs were greater than 0.995. Descriptive statistics including the median and interquartile range were calculated for each group. Within the extraction and nonextraction groups, the Wilcoxon signed rank test was used to evaluate differences between T1 and T2. The Mann-Whitney test was used to evaluate differences between groups. Finally, the Spearman rank correlation coefficient was calculated to evaluate the correlation between BFD changes and treatment duration, dentoalveolar arch width changes, or pretreatment facial width. A p-value of < 0.05 was considered statistically significant.
RESULTS
Age, treatment duration, BMI change, and cephalometric analysis
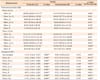
As shown in Table 1, the pretreatment age and BMI change showed no statistically significant differences between the extraction and nonextraction groups. However, the treatment duration in the extraction group was significantly longer than that in the nonextraction group.
Before treatment, the extraction group had a larger ANB angle, more proclined maxillary incisor, and more protruded lips. After treatment, the extraction group had obvious maxillary and mandibular incisor retractions, while the nonextraction group had a slight incisor protrusion. The Frankfort horizontal-mandibular plane (FH-MP) angle showed no statistically significant difference between the groups before treatment, and showed no change in both groups after treatment.
Pretreatment facial width and changes in BFD
Table 2 shows that the patients in the nonextraction group had significantly greater facial width than did those in the extraction group at all levels except plane_Sn-Ls and Ls before treatment.
BFD showed a statistically significant decrease in the extraction group, but no significant changes were found in the nonextraction group. The power for the negative findings in the nonextraction group was low considering the small sample size used in this study; however, the changes in BFD were also small.
In the extraction group, BFD decreased by 1.45 mm in the buccal region. It decreased by almost the same amount of 1.7 mm in the two coronal measuring planes. However, among the six transverse measuring planes, the maximum change in BFD was 1.73 mm in plane_Ls-Li, and the amount of change decreased gradually upwards towards plane_Sn and downwards towards plane_B′.
Pretreatment value and changes in dentoalveolar arch widths
No statistically significant differences were found in pretreatment dentoalveolar arch widths between the groups (Table 3). After treatment, dentoalveolar arch widths at the M1 and PM2 levels decreased in the extraction group, and the changes in dental arch width (2.5 and 2.6 mm, respectively) were greater than those in alveolar arch width (0.6 and 0.6 mm, respectively). However, they showed no significant changes at the M1 level and increased at the PM2 level in the nonextraction group.
Correlations between BFD changes and treatment duration, dentoalveolar arch width changes, or pretreatment facial width
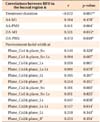
Correlations between BFD changes in the buccal region and treatment duration and dental arch width changes at the M1 and PM2 levels were moderate, with the correlation coefficients being −0.672, 0.521, and 0.473, respectively (Table 4). No correlation was found between BFD changes and alveolar arch width change or pretreatment facial width.
DISCUSSION
A previous cephalometric study comparing the outcomes of patients undergoing “clear-cut” extraction and nonextraction verified that premolar extraction reduces soft-tissue convexity by 2 to 3 mm, whereas nonextraction therapy has little effect.1 The current study further investigated the effects on BFD by using 3D facial scans. The enrolled female patients were between 16 and 28 years old (all patients, except for three post-adolescents in the nonextraction group, were adults); therefore, the influence of normal growth on BFD changes could be avoided as much as possible. In addition, no significant difference was observed in pretreatment age between the groups, which suggested similar levels of soft-tissue muscular stress and its adaptation to structural changes before treatment.
BMI, which reflects body adiposity, may be a factor that influences facial changes.14 Therefore, one patient with an obvious BMI change (> 1.5 kg/m2) after treatment was excluded from the study; the other enrolled patients showed no significant difference in BMI change. The FH-MP angle was also examined, as the rotation of the mandible may change the tension on facial soft tissue, thereby influencing BFD. However, no difference in FH-MP change was found between the groups.
While the forehead remains relatively stable after routine orthognathic surgery or natural growth beyond 9 years of age, regional registration of the forehead has been commonly adopted in previous studies to analyze 3D facial changes after orthognathic surgery151617 and orthodontic treatment in growing patients.7 Facial changes in non-growing or minimal-growing patients after orthodontic treatment are primarily concentrated in the maxillomandibular region. Therefore, the registration region used in this study was expanded from the forehead to the frontal-nasal-zygomatic region.
BFD in the buccal region decreased by 1.45 mm in the extraction group, but showed no significant change in the nonextraction group. Using the same shell-to-shell deviation method, Moss et al.7 and Ismail et al.18 found decreases of 2 mm and 2 to 3 mm, respectively, in facial width (corresponding to BFD in our study) in the nonextraction and extraction groups 9 months into the treatment when space closure would have commenced, and decreases of 3 to 4 mm at the end of treatment after a treatment duration of almost 2 years for both groups. These values were greater than those obtained in our study, probably because of considerable facial development in the growing subjects10 aged 11 to 19 years old in Moss's study. In addition, changes in facial width were similar between the groups in Moss's study, but differed between the groups in our study. The different treatment durations between groups in the current study but almost the same treatment durations between groups in Moss's study may explain this difference.
Previous studies have shown that occlusal bite force decreases during fixed orthodontic treatment.1920 This observation indicates that possible atrophy of the underlying masticatory muscles and adjacent tissues caused by decreased chewing function during orthodontic treatment might be a cause of facial width decrease.21 Moreover, the effects of aging on facial changes may be observed during orthodontic treatment. Atrophy and displacement of the malar fat pad and less prominence of the anterior cheek mass are considered to occur with age, resulting in cheek concavity and malar prominence.222324 The correlation analysis also showed a moderate correlation between BFD changes in the buccal region and treatment duration. Therefore, the approximately doubled treatment duration in the extraction group than in the nonextraction group may be related to different BFD changes.
In our study, we found that patients in the extraction group generally had a narrower face than did those in the nonextraction group before treatment, whereas dentoalveolar arch widths were generally identical between the groups. This indicated the thickness of the facial soft tissue was lesser in the extraction group than in the nonextraction group. Theoretically, there is a great possibility that the initial soft-tissue condition might affect BFD changes, and it may be related to muscle characteristics, fat layer thickness, etc. To examine the potential effect, correlation analysis was performed between BFD changes and pretreatment facial width. However, no statistically significant correlation was found. Perhaps, the effect of pretreatment facial width on BFD changes was covered by other influencing factors, which need to be further explored by modifying the study design and sample selection in future studies.
Several studies have shown that lip convexity was influenced, to some extent, by retraction of the anterior teeth after extraction treatment.12526 This naturally leads us to reason that if extraction treatment causes inward movements of the posterior teeth, the buccal soft tissue may also move, resulting in a narrower face. This study demarcated the investigated facial buccal region to 10 mm posterior to the oral angle and nasolabial fold; therefore, confusion between buccal facial changes and lip changes was avoided. On the basis of anatomical structures, this buccal region generally corresponds to the position of PM2 and M1, and the region from plane_Sn to plane_Ls-Li was primarily supported by the maxillary alveolar bone and dentition. After treatment, dentoalveolar arch widths decreased in the extraction group; this was in accordance with the findings of other studies.2728 Coincidentally, the decrease in dentoalveolar arch width was almost identical at the PM2 and M1 levels, and the decrease in BFD was almost identical at plane_Co1 and plane_Co2. In addition, the decrease in dental arch width was greater than that in alveolar arch width, and the decrease in BFD showed a gradual decrease from plane_Ls-Li to plane_Sn. Overall, we could observe consistency in the decreases in BFD and dentoalveolar arch width both vertically and anteroposteriorly. Therefore, it could be hypothesized that extraction treatment narrows the arch and, consequently, the face to some extent. A moderate correlation was also observed between BFD changes in the buccal region and dental arch width changes; however, alveolar arch width changes may be too small to induce obvious BFD changes in the entire buccal region.
Nevertheless, in the nonextraction group, dentoalveolar arch widths at the PM2 level increased, whereas no significant change was found in BFD. It remains unknown whether the possible increase in BFD induced by an increase in dentoalveolar arch width counteracted the possible decrease in BFD induced by muscle atrophy and aging effect over the average 16-month treatment duration. The influence of arch expansion on BFD requires further investigation.
A limitation of the present study was the small and heterogenous sample. The results could not be simply extended to other patients with different malocclusions or different treatments. A larger sample size would be more powerful in verifying the effects of treatment duration and the change in dentoalveolar arch width on BFD. Besides, the effects of pretreatment facial soft tissue condition, skeletal pattern and sex on BFD could be further investigated.
CONCLUSION
This preliminary study indicated that BFD decreases in adult female patients after extraction orthodontic treatment, and that long treatment durations and the constriction of dentoalveolar arch width may be potential influencing factors. No significant change in BFD is observed after nonextraction treatment. Further studies with large sample sizes will help verify the results of the current study.


 XML Download