

 PDF
PDF ePub
ePub Citation
 Print
Print


INTRODUCTION
The prevalence of type 2 diabetes, ranked as one of the top five causes of death worldwide, has been gradually increasing, and particularly rapidly in Asia[1]. In Korea, type 2 diabetes with complications was reported to be one of the top five causes of death in 2011[2]. Diabetes is a progressive and chronic disease, and a complete recovery from it is unlikely once it has developed. Furthermore, it can cause acute and chronic complications that without a change in lifestyle and constant management can be life-threatening to the patient. It has been reported that 60.0% of Korean diabetes patients are not able to maintain their serum glycosylated hemoglobin (HbA1c) level, which is used as a marker of blood sugar management, within 7.0% of the norm. Of these, 41.0% were smokers and 44.5% ingested alcohol once a week. Thus, among the Korean patients reviewed in that study, the management of diabetes was poor[3].
The risk factors of diabetes have been well established from the many previous studies on the disease for decades with gender and age being the most repeatedly confirmed factors[4,5]. There is some evidence that the prevalence of diabetes also depends on area of residence[1], and socioeconomic factors such as income, education level, marital status, and employment status[6,7]. With respect to lifestyle risk factors for type 2 diabetes, exercise and physical activity are known to be protective factors[8], while stress was found to be a risk factor specific to women[9]. There is controversial evidence regarding smoking[10] and drinking[11]. The physiologic risk factors of diabetes are reported to be hypertension, serum triglyceride, high density lipoprotein (HDL) cholesterol[12], and body mass index (BMI)[10,11,12].
However, risk factors determined from cross-sectional studies have practical limitations with respect to explaining the necessity for steady control of diabetes, as changes in social structure and lifestyle can affect its prevalence[1]. Thus, rather than simply identifying risk factors from a cross-sectional study, it is necessary to examine the pattern of the prevalence of diabetes over time. Such patterns of the prevalence of diabetes and trends of risk factors over certain periods of time have been studied using national data, but mostly only in USA[13,14] and Europe[6,15,16]. Moreover, most of these studies simply compared the prevalence of diabetes at two time points (e.g., between the start and end time points of the study period) or focused only on particular risk factors, such as socioeconomic factors. Few studies have investigated the trend of the prevalence of diabetes in Asia including Korea, where it is increasing rapidly with simultaneous dramatic socioeconomic development[3]. A recent study that compared the prevalence of diabetes between Caucasians and Asians aged over 18 years between 1997 and 2008 using National Institutes of Health Standards (NIHS) data showed that the prevalence of diabetes increased more among Asians than among Caucasians, and was higher among Asian Indians compared to the other populations studied[13]. In only two studies was the trend of crude, age-standardized, or BMI-standardized prevalence of diabetes in Korea investigated[4,5]. However, in neither of these studies was a trend analysis relative to the known risk factors of diabetes performed. This lack indicates that a trend analysis of the prevalence of diabetes in Korea in terms of various risk factors is important for understanding trends over time and for necessary health interventions to be taken.
Using three sets of national data obtained in 2001, 2005, and 2009, the objectives of this study were (i) to determine the pattern of the prevalence of diabetes over a 10-year period, and (ii) to determine the trend in the prevalence of diabetes according to risk factors selected from existing research and categorized by socioeconomic, lifestyle, and physiologic factors.
METHODS
1. Study design
This study was a secondary analysis design using national data from a repeated cross-sectional survey study.
2. Setting and sample
The Korean National Health and Nutrition Examination Survey (KNHANES) data collected by the Ministry of Health and Welfare (MHW) and the Korea Centers for Disease Control and Prevention (KCDC) from 2001 to 2009 were used in this study. The KNHANES is a repeated cross-sectional study for which all households in Korea are targeted and samples are selected with a stratified multistage sampling design every survey year. The data included a random sample of 37,878 in 2001, 34,145 in 2005, and 24,871 in 2009. The study population comprised adults older than 30 years, which is the age at which it is believed the prevalence of diabetes begins to increase. Those who were under the age of 30, didn't have at least 8-hours of fasting or without information on risk factors were excluded. The final size of the studied population was 3,407 in 2001, 4,216 in 2005, and 5,630 in 2009.
As the analyzed data were publicly available, this study did not need the approval of the institutional review board. Study permission to use the data was obtained from the KCDC before this study was conducted.
3. Measurement
According to the revised criteria for diabetes diagnosis of the American Diabetes Association published in 1997 and 2003, participants were classified as diabetes patients when they answered in an interview that they had suffered from diabetes within the year preceding the interview, they had been diagnosed with diabetes by doctors, they were taking an oral hypoglycemic agent or insulin therapy, or their 8-hour fasting glucose level exceeded 126 mg/dL.
The survey to ascertain socioeconomic and lifestyle data was conducted by self-report and interview methods. The anthropometric height and weight data, and laboratory data were measured or observed at a hospital or institution selected by MHW and KCDC. Additional details about sampling design and methods can be found elsewhere[17].
4. Data collection
The risk factors of diabetes that were considered in this study were selected based on previous research. The socioeconomic factors included gender, age, area of residence (urban/rural), monthly income (<$1000, $1000~$2,999, ≥$3000), education level (elementary school/middle school/high school/university), marital status (married/unmarried), and employment status (yes/no). Age obtained from interview and self-reported data were categorized into 10-year periods. Marital status was classified as married or unmarried, with unmarried being defined as single, separated, divorced, separated by death, or other. The participant's employment status was determined according to economic activity; housewives and soldiers were categorized into the unemployed category. Monthly income was determined using the minimum cost of living for a family of four for the year of the survey.
The lifestyle factors included current smoking (yes/no), current alcohol consumption (yes/no), exercise (yes/no), and stress (high/low). Exercise was affirmed if the participant regularly undertook exercise for more than 30 minutes weekly.
The physiologic factors, as assessed by physical examination and laboratory testing, included hypertension (yes/no), BMI (<18.5 kg/m2, 18.5~24.9 kg/m2, ≥25 kg/m2) and serum total cholesterol (≥200 mg/dL, <200 mg/dL), triglyceride (≥135 mg/dL, <135 mg/dL), and HDL cholesterol (≥45 mg/dL, <45 mg/dL). Hypertension was determined if the participant had a systolic blood pressure ≥140 mmHg, diastolic blood pressure ≥90 mmHg or was currently taking medications. Each participant's BMI was ascertained by physical examination to obtain their height and weight, and categorized into three levels according to NIHS.
5. Data analysis
The crude prevalence of diabetes for each gender was calculated at each age group. The age-adjusted prevalence of diabetes for gender and associated 95% confidence intervals were calculated via a binomial model according to each risk factor by taking into account sample weights of KNHANES.
Trend analysis employed in this paper is often used to access a pattern of behavior or an event of interest in a repeated measurement. In a longitudinal data, regression analysis or time series analysis can be used to find the underlying trend. However, a repeated cross-sectional data requires a different approach to account for its structural characteristics. Instead of odds ratios, which represent comparisons of personal characteristics, the prevalence difference (PD) and prevalence ratio (PR) were used by considering the repeated cross -sectional feature of the KNHANES[18]. PD compares the absolute size of the prevalence by evaluating the difference between the prevalence at the level of each risk factor, and PR provides information regarding the proportion of adults with the disease relative to adults with each risk factor. For socioeconomic factors, including education level and monthly income, the slope index of inequality (SII) and the relative index of inequality (RII) were obtained[19]. SII and RII are calculated using the prevalence from lower level to higher level of a risk factor by order. SII reveals the absolute difference in prevalence between those both end levels of a risk factor and the RII shows the proportion of prevalence between both end levels of a risk factor. A binomial regression model was used to estimate the PD and SII and the linear trend test of PD and SII was conducted by obtaining the p value for an interaction between the independent variable and the variable that represents the survey year[20]. A similar procedure using a log-binomial regression was used to estimate the PR and RII and the linear trend test of PR and RII. All analyses were conducted using SAS Version 9.2 statistical software.
RESULTS
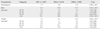
The crude prevalence increased between 2001 and 2009 particularly for both genders (Z= -4.94, p<.001); the prevalence of diabetes for men was higher than that for women throughout the 10-year period. As for age, the prevalence became higher for women aged over 50 years, while it became higher for men aged over 40 years. Also, it was very high for both genders aged over 60 years, while men aged over 60 years showed higher prevalence than women aged over 60 years since 2005. The crude prevalence of people aged over 60 years was statistically significantly increasing for men (Z= -2.93, p<.001) and women (Z= -1.44, p=.020) (Table 1).
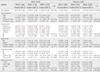
Among socioeconomic factors, the increasing trend in PD of the age-adjusted prevalence of diabetes for employment status among men was significant (χ2 =5.11, p=.020). Specifically, the prevalence of diabetes among unemployed men increased significantly over time, whereas that of employed men exhibited a decreasing trend. The prevalence of diabetes among unemployed men was lower than that among employed men in 2001, but the former has been higher since 2005. For women, there was no significant change in the PD and PR according to employment status (Table 2).
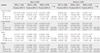
Among lifestyle factors, both PD and PR of the prevalence of diabetes appeared to show an increasing trend for stress among women over time (χ2 =5.56, p=.016 and χ2 =4.62, p=.035 respectively). Moreover, the prevalence of diabetes of women with stress was dependent upon the degree of stress, such that it increased significantly over time among women with a high level of stress, but fluctuated among women with a low level of stress (Table 3).
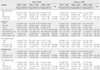
Among physiologic factors, a statistically significant increasing PD or PR over time was found for the following risk factors; the PD and PR of the prevalence of diabetes for hypertension for women (χ2= 6.45, p=.009 and χ2 =5.05, p=.021 respectively) and the PD for serum triglyceride level for men (χ2=9.18, p=.003) and the PD and PR for serum triglyceride level for women (χ2= 6.47, p=.008 and χ2= 6.36, p=.013 respectively). Specifically, the prevalence of diabetes for women with hypertension increased over time, while for women without hypertension it fluctuated. There was a significant increase in the prevalence of diabetes over time among both genders with serum triglyceride level of ≥135 mg/dL, but not among those with serum triglyceride level <135 mg/dL (Table 4).
Discussion
The results of this study showed that the crude prevalence of diabetes among the ≥60 years age group in Korea, which increased dramatically over the 10-year study period, was the highest of all of the age groups. This trend may reflect the rapid increase of the elderly population in Korea for the past 10 years from 7.3% in 2000 to 11.0% in 2010[21]. Further this kind of change is not unexpected in countries in Asia, which are experiencing huge economic growth and have longer average life expectancy[22]. In 2002 the prevalence of diabetes differed according to race: Western European, 2.0~8.0%; Chinese, 9.0~13.0%; and Asian Indian, 12.0~22.0%[23].
The results also showed an increasing pattern of age-adjusted prevalence of diabetes since 2005 among unemployed men but not among employed men. This may be basically attributable to the very high unemployment rate among men aged over 65 years, at 66.6%, which may impact on the prevalence of diabetes among unemployed men in Korea[24].
Stress was found to be a significant lifestyle factor only for women. There was an increase in the age-adjusted prevalence of diabetes among highly stressed Korean women over the 10-year study period, but not among those with low level of stress. This can be explained by the finding that stress is related to the prevalence of diabetes for women who lack emotional support[9]. Increasing trend in prevalence difference between the two groups is a reason that more interest should be taken concerning the relationship of stress and diabetes among women.
Among the physiologic factors, there was a dramatic increase in the age-adjusted prevalence of diabetes over time among women with hypertension, whereas a decrease in the prevalence among women without hypertension. This finding concurs with recent studies which reported that blood pressure control is associated with the prevalence of diabetes[5,12,25], especially for women[26]. Also, the prevalence of diabetes for both men and women with serum triglyceride levels of≥ 135 mg/dL appears to have increased more rapidly than for men and women with a triglyceride level of <135 mg/dL. The influence of serum triglyceride on the risk of developing diabetes among Koreans is a relatively recent finding[27]. Triglyceride has become an important risk factor for diabetes as a result of the recent economic development in Korea, which have led to substantial changes in Korean lifestyles, such as reductions in the amount of exercise undertaken and in the amount of daily physical activity, as well as the westernization of diet toward high-calorie and high-fat products. These findings concur with a report of the prevalence of diabetes in Korea increasing as a result of developments in medical science, increase in the number of older people, and stress caused by a busy life. These changes are all in turn attributable to economic development, irregular diet, a lack of exercise caused by the increased use of cars, and an increase in the number of obese people, which is associated with the westernization of the diet[28].
Additionally, BMI was found to be an insignificant factor for the trend in prevalence of diabetes in this study; although the highest prevalence of diabetes was found at a BMI of ≥25.0 kg/m2, the prevalence for adults with a BMI of 18.5~24.9 kg/m2 was less than that of those with a BMI of <18.5 kg/m2. This finding concurs with a report that East Asians tend to have a higher prevalence of diabetes at a lower BMI compared to Americans and Europeans[29]. Other studies have found similar higher prevalence rates of diabetes at lower BMIs among Asians[30]. Also the prevalence of diabetes in adults with a BMI of ≥25.0 kg/m2 increased between 2001 and 2009, whereas the prevalence fluctuated for adults with a BMI of <18.5 kg/m2. These results suggest that BMI should still be regarded as a potential risk factor for the prevalence of diabetes.
These are some limitations in this study. KNHANES data which are repeated cross-sectional data was used for the study. Each survey at the three time points used a different population as a representative sample, so it is not possible to make inferences about cause-and-effect relationships between risk factors and the prevalence of diabetes over time. In addition, the survey institutions and test methods for physiologic factors were different at the three time points at which data were collected; this could have led to a bias. Such a bias could be reduced by collecting data using consistent testing methods at a single institution and by studying the same representative sample longitudinally. Furthermore, due to the large amounts of missing data and the self-reporting design for data collection (which has limitations due to the accuracy of the interviewees' memories), information on diet was not included, despite its doubtless relevance to type 2 diabetes.
Last but not least, this type of study has rarely been performed in Asia compared to the USA and Western Europe. To the best of our knowledge, this is the first study to provide a comprehensive trend analysis of the prevalence of diabetes of Koreans at three points in time spanning almost 10 years relative to certain risk factors, and including not only socioeconomic, but also lifestyle and physiologic factors.
CONCLUSION
In this study the prevalence of diabetes as increasing rapidly over time among adults aged over 60 years was identified. The trend analysis of the age-adjusted prevalence of diabetes revealed a significantly increasing prevalence over the 10-year study period among unemployed men, women with higher levels of stress, women with hypertension and adults with serum triglyceride levels of ≥135 mg/dL, compared to the respective controls. BMI was found be insignificant, but still should be regarded as a potential risk factor.
Considering the rapid economic development and associated lifestyle changes in Korea, action should be taken to control the prevalence of diabetes by both preventing and consistently monitoring these identified risk factors using a public-health approach. The result of this study can be a reference to develop long-term or time-specific strategies to manage the increasing prevalence of diabetes among Koreans or Asians. Health care professional including nurses should have more interest in these findings for the development of management strategies and intervention for diabetes.
 XML Download