

 PDF
PDF ePub
ePub Citation
 Print
Print


INTRODUCTION
Human sleep has both objective and subjective aspects. Objective parameters from polysomnography (PSG) are usually consistent with a patient's subjective perceptions.1 After a good sleep, most people feel refreshed and recuperated, which can help maintain their sleep homeostasis and quality of life. However, some people experience a subjective sleep quality that is worse than their objective sleep quality.2 Individuals who express an extreme overestimation of sleep latency (SL) and an underestimation of total sleep time (TST) are classified as having a paradoxical insomnia,3 and those who express the opposite are classified as reverse sleep-state misperception.45 Of these two groups, the former is well delineated and is accepted as a primary form of insomnia.67 Although many explanations exist for the lack of full recognition of sleep, none are definitive.89 Insomnia is currently the only known factor associated with sleep misperception.8
Obstructive sleep apnea (OSA) is a heterogeneous group of sleep-related breathing disorders with various etiologies.101112 Though OSA is characterized by fragmented sleep, not all affected persons complain of insomnia. 13 A recent study using PSG found that sleep perception was the best in healthy controls, poor in OSA patients, and the worst in insomniacs.13 Another study, which applied the multiple sleep latency test (MSLT) to patients with primary insomnia, demonstrated a negative correlation with sleep perception.14 However, no previous studies have used PSG or the MSLT to investigate this discrepancy in OSA. Most studies have investigated sleep perception in patients with insomnia, but few studies have evaluated sleep-state misperception along with detailed PSG and MSLT parameters in patients with OSA. Thus, we hypothesized that, in OSA, certain clinical or polysomnographic parameters that reflect sleep quality could also be related to sleep perception. This assumption led us to design this study to reveal them and, if possible, to infer a potential underlying mechanism.
METHODS
We recruited patients who visited our sleep clinic for the evaluation of their snoring and/or observed OSA from May 1, 2010 to June 30, 2012. The inclusion criteria were as follows: age ≥20 years, able to answer questions before and after the tests, and willing to provide written informed consent. We excluded those with acute neurological, medical, psychiatric, or surgical diseases, those who refused to stop medications that could potentially affect sleep or cognition, those with irregular sleep schedules, those without OSA in PSG, and those with sleep disorders other than OSA or mild periodic limb movement disorder (PLMD). This study was approved by a local institutional review board at Boramae Hospital. Additionally, we obtained written informed consents from all patients who participated in this study.
All of the patients were asked to maintain a stable sleep schedule without consuming alcohol, caffeine, or sleep-related medication for 2 weeks prior to the study. On the night of PSG they were given a structured questionnaire to collect data on their basic demographic characteristics, past medical history, social history, and sleep-related history including insomnia, as well as applying the Epworth Sleepiness Scale (ESS) and the Stanford Sleepiness Scale (SSS)15 just before PSG. The ESS consisted of eight items, each of which was scored from 0 to 3.16 The SSS presented eight sentences from which the patients chose the best fit to describe themselves; this scale is easy to administer and reflects subjective feeling about alertness and sleepiness.15 We assumed that the preand post-PSG SSS scores and their differences would reflect the improvement of sleepiness after sleep.
Initiation insomnia, maintenance insomnia, and excessive daytime sleepiness (EDS) during the previous week were scored from 0 to 3, with a higher score indicating a greater severity. Sleep quality was scored from 1 to 5, with a score of 5 being the best. An extract of the sleep questionnaires is presented in Supplementary Table 1 (in the online-only Data Supplement). We also evaluated the patients using the Beck Depression Inventory (BDI),17 Beck Anxiety Inventory (BAI),18 and Athens Insomnia Scale (AIS).19 BDI and BAI consist of 21 items, with each scored from 0 to 3, where a score of 3 is the worst, while AIS comprises 8 questions scored in the same way. We also applied the following a one-sentence questionnaire for the qualitative assessment of sleep: 'did you feel refreshed after sleep?'
PSG was performed according to the recommendations of the American Academy of Sleep Medicine, 2007.20 Clocks, watches, and mobile phones that could give the patient time cues were removed from the test room. The criteria for scoring apnea were as follows: 1) a drop in the peak thermal sensor excursion by ≥90% relative to baseline, 2) an event duration of ≥10 sec, and 3) ≥90% of the event duration meeting the amplitude-reduction criterion for apnea. Hypopnea was considered to be present when there was a 4% decrease in oxygen saturation (SaO2) followed a reduction in airflow by 30% for at least 10 sec. Respiratory-effort-related arousal was considered to be present when there was a sequence of breaths lasting at least 10 sec characterized by increasing respiratory effort or flattening of the nasal pressure waveform leading to arousal from sleep, when the sequence of breaths did not meet the criteria for an apnea or hypopnea. On the morning following PSG, the subjective SL, subjective TST, and post-PSG SSS score were determined.
After a 2-hour interval, we started the first session of the MSLT. All of the patients completed five sessions. Various PSG and MSLT parameters and the patients' subjective data were analyzed systematically.
The stages of sleep termination were determined using the last 20 epochs just prior to awakening. If a specific stage occupied more than 50% of that period, we considered that it had terminated at that stage. Most of the non-REM-sleep terminations occurred at stage N2 or a mixture of stages N1 and N2, with only two patients terminating at stage N3. Although we used a cutoff threshold of 50%, the proportion of the specific dominant stage was more than 80% in nearly all of the patients.
We divided the patients into two groups: normal perception (NP) and abnormal perception (AP). AP was defined as the perceived TST being less than 80% of that measured in PSG, as described previously.13 The remaining subjects were classified as NP. We compared the characteristics between these two groups.
Statistical analysis
For continuous variables, we applied Student's t-test to the parametric variables and the Mann-Whitney U test to the nonparametric variables. For the categorical variables, chisquare and Fisher's exact test were applied to the parametric and nonparametric variables, respectively. We regarded results with p values of <0.05 to be statistically significant.
RESULTS
Fifty patients were enrolled, of whom 30 (60%) were classified as NP and 20 (40%) as AP. The sleep perception of all of the subjects was 0.82±0.20 (mean±SD). We classified subjects as mild, moderate, and severe OSA according to apneahypopnea index (AHI) values of 5–14, 15–29, and 30+, respectively; in these groups the sleep perceptions were 0.75± 0.21, 0.89±0.18, and 0.82±0.20 (one-way ANOVA: p=0.19). Only fourteen subjects (28%) answered 'yes' to the questionnaire asking 'did you feel refreshed after sleep?'
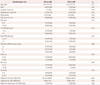
Table 1 summarizes the demographic and post-PSG items in the questionnaire that could potentially be related to sleep perception. There were no group differences in demographic factors such as age, sex, initiation or maintenance insomnia, sleep quality, or ESS, SSS, BDI, BAI, or AIS score. Only the EDS score for the previous week had a tendency of being higher in the AP group. Among the questionnaire items applied after PSG, the presence of dreaming was significantly related to poor sleep perception. The duration of the subjective TST in the AP group was very short, and was around 70% of the objective TST, in contrast to it being 110% in the NP group.
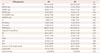
Table 2 presents the relationships between sleep perception and PSG parameters. The periodic limb movement index (PLMI) was significantly higher and the REM latency tended to be prolonged in the AP group. Other latencies, sleep-stage proportions, and various sleep indices including AHI showed no significant group differences.
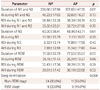
Further analysis was performed to identify whether a disturbance in a specific sleep stage was responsible for poor sleep perception. The results are listed in Table 3. The findings were negative for all of the factors, but there were marginally significant effects of the durations of stages N1 and N2 and the terminal sleep stages just before the final awakening.
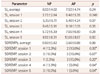
In the MSLT results in Table 4, only the SL in session 1 was significantly prolonged in the AP group. Sleep-onset REM periods could not be analyzed since they were too rare.
DISCUSSION
This is the first study of sleep perception solely in OSA patients. Pinto et al.13 performed a similar study, but they mainly compared between insomniacs, OSA patients, and normal subjects. Their results demonstrated that sleep perception is best in normal subjects, worst in insomniacs, and somewhere in-between in OSA patients. This meant that some factors in OSA itself had disturbed sleep perception, but they did not identify any associated factors. In contrast, our subjects were all OSA patients, and we attempted to determine the related factors by grouping them. We chose OSA patients as subjects on the assumption that their sleep disturbances and other factors could provide us with insight that could not be obtained when using normal subjects or insomniacs. Additionally, the severity of OSA could be quantified and the influences on sleep perception could be analyzed according to the score, as was implicated in the study of Pinto et al.13 The present report is the first of its type in the literature.
There is a report on the association of high PLMI with poor sleep perception,21 but this is contradicted by the results of another study.22 Periodic limb movement during sleep (PLMS) was reportedly most frequent during the first few hours of sleep, gradually decreasing thereafter.21 This finding is in line with the generally accepted idea that the initiation of insomnia is related to sleep misperception. Our results are consistent with a positive association of PLMI with sleep perception, but the proportion of insomniacs and the arousal index (AI) did not differ between the groups included in this study. Thus, the mechanism by which PLMS can affect sleep perception was not determined.
We originally postulated that more severe OSA is related to more severe sleep misperception. This was based on Smith et al.23 reporting a strong positive correlation between OSA and an insomnia-symptom severity score as well as the above-mentioned study by Pinto et al.13 The aims of these studies differed from ours, in that they both focused on a major role of insomnia in sleep perception. In the present study, we hypothesized that relatively frequent arousals during sleep might be related to poor sleep perception, including in OSA patients. In addition, we postulated that compared to patients with mild OSA, those with severe OSA would exhibit greater sleep fragmentation, leading to worse sleep perception. Thus, we expected that the respiratory disturbance index, AHI, and AI would be higher in the AP group. However, our postulation was demonstrated to be incorrect—this finding has clinical significance because it indicates that good sleep reported by a patient does not always mean milder OSA. Instead, only an objective measure can confirm the degree of OSA.
Sleep stage is another important aspect of research into sleep perception. Our results demonstrated no significant difference in the duration of stages or the number of respiratory events in each stage, except for a marginally significant difference in the durations of N1 and N2 duration. In addition, though marginally significant, the REM latency was prolonged in the AP group, and other latencies were also slightly prolonged. This suggests that the sleep phase was delayed in the AP group.
The reason why those woken from REM sleep perceive that they have experienced less sleep needs to be addressed. This objective finding is also consistent with the subjects who had reported dreaming just after awakening perceived that they had slept less well, as indicated in Table 1. We assume that an incompleteness of the sleep cycle may have affected sleep perception or a misperception of dreaming as wakefulness may have influenced on the sleep perception. There are several possible explanations for these observations. First, most of our patients needed to be woken in the morning. Those woken from REM sleep might still have otherwise remained in REM sleep unless their sleep was terminated involuntarily. We think that this deficiency in REM sleep might have contributed to their poor sleep perception. Second, REM sleep is associated with vivid dreaming and our poor perceivers might have regarded this as full wakefulness. Consequently, that period would not have been added to their subjective sleep time. More studies are needed that focus not only on the sleep initiation period but also on how the sleep is terminated.
Regarding the MSLT, SL in the first session was significantly prolonged in the AP group. This finding is reminiscent of previous studies that stressed insomnia as a factor contributing to poor sleep perception, although our patients were mostly not insomniacs.1424 Two previous studies have addressed the MSLT and sleep perception. Bishop et al.24 investigated the association between the mean SL and sleep perception, and found that the mean SL was significantly longer in their misperception group. Huang et al.14 reported a significant negative correlation between sleep perception and mean SL in patients with primary insomnia (r=-0.20, p=0.027). The prolonged SLs in our AP group could reflect the slightly larger proportion of time spent in N3 sleep and the longer absolute N3 duration of the previous night. One other explanation of the prolonged SL is a slight delayed sleep phase syndrome in the AP group. However, the SL difference was very small and this study was not designed for that. Further study is needed.
The smallness of the sample is the main limitation of this study. Those who visited our sleep clinic complained of snoring and respiratory difficulties during sleep, but many of them did not meet the inclusion criteria when PSG was performed. The sample smallness made it more difficult to detect statistically significant differences in some aspects.
However, this study identified high scores for EDS and that the presence of dreaming with a terminal REM sleep had a detrimental effect on sleep perception, and we suspect that a delayed circadian sleep phase may play a role in poor sleep perception. PLMS was also significantly greater in the AP group than in the NP group; however, this should be investigated further because we excluded subjects with moderate-to-severe PLMD. Clinically, poor-sleep perceivers can be found to be less sleepy when an objective measure is applied, and thus physicians should keep in mind that OSA is not necessarily less severe in OSA patients who perceive that they are sleeping well.
 XML Download