

 PDF
PDF ePub
ePub Citation
 Print
Print


Introduction
Alzheimer's disease (AD) is one of the most common neurodegenerative disorders and is the most common cause of dementia in the elderly. AD is associated with structural alterations in the medial temporal lobe (MTL) and functional alterations in the posterior cortical region, especially in the early stages.1-3 Atrophy of the MTL, including the hippocampus and entorhinal cortex, is one of the most sensitive biological indicators of AD, and hippocampal volumetry is the best-established structural biomarker for AD, particularly for early diagnosis.2,4-6
The precuneus, which lies within the posterior association cortex, has recently received a great deal of attention in functional neuroimaging studies. Anatomically the precuneus is located in the posteromedial parietal lobe and corresponds to the medial portion of human cerebral cortical Brodmann's area 7.7-9 The precuneus has a widespread network of higher-association cortical and subcortical structures, as well as reciprocal interconnections with adjacent areas of the posteromedial cortex, including the posterior cingulate and retrosplenial cortices, which to some extent provide an anatomical basis for their functional coupling.9 The precuneus is an intriguing cortical area, not only due to its possible early involvement in AD,10 but also because of its putative role in fundamental cognitive functioning.9 However, functional imaging studies of the precuneus reflect neural activity only indirectly. Although voxel-based morphometry (VBM) studies have demonstrated the importance of the posteromedial cortex, including the precuneus, as an atrophic focus outside the MTL in AD,11 assessing the precuneus separately from the adjacent posteromedial cortex is technically challenging because it requires an anatomical precision that cannot be attained in VBM studies. In addition, automated VBM methods based on group comparisons do not provide absolute regional volumes and are less sensitive to other large-scale volumetric differences in gross anatomy, limiting their use to investigations of relationships between brain structures.12-14 In contrast, the region-of-interest (ROI) approach of manual volumetric methods, which outlines the structure of interest on the corresponding sections, can apply a priori definitions of specific brain regions and the observer's hypothesis.12 Such direct measurements allow the volume of the structure be computed in order to assess the level of atrophy, providing absolute regional volumes that cannot be measured using VBM.
The aims of the current study were to determine 1) the relationship between precuneal and hippocampal volumes in AD patients using a manual magnetic resonance (MR) volumetric method, 2) the utility of precuneal volume measurements to differentiate AD patients from age-matched controls, and 3) the possible associations between precuneal volume and specific neuropsychological domains in AD patients.
Methods
Subjects
Twenty-three subjects with AD (19 women, 4 men; aged 74.4±6.3 years, mean±SD) and 14 age-matched healthy elderly subjects with no cognitive impairment (9 women, 5 men; aged 70.6±5.2 years) were recruited through the outpatient clinic at The Catholic University of Korea, Daejeon St. Mary's Hospital. All participants were right-handed, provided a detailed medical history, completed the Korean version of the Mini-Mental State Examination (K-MMSE),15 and underwent physical and neurological examinations, and brain MR imaging (MRI). AD subjects met the diagnostic criteria for probable AD of the National Institute of Neurological and Communicative Disorders and Stroke-AD and Related Disorders Association.16 The severity of dementia was classified based on the Clinical Dementia Rating (CDR).17 Subjects with AD received an extensive neuropsychological test battery,18 which was performed within 2 weeks of the brain MRI, and underwent laboratory tests to exclude other causes of dementia.
Patients who had a history of head trauma, psychiatric disorders, alcohol or substance abuse, atypical headache, evidence of other neurologic or medical conditions that could cause cognitive impairment, or a significant MRI abnormality were excluded from the study. The research protocol was approved by the institutional review board, and informed consent was obtained from all participants.
MRI data acquisition
All subjects underwent MRI within 2 weeks after entry into the study. T1-weighted three-dimensional volumetric brain MR images were acquired with a 1.5-Tesla MRI scanner (Intera, Philips Medical Systems, Best, The Netherlands) by three-dimensional fast field echo sequences with a thickness of 1.0 mm and no gap in the sagittal plane. The acquisition parameters were as follows: repetition time=25 ms, echo time=4.6 ms, flip angle=30°, field of view=240×240 mm2, matrix size=240×240, voxel dimensions=1.0×1.0×1.0 mm3, number of excitations=1, and number of slices=150-170.
Imaging processing and analysis
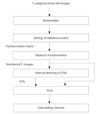
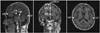
Data were reformatted, transformed to Talairach coordinates,19 and segmented manually into the precuneus, hippocampus, and intracranial cavity (ICC). The volumes of these regions were then calculated automatically by the fuzzy c-means (FCM) algorithm20 using customized in-house software, as shown in Fig.1. Sagittal images were acquired by realigning the anterior-posterior axis of the brain parallel to the line of the anterior and posterior commissures and aligning the other two axes to the interhemispheric fissure. Data were then reformatted into images in the horizontal and coronal planes so that they could be displayed simultaneously in three dimensions. To adjust individual differences in total brain volume (BV) and brain orientation, as well as head tilt, the images were transformed into Talairach coordinates based on ten manually selected points, as shown in Fig. 2. The whole volume data were then divided into 12 hexahedrons using 10 reference points and were affine-transformed into Talairach coordinates.21
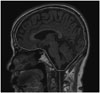
Volumetric measurements of the precuneus, hippocampus, and ICC were performed by manually tracing their volumes of interest (VOIs) using the FCM algorithm. That of the ICC was obtained by manually tracing the contour of the dura mater22 in the sagittal plane, as shown in Fig. 3. One rater performed the manual tracing of all ICCs. The left and right precuneus and hippocampus were manually segmented separately in the sagittal and coronal planes, respectively. Boundaries of the ROIs in each slice (i.e., precuneus, hippocampus, and ICC) were traced manually using a mouse-driven cursor, resulting in VOIs. The FCM algorithm is a clustering method that is used to classify every image pixel into C subgroups, such that the image pixels in a subgroup show a certain degree of closeness or similarity.20 The ICC was classified into white matter (WM), gray matter (GM), or cerebrospinal fluid (CSF) by assigning every voxel to the cluster that corresponded to the maximum degree of similarity using the FCM algorithm. Volumes of the WM, GM, and CSF in the precuneus, hippocampus, and ICC were measured by counting the number of voxels within each VOI; the voxel dimensions were 1.0×1.0×1.0 mm3. The intracranial volume was defined as the sum of the BV (sum of GM plus WM volume) and the CSF volume. The volumes of the precuneus and hippocampus were defined as the combined GM and WM volumes within these areas.
To further account for individual differences in head size, the volumes of each precuneus and hippocampus were normalized to individual total intracranial volume (TIV), and their normalized volumetric ratios were used for statistical analysis. Normalized volumes for brain ROIs were measured in the same units, and values were multiplied by 1,000 to reduce the number of decimal figures using the following formula: normalized regional volume=(absolute volume in cm3/intracranial volume in cm3)×1,000.
ROI analysis
The ROIs of the precuneus and hippocampus were determined in the sagittal and coronal planes, respectively. All volume measurements were performed on consecutive slices based on intrinsic anatomical landmarks.
Assessment of precuneal volume
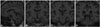
Using the most-representative slice of the midsagittal section for each subject, the outline of the precuneus was traced manually on each sagittal slice. References to coronal or horizontal orientations were made for a more precise identification of structure boundaries. The precuneus was segmented according to the atlas of Duvernoy7 and anatomic and radiologic findings of Salamon et al.,8 referencing a previously described method.23 The main landmarks of the precuneus were defined as follows: anterior, marginal segment of the cingulate sulcus; posterior, parieto-occipital fissure; superior, superior margin of the brain; and inferior, subparietal sulcus (Fig. 4A). The medial limit of the precuneus was defined as the cortical surface within the interhemispheric fissure, and the lateral limit was defined as the sagittal level at which the subparietal sulcus disappeared with the lateral end point of the subparietal sulcus on the coronal orientation serving as a reference point.
Assessment of hippocampal volume
The anatomical landmarks and boundaries used for this volumetric method were based on the morphological description of Duvernoy24 and guided by the previously described protocols.25,26 The boundaries of the entire anterior-posterior extent of the hippocampus (including its head, body, and tail) were outlined on coronal MR images (Fig. 4B, C and D), and sagittal or axial orientations were often used to validate neuroanatomical boundaries. Measurements included the hippocampus proper, dentate gyrus, subiculum, alveus, and fimbria. Tracings started with the first section in which the head of the hippocampus was distinguishable from the overlying amygdala by the presence of the alveus or uncal recess of the temporal horn. The posterior boundary was defined as the coronal section where the fasciolar gyrus begins to curve around the posteroinferior margin of the splenium as the indusium griseum.
Reliability
All measurements were performed by one rater who was blinded to subjects' identities. Interrater and intrarater reliabilities were measured for the volumes of the precuneus and hippocampus as determined by ROI boundaries. The interrater reliability was determined based on five randomly selected scans that were measured independently by two raters. The interrater intraclass correlation coefficients of all ROIs exceeded 0.909 (precuneus: 0.909 for left and 0.949 for right; hippocampus: 0.963 for left and 0.921 for right). Each volume was then remeasured after at least 4 weeks by the principal rater. The intrarater intraclass correlation coefficients of all ROIs exceeded 0.928 (precuneus: 0.986 for left and 0.987 for right; hippocampus: 0.928 for left and 0.957 for right). After reliability evaluation, the same investigator with expertise in ROI delineation completed all ROI tracings from the precuneus and the hippocampus.
Neuropsychological assessment
AD patients completed a neuropsychological assessment using a standardized neuropsychological battery (Seoul Neuropsychological Screening Battery).18 All tests were performed by a trained expert, who was blinded to clinical and radiological information. The battery included tests of attention (digit span test: forward), verbal memory (Seoul Verbal Learning Test: recall and recognition), visual memory [Rey-Osterrieth Complex Figure Test (RCFT): recall and recognition], frontal executive functions (contrasting program; go-no-go test; Controlled Oral Word Association Test for Categories: animal and supermarket, and for Letters; Korean-Color Word Stroop Test: word reading and color reading), visuospatial function (RCFT copy), and the Korean version of the Boston Naming Test.
Statistical analysis
Statistics were performed with SPSS software package version 13.0 (SPSS Inc, Chicago, IL, USA) with significance set at p<0.05. Demographic data from the two groups were analyzed with Student's t-test for continuous variables and the χ2 test for gender. Regional volumes from the two groups were compared using analysis of covariance with age as a covariate. Mean volumes from the left and right sides of each VOI were compared using the paired t-test. Correlation analysis using Pearson's correlation coefficient (r) was performed between regional volumes, as well as between the volume of the precuneus and the cognitive scores in the AD group. Data are presented as mean±SD values.
Results
Demographic data
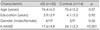
The demographic characteristics are summarized in Table 1. The age, level of education, and gender distribution did not differ significantly between the AD group and the healthy control group. The K-MMSE score was significantly lower in the AD group than in the control group (17.6±4.8 vs. 24.1±2.3, p<0.001). The CDR score in the AD group was 1.04±0.56.
Volumetric measurements
Regional volumetric ratios that were normalized to individual TIVs were used for group analysis. The precuneal and hippocampal volumes of the two groups are presented in Table 2. The volume of the total precuneus was significantly smaller for patients with AD than for age-matched controls (p≤0.01), which included a significant difference on the right side (p<0.01) and a trend toward a difference on the left side (p=0.066). In addition, the volumes of the bilateral hippocampi were smaller for the AD group than for controls (p<0.01 for the left side and p<0.001 for the right side). The AD group exhibited a trend toward a reduction in BV relative to the control group (p=0.053).
In the AD group, there was a trend toward a smaller precuneal volume on the right side relative to the left (p=0.079) and for a smaller hippocampal volume on the left relative to the right (p=0.062). In the control group, no significant volume differences were observed between the left and right precuneus (p>0.05), but the hippocampal volume was smaller on the left side than on the right (p<0.001).
Relationships between volumetric measurements
Correlational analyses were performed in the AD group; the results are presented in Table 3. No correlation was found between total precuneal and hippocampal volumes (r=0.086, p>0.05). The total hippocampal volume was correlated with BV (r=0.521, p<0.05), and this remained significant after controlling for age and K-MMSE score (r=0.509, p<0.05). The total precuneal volume was not correlated with BV (r=0.217, p>0.05).
Relationship between precuneal volume and neuropsychological performance
Among the various neuropsychological tests performed in the AD patients, only the RCFT (r=0.474, p<0.05) and the Category Fluency Test (r=0.438, p<0.05 for animal; r=0.504, p<0.05 for supermarket) showed significant correlations with the total precuneal volume. These correlations remained significant after controlling for age and education.
Discussion
This study used manual MR volumetry to demonstrate that our AD patients had a significant total precuneal atrophy, especially on the right side, as well as hippocampal atrophy, compared with the control group. There was no correlation between the total precuneal and hippocampal volumes in the AD group. The total precuneal volume was correlated with the category fluency and visuospatial tests of neuropsychological function.
Volumetric analysis using high-resolution three-dimensional MRI has recently become increasingly important in the study of AD, particularly as a diagnostic aid and as a biomarker of disease progression.12,27 Hippocampal volumetry in AD can help to distinguish AD patients from elderly controls and to predict the conversion of mild cognitive impairment (MCI) to AD.2 Although they are time-intensive, manual volumetric methods are currently the gold standard for determining hippocampal volume,28 and such methods have been used to assess other structures in AD, such as the entorhinal and temporal cortices and the cingulate gyrus.5 However, few data on other brain regions are available. The present findings show a significant volume reduction of the total precuneus in AD subjects using MR volumetry, which is consistent with several VBM results showing volume reductions in the posteromedial cortex.11,29,30 Our AD subjects exhibited a significant volume reduction in the right precuneus and exhibited a trend toward a reduction in the left precuneus, compared with controls (Table 2). There were no statistically significant right-left differences in precuneal volume, although there was a trend toward a smaller right precuneus in the AD group. With regard to the hemispheric asymmetry, several volumetric MRI studies have suggested a role of hippocampal asymmetry in AD, although there is no consensus on this topic.31-35 Many VBM studies have shown that the bilateral precuneus and MTL are involved in AD.11,29,36-38 Some VBM results have suggested the presence of asymmetry in the brains of AD subjects, citing differences in T scores between the left and right sides.39 However, VBM is a less-sensitive measure of symmetric or asymmetric involvement of brain regions because it was not developed to formally test for regional brain differences. To our knowledge, the current study is the first to measure the precuneal volume in AD using manual volumetry. This study should be replicated with different samples since the sample characteristics may affect the obtained results.
The precuneus has received a great deal of attention in the more recently available neuroimaging tools such as functional MRI and positron-emission tomography. Positron-emission tomography or single-photon-emission computed tomography studies have consistently demonstrated that AD is associated with dysfunction (hypometabolism or hypoperfusion) in the posterior temporoparietal association cortices and later in the frontal association cortices, and whole-brain voxel-based investigations have implicated the posterior cingulate-precuneus area as the region with the earliest and greatest functional changes.3,40,41 Functional imaging of AD brains has demonstrated prominent reductions of metabolism in the posteromedial cortex, even in the early stages when pathology is limited to the MTL. It has been suggested that functional posterior cortical abnormalities in early AD could be due to the remote effects of medial temporal damage (disconnection or diaschisis) or to local pathology.42 Disruption of the cingulum bundle in MCI and AD,43 as well as disruption of the connections between the MTL and retrosplenial cortex44,45 support the "diaschisis" hypothesis for posterior cortical hypometabolism.46 However, another study suggested that local pathology in that area appeared in the early stages of AD.47 Our study found no correlation between the precuneal volume and the hippocampal volume, suggesting that precuneal atrophy occurs independently of hippocampal atrophy and that local pathology contributes more to early functional abnormalities of the posteromedial cortex than any remote effects of the MTL lesion. Similar to other areas of the neocortex, the precuneus demonstrated increased diffuse and neuritic amyloid plaques early in the evolution of AD, compared with increased neurofibrillary tangles in the MTL.48 The precuneus also had the highest 11C-Pittsburgh Compound-B uptake of all GM regions examined in AD subjects.10 Therefore, amyloid deposition in the precuneus could underlie the local pathology linked to precuneal atrophy. Together these observations suggest that amyloid deposition in the precuneus causes atrophy in the early stage of AD, leading to more significant atrophy as the disease progresses, which in turn causes functional alterations of the precuneus. Furthermore, our study showed that the BV, an indicator of global BV, was correlated with the hippocampal volume but not the precuneal volume, suggesting that precuneal atrophy is less related to global brain atrophy.
Recent functional imaging studies have suggested a central role for the precuneus in a wide range of highly integrated tasks, including visuospatial imagery, episodic memory retrieval (especially with autobiographical content), self-processing, and consciousness.9 In addition, the precuneus and surrounding posteromedial areas belong to the default network, which is a specific, anatomically defined brain system that is preferentially active when individuals are not focused on the external environment.49,50 These highly integrated functions reflect cognitive processes that are engaged by tasks in different cognitive domains, suggesting a common role of the precuneus in various cognitive processes.9 In the current study, precuneal volume was correlated with the category fluency test and visuospatial functioning. Functional neuroimaging research has demonstrated that the posteromedial cortex, a region that has anatomical connections with the MTL, is active during the retrieval of previously learned information.51,52 We presume that the correlation of precuneal volume with the category fluency would be related to the retrieval of previously learned information. In addition, the posteromedial cortex is known to be concerned with aspects of visuospatial processing.9,53,54 Karas et al.38 found that a smaller precuneus was associated with impaired visuospatial functioning, which is consistent with our results showing the correlation between precuneal volume and visuospatial functioning. However, it is not possible to draw any firm conclusions about the role of the precuneus in cognitive function because the neuropsychological battery of cognitive tests used in the current study does not reflect highly integrated tasks.
Despite the relatively small number of subjects in each group, the current study is promising because we controlled for several potential confounding factors. A ten-point linear transformation was used to place images into the standard Talairach atlas space to correct for differences in brain orientation and head tilt, and the volumes of the precuneus and hippocampus were examined after normalization to TIV in order to correct for variations in head size. However, additional studies with larger numbers of AD subjects (as well as MCI subjects) would strengthen the current findings and assess a relationship between precuneal atrophy and disease progression.
In conclusion, the precuneal atrophy observed in the AD group suggests that MR volumetric assessment of precuneal volume, in addition to hippocampal volume, might be a useful radiological index for the diagnosis of AD. Furthermore, the lack of correlation between the precuneal and hippocampal volumes in AD supports the theory that precuneal atrophy is due to local pathology rather than occurring as a secondary consequence of MTL pathology.


 XML Download