

 PDF
PDF ePub
ePub Citation
 Print
Print


Introduction
In 2015, there was a nationwide outbreak of Middle East Respiratory Syndrome coronavirus (MERS-CoV) infection in Korea, initiated by a single case returning from the Middle East and eventually, resulting in 186 laboratory-confirmed cases and 38 deaths [1]. This outbreak was sparked by delayed recognition of the primary case, ineffective contact tracing and suboptimal control measures, and delayed disclosure of affected healthcare facilities by the Korean Government during the early stage of the epidemic [23]. Additionally, the potential for superspreading events of MERS-CoV infection in healthcare facilities was underestimated [4]. Despite the inadequate initial response, stringent countermeasures were implemented and laboratory testing increased beginning in early June of 2015 [56], leading to a sharp decline in the number of new cases of MERS-CoV infection and eventual containment of this outbreak within two months.
When deciding on infection control policies, epidemiologic parameters play an important role. The incubation period, defined as the time from infection to the onset of symptoms, is used to determine the duration of quarantine or monitoring of exposed individuals and to identify the potential sources of infection [7]. Defined as the average number of secondary cases caused by a primary case, the reproduction number quantifies transmission potential of a disease within a population to help determine the effort needed in order to contain the epidemic and to monitor the effectiveness of countermeasures [8].
However, these parameters are not constant, and are influenced by multiple factors. Incubation periods have inter-individual variations, which are largely attributable to the initial infective dose and inoculation route of the pathogen, the replication rate within the host, and host susceptibility [7]. The reproduction number also changes over time and depends on environmental and cultural factors, crowding, and health status of the population [9]. Moreover, the value of the reproduction number reflects the effectiveness of countermeasures during the epidemic [10].
The MERS outbreak in Korea was characterized by superspreading events in the healthcare setting [4], which were likely the results of different combinations of individual variations (e.g. high viral shedding and behaviors), pathogens and environmental factors (e.g. crowded conditions, contamination by fomites or close contact in healthcare settings) [11]. Such heterogeneity in transmission might mistakenly lead to overestimatinge the transmissibility of MERS-CoV in the community or other settings. A wide range of variability in incubation periods raised a controversy regarding the effectiveness of the countermeasures including a 14-day quarantine for exposed individuals. Therefore, a detailed understanding of key epidemiologic parameters is essential to prepare for any MERS-CoV epidemics that may occur in the future.
This study aimed to explore change in the incubation period and reproduction number over time and to identify the factors influencing the length of incubation periods during the epidemic of MERS-CoV infection epidemic in Korea in 2015.
Materials and Methods
1. Sources of Data
Publically available data were retrieved from the Korea Centers for Disease Control, the Korean Ministry of Health and Welfare [1], the World Health Organization [12], and published literature [246131415161718]. In addition, data were collected from a series of conference proceedings [192021], published government or hospital reports the MERS outbreak in Korea and local Korean news reports from May 2015 to February 2016. The latest published articles and conference proceedings were regarded as the most reliable resources followed by the government documents, and news reports. The available data concerning each case include age, sex, presence of comorbidities, date of symptom onset, date of laboratory confirmation, date of hospitalization, mortality, most likely source of exposure, and the possible locations where transmission might have occurred. This analysis included cases with probable or identified epidemiologic links; cases with multiple potential sources of exposure or unidentified sources were excluded.
2. Definitions
MERS-CoV infection was confirmed by positive real-time reverse transcriptase polymerase chain reaction assays as in the guidelines for laboratory diagnosis of MERS-CoV in Korea [22].
The date of symptom onset was defined as the first date of fever (≥37.5℃) or any relevant clinical symptoms among symptomatic patients [23]. When patients had no symptoms or symptoms were not clearly identified or reported, the symptom onset was defined as the date of the first positive laboratory test. In source cases, the number of days of illness was defined as the time from the symptom onset in source cases to the first date of exposure in their secondary cases.
The MERS outbreak in Korea comprised three generations of disease. The index case was defined as the Generation Zero, with the first generation including secondary cases of this generation. Likewise, the subsequent generation comprised secondary cases of the previous generation: i.e. the second generation comprised secondary cases of the first generation of infection and the third generation comprised secondary cases of the second generation [2]. Superspreaders were defined as cases who were responsible for transmitting the virus to 5 or more individuals [6].
MERS countermeasures were taken chronologically as follows. Initial interventions included quarantining only contacts who shared the same room with the primary case and healthcare workers who cared for him/her. As of May 29, the operational definition of close contacts was broadened and all contacts were vigorously traced and quarantined in an institution or at home for 14 days. Since June 3, laboratory testing has expanded and has become available in commercial laboratory testing centers, university hospitals, and local health and environmental institutes. On June 7, names of affected healthcare facilities were disclosed to the public and Drug Utilization Review (DUR) information was used to inform healthcare facilities of any possible points of contact [5]. Infection control practices in healthcare facilities were intensified, such as appropriate use of personal protective equipment, environmental disinfection, complete/partial closure of the affected wards and quarantine of exposed patients in hospital. Updated infection control guidelines were issued. As of June 8, the Rapid Response Team was organized to take decisive action on countermeasure strategies and determine the extent and duration of quarantine for affected hospitals, in collaboration with the Ministry of Health and Welfare, hospital administrators, and local public health centers [24]. Fever clinics were set up to screen possible MERS cases and patients with pneumonia were preemptively isolated until they tested negative for MERS-CoV infection. As of June 10, nationwide pneumonia surveillance was also carried out in order to detect unidentified MERS cases [6].
3. Statistical Analysis
1) The incubation period and serial interval
The incubation period was calculated by identifying the earliest and latest possible date of exposure and the date of symptom onset for each case. Because the data are interval censored, we used non-parametric and parametric methods to estimate the incubation period. First, we calculated the observed (non-parametric) incubation period per each case, defined as the time interval between the midpoint of exposure period and the date of symptom onset. Kaplan-Meier analysis was used to estimate the median value of the observed incubation periods. Second, we fitted the data to a gamma distribution and identified the maximum-likelihood estimates of the incubation period. The parametric distribution was compared with empirical cumulative density functions of the observed incubation period.
To identify the variables associated with observed incubation period length, the Cox proportional hazard function was used. In addition, the fitted distributions of incubation periods were compared by bootstrapping the difference in means to verify the results of the univariate analysis. Multivariate analysis was performed by incorporating significant variables in the univariate analysis (P<0.1) and other potential confounders such as age, sex, and underlying diseases.
The serial interval was estimated by identifying the infector-infectee pairs and the onset of symptoms of each pair. Cases with unidentifiable symptom onset or asymptomatic cases were excluded from estimating the serial interval. For sensitivity analysis, various definitions of exposures and symptom onsets were used to evaluate the difference among groups. Data analyses were performed using R version 3.2.5 (R Foundation for Statistical Computing, Vienna, Austria) and coarseDataTools in R [25].
2) The effective reproduction number
Because of the transmission heterogeneity, early estimates of basic reproduction number can be inappropriate. The effective reproduction number (R), the actual average number of secondary cases per primary case, is commonly used to characterize transmissibility and to assess the effectiveness of countermeasures during an epidemic, given that R less than the epidemic threshold at 1 suggests an epidemic under control [26]. Countermeasures implementation affects contact rates and transmissibility, and consequently, the value of R can change over time. Taking this effect into account, we estimated R using three methods: the reproduction number at disease generation (Rg), the case reproduction number (Rc), and the time varying instantaneous reproduction number (Rt)
Rg was calculated by averaging the number of secondary cases caused by each primary case in each time of disease generation [27]. Rc is the average number of secondary cases that individuals with symptom onset at time t can expect to infect. This was estimated by applying a likelihood-based method by Wallinga and Teunis [10]. Rt is the average number of secondary transmissions occurring at time t [2628]. Rt was estimated by applying Bayesian statistical inference incorporating uncertainty in the distribution of the serial interval [26]. We used the mean serial interval (12.9 days ± 4.4 days) estimated from this study, the serial interval (12.6 days ± 2.8 days) from the previous analysis was also used for sensitivity analysis [16]. Daily Rc and Rt were estimated over a one-day window using EpiEstim in R [26].
Results
1. Description of Transmission
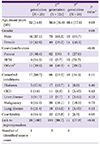
Data were collected from a total of 186 cases. Beginning from the Generation Zero (the primary case), there were 28 cases, 124, and 29 cases in the first, second, and third generation, respectively. There were four cases for which generation was not classified; three of them could have been exposed to either the first or second generation cases and one did not have any identifiable epidemiologic link with confirmed cases. A total of 150 cases (81.1%) were linked to 5 superspreaders. The demographic and clinical characteristics of these cases are summarized in Table 1.
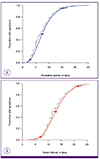
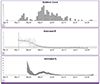
We estimated the incubation periods of 162 cases with a single source of exposure (28, 113, and 21 cases in the first, second, and third generation, respectively). Among these 162 cases, dates of symptom onset were not validated in 9 cases in the second generation, so the serial intervals were estimated with the data of 153 cases. The overall median incubation period was estimated to be 7.4 days (95% confidence interval [CI], 6.9-8.0) with less than 2.9 days in 5% of cases and less than 15.3 days in 95% of them (Fig. 1A). The median serial interval was estimated to be 12.9 days (95% CI, 12.2-13.5) with less than 6.9 days in 5% of cases and less than 21.5 days in 95% (Fig. 1B). The temporal trends of incubation periods and serial intervals are depicted in Figure 2. The time from onset to laboratory confirmation was shortened over time during the MERS outbreak (Fig. 2).
2. The Incubation period and associated factors
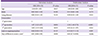
The incubation periods did not significantly differ according to age, sex, or the presence of comorbidities. Instead, they were different according to the order of disease generation, links to superspreaders, and the days of illness in source cases when transmission occurred (Fig. 3, Table 2, supplementary Table 1).
The first generation cases had significantly shorter incubation periods than those of the second or third generation. Moreover, cases linked to superspreaders tended to have shorter incubation periods than those without any links to superspreaders.
We found that the days of illness in source cases were inversely correlated with the incubation periods of their secondary cases (hazard ratio [HR], 0.91 [95% CI, 0.84-0.99] per one illness day increase; P=0.026). There was a trend toward shorter incubation periods for receiving cases when source cases had been ill for longer when the exposure occurred. Incubation periods were significantly longer in cases who were exposed to their source cases in ≤ 3 days of illness (median 8.9 days [95%CI, 7.2-10.7]) as compared to those whose source cases had been ill for ≥4 days (median 6.8 days [95% CI, 6.3-7.4]) whereas those exposed to infectors who had been ill for ≥7 days had shorter incubation period (median 5.9 [95%CI 4.8-7.3] days).
In the multivariate analysis, this inverse relationship was not changed (HR, 0.83 [95% CI, 0.74-0.93] per increase of one illness day; P=0.001) whereas the effect of the generation order on the length of incubation periods was attenuated (Table 2).
In the MERS outbreak in Korea, the third generation cases were exposed to their source cases in the early stage of disease as compared to case of other generations. The median days of illness in source cases were one day among the third generation cases whereas the second generation cases were exposed to those undergoing a median 6 days of illness. As the epidemic progressed, the time from symptom onset to laboratory confirmation was becoming shorter as illustrated in Figure 2, which indicated early detection and isolation of MERS cases once they had symptoms during the late phase of the epidemic.
3. The reproduction number over time
The generational reproduction number was estimated with the data of 182 cases with identified generations. Despite the zero generation (the primary case) generating 28 cases (Rg 28), a rapid decline in Rg was noted from 4.43 (124/28) in the first generation to 0.23 (29/124) in the second generation. When reanalyzing only cases associated with non-superspreaders, the value of Rg was estimated to be <1 in the first generation (0.56, 14/25).
Such findings were consistent with the estimated Rc. The epidemic curve was converted into the time course of effective reproduction numbers (Fig. 4). Rc was estimated to be 3.99 on May 19 and plateaued for a week, then declined thereafter. Rc began to fall below the epidemic threshold level at a value of 1 on May 31 and then declined towards 0 through June. This date coincided with the highest peak in the incidence of MERS-CoV infection in the epidemic curve. Estimation of Rt showed two peaks coinciding with occurrence of the initial and subsequent superspreading events. Afterwards, Rt decreased steadily and fell below a value of 1 on June 12. Rc was ahead of Rt by approximately 13 days (the mean serial interval), meaning that decreased transmissibility on June 12 was attributable to the low transmission potential in cases who had the symptom onset on May 31.
Discussion
This study explored the effectiveness of the countermeasures and their impact on incubation periods and reproduction number during the MERS outbreak in Korea in 2015. As the epidemic progressed, the incubation periods became longer, which was partially attributable to the stringent countermeasures which were implemented since the second epidemic wave. The effectiveness of countermeasures was suggested by the decline in the reproduction number in late May and early June.
Although the variations in incubation periods are often considered to be intrinsic to the pathogens and hosts [29], environmental factors also play an important role in determining their duration. Because the infective dose can be influenced by the disease status of infectors and route of transmission, the infection control interventions, such as early detection and isolation of symptomatic cases and use of protective equipment, could influence incubation duration by reducing the chance of exposure to higher viral loads. This phenomenon was observed in the MERS outbreak in Korea where the incubation periods tended to be longer as the order of the disease generation increased.
During the MERS outbreak in Korea, the time from symptom onset to confirmation decreased over time as the laboratory tests became widely available. As cases were more readily identified during the outbreak, the third generation cases could have fewer chances to be exposed to infectors in the later stage of illness and have longer incubation periods as a result. The inverse relationship between the days of illness in source cases and incubation periods in their secondary cases in this study also supports this finding. Moreover, a recent study showed that the timing and intensity of viral shedding in MERS cases was similar to that of severe acute respiratory syndrome (SARS) with the peak shedding after 10-12 days from symptom onset [30]. However, the information on the viral shedding kinetics of MERS-CoV is still limited [31] and there were exceptional cases with the highest viral loads in the early stage [30]. Therefore, future research should be focused on the kinetics of viral shedding in order to gain concrete knowledge on the transmission dynamics of MERS-CoV. Besides the effect of countermeasures, the incubation period could have been affected by different exposure settings, adequate use of personal protective equipment, behavioral change with the increase in public awareness, and by stochastic effect.
Despite the inappropriate response during the initial stage of the MERS outbreak in Korea, tremendous efforts were later made to contain the epidemic. The study results suggest that these stringent countermeasures effectively brought this epidemic under control. The results of all estimated R were consistent. Despite the initial surge in Rg due to the early superspreading event linked to the primary case, Rg rapidly declined to <1 in the second generation which coincided with the time when the value of Rc dropped below a value of 1 on May 31. Rt also followed the temporal trend with a 13-day delay. Although it is difficult to separate the effect of interventional component, the combination of vigorous contact tracing and strict quarantine targeted towards second generation cases was considered to play a key role in lowering the transmissibility in this epidemic.
However, given that the basic reproduction number R0 for MERS-CoV was estimated to be < 1 in the previous literature [32] and considering the low transmissibility among close contacts with non-superspreaders in the MERS outbreak in Korea [33], questions were raised regarding the necessity of such stringent interventions to this degree. In Korea, among 16,752 quarantined contacts, 1.1% were confirmed to have MERS-CoV infection [1]. In the present study, Rg for cases not linked to superspreaders was estimated to be 0.56, indicating that without superspreading events, transmissibility of MERSCoV was substantially low. A decline in Rc immediately after implementation of the stringent interventions also suggests the low transmissibility of MERS-CoV. Nonetheless, the potential of superspreading events should not be underestimated in dealing with MERS-CoV infection. For this reason, it is crucial to identify the factors contributing to such events.
Studies have been performed to characterize superspreaders in the MERS outbreak in Korea. Supersperaders tended to have pneumonia and severe cough at the diagnosis, suggesting higher viral shedding [6]; they also tended to make multiple contacts via multiple facilities [33]. However, there were non-superspreading or non-transmitting cases who had similar characteristics. In order to gain a better understanding of the issues at hand, in-depth research on both cases should be performed taking into account multiple perspectives including those relating to the environment, behavior, virology, and host genetic factors.
This study has several limitations. First, a detailed investigation is currently underway, so "who-infected-whom" pairs and the dates of exposure and onset of symptoms will be subject to change in the future. Thus, the estimated epidemiologic parameters will be subject to change as well. Second, viral loads shed from infectors, the routes of transmission through droplets or contacts, and detailed information on comorbid conditions were not available. As these factors can also affect transmissibility and incubation duration, further further analysis should be performed once such information is open to researchers. Third, there were no serologic data of asymptomatic contacts to this point. Because confirmatory tests were not performed on asymptomatic contacts, it is possible that asymptomatic cases had not been detected. Without this information, the transmission potential could be underestimated. Despite these limitations, this explorative study provides valuable insight into the effectiveness of countermeasures and change in the incubation periods over time during the MERS outbreak in Korea.
As the MERS outbreak in Korea has ended, the question arises regarding how we can use the lessons learnt from MERS to improve countermeasure strategies against future outbreaks of MERS and introduction of new infectious diseases. Our analysis shows that the implementation of stringent countermeasures rapidly limited the impact of the epidemic despite the delayed response in the initial stage. Timely estimation of the transmission potential can help to establish the efforts needed to contain the epidemic. For future research, the impact of each intervention needs to be evaluated through proper modelling of the MERS outbreak in Korea.


 XML Download