

 PDF
PDF ePub
ePub Citation
 Print
Print


INTRODUCTION
Ovarian cancer (OC) is the most deadly gynecological malignancy, causing an estimated 2236 new cases and 1021 deaths in Korea in 2014 according to the National Cancer Information Center statistics (www.cancer.go.kr). Unlike other gynecological malignancies, there are no early detection methods and clear symptoms at early stages; therefore, the majority of patients are diagnosed with late stage III or IV OC that has spread to the upper abdominal area or distant tissues. The 5-year survival rate is approximately 27% in women diagnosed with stage III or IV disease.1
OC metastases have unique biological behavior that differs from the classical patterns of hematogenous metastases. Ovarian carcinoma metastasizes via direct extension from the primary site into neighboring organs or by transcoelomic spread of cancer cells that have exfoliated from the primary tumor.2 Complicated biological processes, such as adhesion, migration, invasion, proliferation, and apoptosis, contribute to OC metastasis. However, the molecular mechanisms behind these processes, including genetic/epigenetic alterations, are not fully understood. Recently, expression of a large number of cancerassociated genes that are regulated by aberrant epigenetic modification have been identified across the development and progression of OC, which suggests that aberrant epigenetic events play critical roles in these processes.34
Through the present study, we discovered that expression of one particular gene, solute carrier family 6 (neurotransmitter transporter), member 12 (SLC6A12), was significantly upregulated and CpG sites in its promoter were hypomethylated in xenografts during metastasis, and we selected it for further investigation. SLC6A12, also known as betaine/γ-amino-n-butyric acid (GABA) transporter, is a member of the solute carrier family 6 and is involved in cellular uptake of betaine and GABA in a sodium- and chloride-dependent manner. It is abundantly expressed in liver and at low levels in kidney and on the brain surface. Its function and regulation as a protector against osmolarity changes in the kidney and as a controller of the inhibitory neurotransmitter, GABA, in the brain have been well documented;56 however, the involvement of SLC6A12 in cancer has not yet been reported. We found that the expression of SLC6A12 was regulated via a DNA methylation-dependent epigenetic mechanism and aberrant overexpression of SLC6A12 conferred metastatic potential to ovarian carcinoma cells. Furthermore, our meta-analysis revealed that SLC6A12 expression and hypomethylation at specific promoter CpG sites was associated with worse prognosis in OC patients. Our findings offer new insight into the role of SLC6A12 in metastatic OC.
MATERIALS AND METHODS
Cell culture
The human OC cell line SK-OV-3 was purchased from American Type Culture Collection (ATCC no. HTB-77; Manassas, VA, USA) and cultured in McCoy’s 5A medium (Gibco/BRL, Rockville, MD, USA) supplemented with 10% fetal bovine serum (Gibco/BRL), 100 U/mL penicillin (Gibco/BRL), and 100 µg/mL streptomycin (Gibco/BRL) in an atmosphere of 95% humidified air and 5% CO2 at 37℃.
Ovarian cancer xenograft mouse model
All procedures for handling and euthanizing the animals used in this study were performed in strict compliance with Korean animal protection laws and were approved by the Institutional Animal Care and Use Committee (IACUC) of Ewha Womans University School of Medicine. SK-OV-3 cells (2×10⁶) suspended in culture medium were injected intraperitoneally into 10 female nude mice (CAnN.Cg-Foxn1NU, 4–6 weeks old). Four weeks after inoculation, the xenograft mice were sacrificed, and at least four tumor metastases adhering to the mesothelial surface of the peritoneum of each mouse were harvested.
Processing of mRNA microarray and analysis of gene expression data
Total RNA was extracted from the tumor metastases of the mice and SK-OV-3 cells using the RNeasy Mini Kit (Qiagen, Valencia, CA, USA). One microgram of total RNA was amplified and labeled according to the Affymetrix GeneChip Whole Transcript Sense Target Labeling protocol. The labeled cDNA was hybridized to Affymetrix Human Gene 1.0 ST arrays (Affymetrix, Santa Clara, CA, USA). The scanned raw expression values were background-corrected, normalized, and summarized using the Robust Multiarray Averaging approach in the Bioconductor “affy” package (Affymetrix). The resulting log2-transformed data were used for further analyses.
To identify differentially expressed genes (DEGs), we applied moderated t-statistics based on an empirical Bayesian approach.7 Significantly upregulated and downregulated DEGs were defined as genes with at least a two-fold difference in expression levels between the xenograft tissues and wild-type SK-OV-3 cells after multiple testing correction [Benjamini-Hochberg false-discovery rate (BH FDR)–adjusted p value <0.05].8
Finally, we excluded genes with a low expression level (maximum log2 expression level in a total of eight samples <7.0) from the list of DEGs.
RNA preparation and reverse-transcription quantitative polymerase chain reaction
Total RNA was extracted from the tumor metastases and SK-OV-3 cells using the RNeasy Mini Kit (Qiagen) according to the manufacturer’s protocol. One microgram of total RNA was converted to cDNA using Superscript II reverse transcriptase (Invitrogen, Carlsbad, CA, USA) and oligo-(dT)12–18 primers (Invitrogen) according to the manufacturer’s instructions. reversetranscription quantitative polymerase chain reaction (RT-qPCR) was performed in a 20 µl reaction mixture, containing 1 µL cDNA, 10 µl SYBR Premix EX Taq (Takara Bio, Otsu, Japan), 0.4 µL Rox reference dye (50×, Takara Bio), and 200 nM primers for each gene. The primer sequences were: SLC6A12 (forward), 5’-CCTGGCCACTTTCCTCTTCTC-3’; SLC6A12 (reverse), 5’-CAGGAACCAGCCAATGGAGTA-3’; GAPDH (forward), 5’-AATCCCATCACCATCTTCCA-3’; and GAPDH (reverse), 5’-TGGACTCCACGACGT ACTCA-3’. The reactions were run on a 7500 Fast Real-Time PCR System (Applied Biosystems, Foster City, CA, USA) at 95℃ for 30 sec, followed by 40 cycles of 95℃ for 3 sec and 60℃ for 30 sec, and a single cycle of 95℃ for 15 sec, 60℃ for 60 sec, and 95℃ for 15 sec to generate dissociation curves. All PCR reactions were performed in triplicate, and the specificity of the reaction was determined by melting curve analysis. Comparative quantification of each target gene was performed based on cycle threshold (Ct) normalized to GAPDH using the ΔΔCt method.
Genomic DNA isolation and CpG methylation microarray
Genomic DNA was extracted from cell lines and tumor metastases using a QIAmp mini kit (Qiagen), according to the manufacturer’s instructions. The Illumina HumanMethylation450 BeadChip (Illumina, San Diego, CA, USA) that targets 450000 CpG sites was used for genome-wide screening of DNA methylation. DNA methylation values were described as β-values, which were calculated by subtracting the background using negative controls on the array and taking the ratio of the methylated signal intensity against the sum of both methylated and unmethylated signals. β-values ranged from 0 (completely unmethylated) to 1 (fully methylated) on a continuous scale for each CpG site. To identify differentially methylated CpG sites, we applied the difference in mean β-value (Δβ; mean β-value in tumors–mean β-value in SK-OV-3). If the absolute difference of the mean β-values (|Δβ|) was >0.2, the site was defined as a differentially methylated CpG site. We described a CpG site as hypermethylated if Δβwas greater than 0.2 and hypomethylated if Δβ was less than −0.2.
Quantitative methylation-specific PCR
Quantitative methylation-specific polymerase chain reaction (qMSP) was carried out with bisulfite-modified genomic DNA as the template and specific primer sequences designed to detect the methylated and unmethylated forms of the CpG at position 323242 on chromosome 12. The following methylated/unmethylated-specific primers were used: (methylated forward), 5’-TAGTTGGGGTTAGTAGAGGTGTAGAC-3’; (unmethylated forward), 5’-TAGTTGGGGTTAGTAGAGGTGTAG AT-3’; and (reverse), 5’-AAAAACTACAAAAAAAACCAAATT TTAATA-3’. For qMSP, a 20 µL reaction mixture, containing 2 µL (10–100 ng/µL) bisulfite-treated DNA, 10 µL SYBR Premix EX Taq (Takara Bio), 0.4 µL Rox reference dye (50×; Takara Bio), and 200 nM of each primer, was amplified using a 7500 Fast Real-time PCR system (Applied Biosystems). The amplification reaction conditions were 95℃ for 30 sec, followed by 40 cycles of 95℃ for 3 sec and 58℃ for 30 sec. The PCR product was then cycled at 95℃ for 15 sec, 60℃ for 1 min, and 95℃ for 15 sec to generate the dissociation curves for analysis. Methylation and non-methylation of the specific CpG sites were calculated as follows (Ct represents the threshold cycle):
5-aza-2’-deoxycytidine and Trichostatin treatment
To demethylate methylated CpG sites, SK-OV-3 cells were treated with increasing concentrations (0, 5, 10, and 20 µM) of 5-aza-2’-deoxycytidine (5-aza-dC) (Sigma-Aldrich, St. Louis, MO, USA) for 72 h. For co-treatment with 5-aza-dC and trichostatin (TSA) (Sigma-Aldrich), the cells were treated with 10 µM of 5-aza-dC for 72 h followed by 0.5 µM of TSA for 24 h. Culture medium was replaced daily.
Transient transfection
To establish a transient expression system, SK-OV-3 cells were transfected with pCMV6-SLC6A12 (Origene, Rockville, MD, USA) or pEGFP-N3 (Clontech, Mountain View, CA, USA) plasmids using Lipofectamine 2000 (Invitrogen). Briefly, cells were plated at 6×10⁵ cells/well in 6-well plates and allowed to grow overnight. Two micrograms of each plasmid and 5 µL of Lipofectamine 2000 were diluted in Opti-MEM medium (Gibco/BRL) to a total volume of 250 µL. The plasmid-Lipofectamine 2000 mixture was incubated at room temperature for 20 min. The cells were washed with serum-free McCoy’s 5A medium, the transfection mixture was added to the 6-well plates containing complete growth medium, and plates were incubated at 37℃ for 24 h in a 5% CO2 incubator.
Transwell migration and in vitro invasion assay
After 24 h transfection, complete growth medium was replaced by serum-free medium. The cell migration assay was performed in 24-well transwell plates with 8.0-µm pore size membrane inserts (Corning, New York, NY, USA) whereas the in vitro invasion assay was performed using the BD BioCoat Matrigel Invasion Chamber kit (Becton-Dickinson, Franklin Lakes, NJ, USA) as previously described.9
Meta-analysis
The association between the expression level of SLC6A12 and prognosis in serous-type OC was validated using a recently developed meta-analysis package, curatedOvarianData,10 composed of 2066 expression profiles and clinical data of OC patients from 13 datasets including only serous OC. Cox proportional hazards model was used to determine hazard ratio (HR) for overall survival in each dataset, and univariate meta-analysis was performed using fixed effect model for combining HRs.
We performed methylation analysis of samples from 653 patients with serous OC using The Cancer Genome Atlas (TCGA) datasets with Bioconductor R.11 The methylation profiles were produced on an Infinium HumanMethylation27 BeadChip (Illumina). We obtained clinically annotated data between 1995 and 2010 from 2510 patients with OC who underwent surgery before systemic treatment. All patients subsequently received a platinum-based chemotherapeutic agent. Of 653 patients, only 69 had 5-year survival data; of these, 43 patients were alive at or beyond 5 years and 26 patients had died within the previous 5 years. The patients were followed until August 25, 2010. We identified differences in DNA methylation between patients who were alive more than and less than 5 years. The p values were adjusted using the Benjamini-Hochberg method. To determine differences in methylation, a two-sided Student’s t-test was applied and significance was set at p<0.01. Survival was assessed using the Kaplan-Meier formula based on the methylation pattern of SLC6A12. For fitting survival curves, we used 'survfit' in the R package.12
Statistical analysis
Data are expressed as mean±standard deviation of at least three independent experiments. Statistical analyses were carried out using GraphPad Prism 5 software (GraphPad, La Jolla, CA, USA) and the details of the statistical analysis for each data set are included in the figure legends. p values ≤0.05 were considered statistically significant.
RESULTS
Increased expression of SLC6A12 mRNA in tumor metastases from SK-OV-3-implanted ovarian cancer xenograft mice
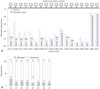
We previously established OC xenograft mice by inoculating in vitro cultured SK-OV-3 human OC cells into the peritoneum of female nude mice to mimic human OC metastasis. We then analyzed expression profiles with microarray to identify DEGs in metastasized SK-OV-3 cells compared to wild-type SK-OV-3 cells.9 SLC6A12 mRNA expression was increased in tumor metastases compared to wild-type SK-OV-3 cells (Fig. 1A). We validated the upregulation of SLC6A12 mRNA expression in tumor metastases using RT-qPCR, and confirmed significantly higher expression (8.1–14.0-fold) in tumor metastases compared to SK-OV-3 cells (Fig. 1B).
DNA hypomethylation of CpG clusters of SLC6A12 in tumor metastases
We performed DNA methylation profiling to investigate the regulatory mechanism of SLC6A12 expression. We compared the profiles of tumor metastases with the profiles of wild-type SK-OV-3 cells using the Illumina HumanMethylation450 Bead-Chip. The Illumina HumanMethylation450 BeadChip contains 18 CpG sites within the promoter region of the SLC6A12 gene, which is located at 322214–324747 of chromosome 12 (human GRCh37/hg19). Among the 18 CpG sites, nine were differentially methylated (|Δβ|>0.2), and all 18 CpGs were hypomethylated in tumor metastases, compared to wild-type SK-OV-3 cells (Fig. 2A). Alternatively, the DNA methylation status of the promoter CpG site at 323242 was determined by qMSP. DNA methylation was significantly decreased (by approximately 41–62%) in all tumor metastases (Fig. 2B).
SLC6A12 expression regulated by epigenetic DNA methylation
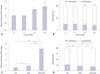
To determine whether expression of SLC6A12 mRNA was epigenetically modulated, we treated SK-OV-3 cells with the DNA methyltransferase inhibitor 5-aza-dC and/or the histone deacetylase inhibitor TSA. The expression of SLC6A12 mRNA was measured by RT-qPCR, and the methylation status of the CpG at 323242 within SLC6A12 was determined by qMSP. After treatment with 5-aza-dC, expression of SLC6A12 mRNA was significantly restored (~1.6-fold) in a dose-dependent manner (Fig. 3A), which occurred concurrently with decreased CpG methylation (Fig. 3B). The combined treatment with 5-aza-dC and TSA was synergistic in restoration of SLC6A12 expression (Fig. 3C) in accordance with reduced DNA methylation at the CpG site (Fig. 3D).
Overexpression of SLC6A12 promotes an aggressive phenotype in ovarian cancer cells
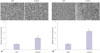
To explore the role of SLC6A12 in metastasis, we investigated whether SLC6A12 was involved in tumor cell migration and invasion. SK-OV-3 cells were transfected with full-length cDNA from SLC6A12A or enhanced green fluorescent (EGF) protein cDNA, and their ability to migrate was tested using an in vitro transwell assay. Cell migration was approximately two-fold higher in the SLC6A12-transfected cells, compared to the EGF-transfected cells (Fig. 4A). Finally, we examined the invasion activity of SK-OV-3 cells overexpressing SLC6A12 using a Matrigelcoated membrane. A significant increase (~3.3-fold) in invasion activity was observed in SK-OV-3 cells overexpressing SLC6A12 (Fig. 4B). These results suggested that overexpression of SLC6A12 contribute to cell migration and invasion of OC cells.
High expression of SLC6A12 associated with poor prognosis in ovarian cancer patients
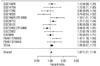
To determine the relationship between the expression of SLC6A12 and overall survival in patients with serous-type OC, we performed meta-analysis using curatedOvarianData, which includes more than 2000 expression profiles and clinical data from OC patients.10 The results of the meta-analysis showed that high expression of SLC6A12 was significantly associated with poor prognosis in serous-type OC patients (Fig. 5). The pooled HR estimate was significantly >1 for overall survival (HR=1.07, p value=0.016), which indicated that a high expression level of SLC6A12 was associated with a higher risk of death.
Methylation status of SLC6A12 correlated with survival of ovarian cancer patients
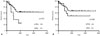
The correlation between methylation status of two CpG sites within SLC6A12 and patient survival was analyzed by Kaplan-Meier curves (Fig. 6). We validated the predictive power of methylation status in independent serous OC TCGA data sets. Of the 653 serous OC patients enrolled in TCGA, we selected 69 patients because the 5-year survival data of the other 584 patients were unavailable. Of two CpG sites at 323242 and 322250 within SLC6A12, the methylation status of the 323242 CpG site was significantly associated (p=0.0267) with overall survival in all validation data sets. Kaplan-Meier survival analysis of this signature showed that overall survival of patients was lower with <6% methylated CpG, compared to patients with ≥6% methylated CpG (Fig. 6A). However, the methylation status of the 322250 CpG site was not statistically significant between two patient groups (Fig. 6B). These results implied that hypomethylation of the 323242 CpG site within SLC6A12 was associated with an increased risk of death in OC patients.
DISCUSSION
Unlike other cancers, metastasis in OC most commonly occurs via the transcoelomic route, which is responsible for the poor prognosis of patients with this disease.2 However, very little is known about the molecular mechanisms behind this process including genetic/epigenetic alterations.
SLC6A12/BGT1, a Na+ and Cl− dependent GABA/betaine acid transporter, is expressed in the brain, liver, and kidneys.5 Although little is known about the physiological function of this transporter protein, its GABAergic properties play important roles in metastasis of breast cancer and prostate cancer.1314 These properties have been linked to Ser/Thr or Tyr kinase signaling pathways, such as ERK1/2 or Src, which imply that an aggressive phenotype could be achieved through increased expression of this GABA/betaine acid transporter protein.
We provide additional evidence of the linkage between SLC6A12/BGT1 expression and aggressive cancer cell phenotype with the meta-analysis of gene expression data from OC patients. We found that the pooled HR estimate was >1 for overall survival, which indicated that the risk of death increased with increased SLC6A12 expression. Specifically, the combined HR per each increment of gene expression was 1.07 (p value=0.029). Most of the HRs for each dataset were >1, which ultimately generated a pooled HR with statistical significance. In fact, meta-analysis is a widely used and statistically proven methodology to combine multiple estimates. For the estimation of each HR in each dataset, we used the Cox regression, rather than the nonparametric log-rank test. Therefore, we did not presume or define any cutoffs or criteria for positive and negative expression, or present the number of deaths. In fact, HR was estimated for overall survival and not for metastasis.
To elucidate the molecular mechanisms in play during metastasis, we previously established a xenograft mouse model of metastatic OC and analyzed transcriptional expression and DNA methylation profiles in tumor metastases.151617 The expression of SLC6A12 was upregulated by more than 8-fold. Concurrently, DNA methylation on the CpG clusters of SLC6A12 was significantly decreased in the tumor metastases, compared to the injected ovarian carcinoma cells. After treatment with a DNA methyltransferase inhibitor and/or histone deacetylase inhibitor, the expression of SLC6A12 was significantly enhanced, which implied that expression of SLC6A12 was regulated by a DNA methylation-dependent epigenetic mechanism. Overexpression of SLC6A12 led to increased migration and invasion of ovarian carcinoma cells in vitro, which suggested that SLC6A12 overexpression may confer metastatic-promoting properties to ovarian carcinoma cells. To validate the clinical association between the expression level or DNA methylation status of SLC6A12 and prognosis in patients with seroustype OC, we performed meta-analysis using publically available gene expression and DNA methylation profiling data, curatedOvarianData, and TCGA data sets. Our results showed that high expression of SLC6A12 was significantly associated with poor prognosis, and the DNA methylation status of specific promoter CpG sites was negatively associated with the overall survival of patients. These data indicated that aberrant overexpression of SLC6A12, which was mediated by DNA methylation-dependent epigenetic regulation, was associated with metastasis of ovarian carcinoma cells, leading to an increased risk of death in OC patients.

 XML Download