

 PDF
PDF ePub
ePub Citation
 Print
Print


INTRODUCTION
Pollen allergy is associated with significant morbidity worldwide. The prevalence of pollen allergy appears to be on the rise due to the impact of climate change.12 The distribution and prevalence of pollen allergy are subject to both geographical and chronological variations. In Australia, pollen from rye grass (Lolium perenne) is the most common sensitizing allergen among all pollen; 56.3% of Australians are sensitive to it.3 Pollen from Gramineae and olive is the most common type of sensitizing pollen in Spain; 79% and 58%, respectively, of the Spanish in Toledo are sensitive to them.4 In addition to these geographic differences, prevalence of pollen allergy undergoes changes with time. In Croatia, grass pollen had been reported as the most common sensitizing agent with a prevalence of 17.9% in 1992. However, weed pollen outnumbered grass pollen in 1997 with a reported prevalence of 29.0%. This was because of an explosive increase in the number of airborne ragweed pollen.5
Awareness of the temporal variation in airborne pollen counts and skin positivity rates in Seoul is invaluable in the management of Korean patients with pollen allergy. Although there are many studies concerning the skin positivity rates in Korea, two studies showed significant changes in skin positivity rates with large-sized sample. The first study reviewed the changes in skin positivity rates over the past 30 years in Korea. The rate of skin positivity to house dust mite, which is the most common indoor allergen, showed no changes over time. However, the rate of skin positivity to tree pollen has significantly increased over the past 30 years. Rates of skin positivity to grass and weed registered a significant decrease in the 2010s compared to the 1990s.678 Another study demonstrated the correlation between pollen counts and skin positivity rates in Busan over a period of 15 years.9 Because the skin positivity rates keep changing geologically and chronologically, up-to-date reports of these changes for each region are essential.
Prior exposure to allergen is an essential prerequisite for an allergic reaction to occur, and the amount of pollen is a key factor for inducing an allergic reaction.101112 However, a direct correlation between pollen count and skin positivity rate is still subject to controversy.13 We assessed the changes in the rate of skin positivity to pollen in Seoul over a 6-year period, and investigated its correlation with the environmental pollen count.
MATERIALS AND METHODS
Participants
A total of 4442 patients treated at the Severance Hospital Allergy-Asthma Clinics in Seoul between January 2008 and December 2013 served as the study subjects. The enrolled subjects had allergic symptoms and wanted to undergo allergic evaluation. They lived almost in Seoul or Gyeonggi-do, a province very close to Seoul. The results of their skin-prick test (SPT) in response to 33 inhalant allergens and their electronic medical records were retrospectively reviewed. This retrospective study was approved by the Institutional Review Board, Severance Hospital, Yonsei University Health System (approval number: 4-2015-0541).
Measurements of airborne pollen count
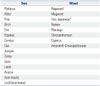
The airborne pollen count was monitored on a daily basis using a Burkard Seven-day recording volumetric spore trap (Burkard Manufacturing Co. Ltd., Hertfordshire, UK) from January 2008 through December 2014. For this purpose, samples were collected by the sampler for 144 minutes each day. The pollens accumulated on the glass stick were stained with Calberla's fuchsin (10 mL glycerin, 20 mL 95% alcohol, 30 mL distilled water, 0.2 mL basic fuchsin), covered with a cover glass, and histomorphometrically analyzed. Tree, grass, and weed pollens were collected from the observational field of the Korean Meteorological Administration in Seoul. The species of collected tree and weed pollen are listed in Table 1. Of note, we could not classify grass pollen into subgroups on the basis of microscopic examination.
Skin-prick test
All subjects underwent a SPT for 33 allergens [alder, birch, oak, elm, pine, ragweed, Humulus japonicus (hop Japanese), walnut, plane tree, willow, mulberry, elder, white ash, acacia, poplar, Bermuda grass, cocksfoot, ryegrass, timothy, meadow grass, sagebrush, dandelion, Chenopodium spp., plantain, Dermatophagoides farinae, Dermatophagoides pteronyssinus, Aspergillus fumigatus, Candida albicans, Alternaria spp., cat hair, dog hair, German cockroach, and American cockroach], which were obtained from 3 companies (Allergopharma, Reinbek, Germany; Hollister-Stier, Spokane, WA, USA; Bencard, London, England).
The SPT was conducted by a well-trained nurse. The standard time-point for recording of the results was 15 minutes after the SPT. A wheal ≥3 mm in size was defined as a "positive" response to a specific pollen. No steroid or antihistaminic drug was administered in the 7-day period immediately prior to the test. Atopy was defined as a positive response in the SPT to any one of the 33 inhalant allergens. We analyzed the correlation between the changes in pollen count and the skin positivity rate, as measured by the SPT, from January 2009 through December 2013.
Statistical analysis
All statistical analyses were performed using SPSS version 18.0 (SPSS Inc., Chicago, IL, USA). A linear trend test within the ANOVA model was used to determine if there was any significant yearly change in the pollen count over the 6 years. Cochran-Mantel-Haenszel statistics were applied to examine if there were any significant yearly changes in the skin positivity rate. The correlation between the rate of change in pollen count and the rate of change in the skin positivity rate was assessed using Pearson's test. The criterion for determining statistical significance was a p-value of <0.05.
RESULTS
Patient demography
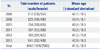
Patient enrollment was evenly distributed over the 6 years (Table 2). The average age (±standard deviation) of the enrolled patients was 41.9±16.3 years. Women comprised 57.7% of the study subjects. The demographics of enrolled subjects did not change over time.
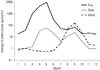
The mean monthly variation in pollen count
Fig. 1 shows the mean monthly variation in pollen counts for tree, grass, and weed for the 6 years (2008–2013). Tree pollen count showed a major peak in May and a minor peak in September. Grass pollen count also showed two peaks, one in May and the other in September, although the total grass pollen count was low. In contrast to tree and grass pollen, weed pollen counts showed only one peak in September (Fig. 1).
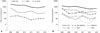
The changes in pollen counts over 6 years
The pollen counts of trees, grasses, and weeds showed yearly variations, but without any statistically significant trend (Fig. 2A). The pollen counts for all species, including pine, oak, birch, hop Japanese, ragweed, and alder, showed yearly variations, but these variations were not statistically significant (Fig. 2B).
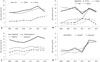
Skin positivity rates in Korea in response to pollen during the 6-year study period
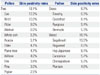
The total rate of atopy, i.e., the percentage of subjects who showed a positive response in the SPT to any one of the 33 inhalant allergens, was 58.3% during the 6 years. The skin positivity rates of each species of tree, grass, and weed are summarized in Table 3.
The overall skin positivity rate in response to pollen showed an increase over the 6-year period. The skin positivity rates in response to pollen from grass and weed showed a significant annual increase (Fig. 3A). Among pollens from trees, the skin positivity rate in response to pollen from walnut and poplar increased significantly over the years (Fig. 3B). Although data are not shown, the skin positivity rates in response to pollen from elm, plane tree, willow, alder, white ash, and acacia significantly increased over the 6 years. However, the skin positivity rates in response to pollen from birch and oak, the major allergens in Korea, did not increase significantly. Among pollens from weeds, the skin positivity rate in response to pollens from dandelion increased significantly (Fig. 3C). Although data are not shown, the skin positivity rates in response to pollen from Chenopodium spp. and plantain increased significantly. However, skin positivity rates in response to pollen from other weeds, including sagebrush, ragweed, and hop Japanese, which are known as important allergens in Korea, showed no significant trend. Among pollens from grasses, the skin positivity rates in response to pollens from timothy, Bermuda grass, and meadow grass significantly increased, whereas those in response to pollens from other grasses, including ryegrass, showed no significant change (Fig. 3D).
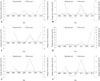
The correlation between changes in pollen counts and changes in skin positivity rates
Because pollen counts and skin positivity rates changed annually, we analyzed the correlation between them. Among pollens from trees, the rate of change in alder pollen count showed a pattern similar to the rate of change in the skin positivity rate, but without statistical significance (Fig. 4A). Both the pollen count for oak and the skin positivity rate in response to it decreased simultaneously from 2009 to 2010, then increased in 2012, again followed by a decrease in 2013. The correlation between the rate of change in skin positivity rate and the rate of change in oak pollen count was statistically significant (Fig. 4B). Birch, elm, and ragweed also showed a similar pattern, but without statistical significance (Fig. 4C, D, and E). For hop Japanese, the rate of change in skin positivity rate and the rate of change in pollen count decreased from 2010 to 2011, then increased in 2012, and again decreased in 2013, similar to the pattern for oak (Fig. 4F). However, other trees and weeds showed no correlation between the rate of change in pollen count and that in skin positivity rate.
DISCUSSION
During the pollination season, anemophilous plants produce small, lightweight pollen grains that may be disseminated by air currents over a large geographical area, sometimes exceeding 100 km. Inhalation of pollen causes allergic sensitization and leads to allergic symptoms. A minimum pollen count of 20–100 grains/m3 is necessary for most types of pollen to exhibit allergenic behavior.14 The allergenic potential of pollen grains depends on certain physical characteristics and airborne behavior, including ease of dispersion, buoyant density, and pollen count. The amount of airborne pollen is also affected by environmental factors such as temperature, humidity, wind speed, accumulated sunshine hours, rainfall, and atmosphere CO2 concentration.15161718 Therefore, geographical and temporal variations in pollen count play an important role in determining the allergenic potential and pattern of occurrence of pollen allergy.
In Korea, it is well known that the pollen count peaks once in spring (from March to June) and then again in autumn (from August to December).19 The majority of the pollen in spring come from trees and that in autumn from weeds. In contrast to the pollen count for trees, the count for grasses shows similar peaks in May and September. The major cause of these two peaks is considered to be the rainfall occurring around July. Additionally, we can assume that these two peaks are due to different species of grasses, although we could not distinguish the species by microscopic analysis. The majority of pollen in September may be from reed and silver grass, which are widely distributed in Korea. Further study is needed to definitively prove this.
The pollen counts for trees, grasses, and weeds showed a yearly change over the 6 years, spanning from 2008 to 2013. In fact, all data regarding pollen counts in Korea have been obtained from the National Institute of Meteorological Research. The institute reported that pollen count does not show any statistically significant trend in Korea (1998–2012).9 We also obtained similar results to previous reports concerning insignificant pattern of pollen count changes. Especially, pollen counts for the major allergens such as oak, birch, alder, ragweed, and hop Japanese showed no significant changes over the 6 years (Fig. 2B).
The overall skin positivity rate increased during the study period. Although the skin positivity rate in response to pollens from trees did not increase significantly, those in response to pollens from grass and weed significantly increased annually during the study period. However, on a closer view, the skin positivity rate in response to major allergens, including birch, oak, mugwort, ragweed, and hop Japanese, showed no significant increase. These patterns of overall increase may be due to the increase of pollen counts or the changes in allergenicity of pollen. This study revealed that the pollen count showed yearly variations during the study period, but without statistical significance. Therefore, follow-up research with a longer study period and analysis of allergenicity is warranted to evaluate if the increase in skin positivity rate was due to long-term changes in pollen counts or due to changes in allergenicity of pollen.
The skin positivity rate in response to pollens from grasses and weeds showed a step-up increment in 2012–2013 compared to 2008–2011. We could not find the causes underlying this rapid increase in the skin positivity rate. Further long-term studies should be conducted to evaluate whether this increase is transient or not. These recent increases in skin positivity rate might have been due to changes in climate, environment, and pollen counts. According to the Korean Forest Service report, the total forest cover has increased over the last 40 years. The extent of forest cover in 2010 was eleven times higher than that in 1973, and registered a 14% increase as compared to the preceding year. Moreover, the distribution of vegetation has been changing due to environmental factors, such as climate changes, amount of rainfall, and levels of CO2. These changes are expected to have effects on the pollen count and also on the skin positivity rate in response to pollen. Therefore, a careful observation of minute changes in plants due to climatic and environmental changes (construction of pastures and parks, afforestation, planting within the stream, etc.) is needed.
In the present study, we demonstrated that the changes in pollen counts and those in skin positivity rate in the same year might be closely associated with each other. In particular, data pertaining to oak and hop Japanese showed a statistically significant correlation between the two. These results are concordant with those of many previous studies that showed that environmental factors affect symptom provocation, sensitization rates and/or disease development.11122021 The observation that there is a significant correlation between the rate of change in pollen counts and the rate of change in skin positivity rate among patients admitted to the institute in the same year, is very significant. Our findings provide an indirect evidence that oak in spring and hop Japanese in autumn are likely to be the major allergens causing allergic symptoms in Korea, the severity of which would be dependent on their pollen counts.
However, overall skin positivity rate in response to pollens from trees, grasses, and weeds found in this study was not in agreement with the results of our earlier study,8 which involved the same study period (2010–2011). In the earlier study, the skin positivity rates in response to pollens from trees, grasses, and weeds were 34.1%, 14.1%, and 28.7%, respectively. We attribute this discrepancy to the difference in inclusion criteria between these two studies: all patients who underwent allergy skin test were included in the present study (1461 cases), whereas only patients with respiratory allergy diseases were included in the previous study (1135 cases).
Our study has some limitations. This study included patients with some allergic symptoms who visited an allergy clinic and underwent the allergy skin prick test, but did not yet have confirmed allergic diseases. We did not look into their allergic diseases in detail. Therefore, a selection bias may exist. Second, we reviewed SPTs conducted at one institute only. Larger multicenter studies and population-based studies conducted on a nationwide scale are warranted.
In conclusion, the pollen counts from trees, grasses, and weeds changed annually during our study period, but without any statistical significance. The mean monthly pollen counts for grasses showed two peaks in a year, similar to total pollen count, even though the pollen count from grasses was low. The skin positivity rates in response to some types of pollen showed an increase over the 6 successive years. A significant correlation between annual rate of change in pollen count and the rate of change in skin positivity rate in the corresponding year was observed in case of oak and hop Japanese. Long-term studies are needed for definitively confirming the correlation between pollen counts and skin positivity rates.
 XML Download