

 PDF
PDF ePub
ePub Citation
 Print
Print


INTRODUCTION
Decompensated cirrhosis (DC) has the clinical features of ascites, variceal hemorrhage (VH), and hepatic encephalopathy caused by complications of portal hypertension (PHT) or jaundice-reflected liver insufficiency.1 The risk of mortality in DC is influenced by the degree of PHT, such that worsening PHT and circulatory failure may induce further development of recurrent VH, refractory ascites, sepsis, or hepatorenal syndrome, and these results can lead to death.2
Both the Child-Turcotte-Pugh (CTP) and the model for end-stage liver disease (MELD) scores have been widely used for evaluating the prognosis of patients with cirrhosis in the real-life clinical practice. The MELD score may more accurately predict survival for cirrhotic patients than the CTP score and has an advantage as a continuous or progressive score of disease severity, which increases with worsening of its parameters.34 However, it cannot fully reflect the prognostic impacts of portal hypertensive complications such as ascites, hepatic encephalopathy or VH in those patients and can be also affected by body fluid status, muscle mass, sex, and age.5678
The increase of portal pressure is closely associated with liver-related complications such as VH, ascites, and death. Therefore, the measurement of hepatic venous pressure gradient (HVPG) is a useful tool to evaluate the severity of cirrhosis and to predict prognosis.9 HVPG measurement is an invasive yet simple and safe procedure. It is also known that HVPG is a strong predictor for survival in patients with cirrhosis.101112 Indeed, HVPG >20 mm Hg in cases of acute VH has a high probability of mortality at 1 year.13 Moreover, HVPG was shown to have an independent role in survival in addition to the MELD score, with each 1-mm Hg increase contributing to a 3% increase in mortality.12
However, the role of HVPG in predicting long-term mortality in patients with DC is controversial. In fact, recent studies comparing HVPG and MELD have shown different results.6141516 However, these results were not classified based on ascites and VH according to D'Amico, et al.17 Recently, a study by Zipprich, et al.14 on survival analysis using HVPG suggested two new stages for decompensated patients, redefining stage 3 as VH without ascites and stage 4 as ascites irrespective to VH.
The present study aimed to investigate the role of HVPG in the prediction of long-term mortality in patients with DC, particularly those with ascites.
MATERIALS AND METHODS
Patients
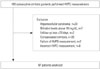
Between November 2009 and December 2012, a total of 169 non-critically-ill patients with DC were retrospectively and consecutively collected at Hanyang University Guri Hospital. All patients had previous histological confirmation of cirrhosis18 or a diagnosis of cirrhosis on the basis of standard clinical, ultrasonographic, and biochemical parameters.1 Non-critically-ill patients were those who had stable hemodynamic parameters, no uncontrolled infection, no acute bleeding for less than 1 month and no active alcohol abuse.19 Exclusion criteria were use of vasoactive drugs, the presence of hepatocellular carcinoma (n=20),20 bilirubin levels above 10 mg/dL (n=7), compensated cirrhosis (n=33), and follow-up loss within 28 days (n=2). Two patients with failed HVPG measurements due to noncooperation and 8 patients with incorrect HVPG measurements were excluded from this study. Ultimately, 97 patients were analyzed (Fig. 1). Follow-up was continued until November 30, 2013. The Hanyang University Guri Hospital Institutional Review Board approved the study (No. 2013-03).
Clinical stages and MELD
Among patients with DC, clinical stage 3 or 4 was diagnosed according to the presence of ascites or portal hypertensive gastrointestinal bleeding.17 Clinical stage 3 was defined as ascites with or without history of VH, and stage 4 was defined as VH with or without ascites. The ascites group (AG) included patients with ascites, namely those with clinical stage 3 (ascites) and a portion of those with stage 4 (both VH and ascites). MELD scores were calculated for each patient on the day of HVPG measurement.
HVPG measurement
After the serum sampling, HVPG measurement was performed on the same day by a radiologist (J.K.) with experience in more than 50 HVPG measurements. Under fluoroscopic guidance, a 6-Fr balloon-tip catheter (Arrow International, Inc., Cleveland, OH, USA) was inserted through a 7-Fr sheath placed in the right internal jugular vein and advanced into the right hepatic vein. Measurement of the free and wedged hepatic venous pressures during balloon deflation and inflation, respectively, was performed using an electronic barometer built into the patient monitoring equipment (Pulscan-combo, Scionic Co., Ltd., Seoul, Korea). The measurements were acquired at a location less than 5 cm from the junction of the right hepatic vein and inferior vena cava (IVC). All measurements were performed in triplicate, and the results were reported as the means of the three measurements. The HVPG was determined by subtraction of the free hepatic venous pressure from the wedged hepatic venous pressure. The pressure in the IVC at the level of hepatic venous drainage was also measured for comparison with the free hepatic venous pressure to evaluate whether the measurement was relevant.
Statistical analysis
Descriptive statistics were produced for demographic, clinical, and laboratory characteristics for this study sample of patients. The evaluation of normality of the distribution of quantitative variables was performed using the Shapiro-Wilk test. Variables with a normal distribution are expressed as mean and standard deviation, and others are expressed as median and interquartile range (IQR). The qualitative variables are presented as number and percentage (%). Means of HVPG measurements were compared according to clinical or subclinical stage using an independent t-test or a one-way analysis of variance with a post-hoc test (Turkey's) as appropriate. According to the duration of the follow-up period, the prognostic accuracies of MELD score and HVPG were analyzed using the means of the area under the receiver operating characteristics curve (AUROC) for the prediction of 1-year, 2-year, and overall mortality, and sensitivity, specificity, and cutoff values were also calculated. Optimal cutoff values to predict overall mortality were chosen to maximize the sum of sensitivity and specificity. Based on these optimal cutoff values, the Kaplan-Meier method was used with the log-rank test to calculate survival. To assess the prognostic predictors of long-term mortality, sex, age, etiology of cirrhosis, history of variceal bleeding, presence of ascites, platelet count, albumin, bilirubin, prothrombin time (international normalized ratio, INR), creatinine, sodium, MELD score, and HVPG variables were used in the Cox regression models, and a hazard ratio (HR) of each independent predictive factor was obtained. Only significant variables were used for backward elimination in a multivariate model. p values <0.05 were considered to be statistically significant. Statistical analysis was performed using SPSS 18.0 (SPSS Inc., IBM Company, Chicago, IL, USA).
RESULTS
Baseline characteristics of patients
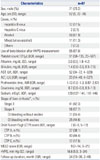
The baseline characteristics of enrolled patients are summarized in Table 1. Shortly, the mean age of patients was 52±9 years, and there was a predominance of males (73.2%). Among 97 patients, 41 (42.3%) had clinical stage 3 DC, and 56 (57.7%) had clinical stage 4, of whom 31 had no ascites and 25 had ascites. Based on CTP score, 37 patients had class A, 43 had class B, and 17 had class C. The median MELD score was 9 (IQR, 7-14), and the mean of HVPG measurements was 16.6±5.9 mm Hg (Table 1).
HVPG measurements according to clinical stage and ascites group vs. non-ascites group
Mean values of HVPG in stage 3 disease were significantly higher than those in stage 4 (18.0±6.3 mm Hg vs. 15.5±5.5 mm Hg; p=0.041) (Fig. 2A). Stage 4 was divided according to the presence of ascites, and the mean values of HVPG in stage 3, stage 4 without ascites, and stage 4 with ascites were 18.0±6.3, 14.5±5.7, and 16.8±5.1 mm Hg, respectively (p=0.040). Particularly, the mean HVPG values of stage 3 patients were significantly higher than those of stage 4 patients without ascites (p=0.031) (Fig. 2B). According to the presence of ascites in DC, the mean values of HVPG in AG were significantly higher than those in the non-ascites group (NAG) (17.6±5.9 mm Hg vs. 14.5±5.7 mm Hg; p=0.015) (Fig. 2C).
HVPG and MELD in predicting 1-year, 2-year, and overall mortality
During a median follow-up period of 24 (IQR, 13-36; range, 2-48) months, 22 of 97 patients (22.7%) died. The causes of death were hepatorenal syndrome (n=8), VH (n=4), hepatic encephalopathy (n=8), ischemic enteropathy (n=1), and cerebral hemorrhage (n=1).
The AUROCs of HVPG for predicting 1-year, 2-year, and overall mortality were 0.801, 0.737, and 0.687, respectively (all p<0.01) (Table 2); those of MELD scores for predicting 1-year, 2-year, and overall mortality were 0.827, 0.736, and 0.725, respectively (all p<0.01), and the differences between HVPG and MELD scores were not statistically significant (p=0.824, 0.993, and 0.635, respectively). The best cut-off value of HVPG for predicting long-term overall mortality in all patients with DC was 17 mm Hg (Table 2A).
In the AG, the AUROCs of HVPG for predicting 1-year, 2-year, and overall mortality were 0.749, 0.685, and 0.680, respectively (all p<0.01) (Table 2B). However, in the NAG, the AUROCs of HVPG for long-term overall mortality were not significant.
Survival analysis in decompensated cirrhosis
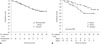
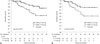
The mortality rates of patients with DC at 1 and 2 years were 8.9% and 19.2%, respectively (Fig. 3A). According to clinical stage, the mortality rates at 1 and 2 years were 15.7% and 28.7% for stage 3 and 4.9% and 12.9% for stage 4, respectively (p=0.091) (Fig. 3B). In addition, the difference of mortality rates between AG and NAG was not significant (p=0.201; data not shown).
However, the mortality rates at 1 and 2 years were significantly different according to the level of HVPG: 1.9% and 11.9% with HVPG ≤17 mm Hg and 16.2% and 29.4% with HVPG >17 mm Hg, respectively (p=0.015) (Fig. 4A). In addition, the differences in 1- and 2-year mortality rates were significant in the AG: 3.9% and 17.6% with HVPG ≤17 mm Hg and 17.5% and 35.2% with HVPG >17 mm Hg, respectively (p=0.044) (Fig. 4B). However, the differences in mortality rates between HVPG levels higher and lower than 17 mm Hg were not significant in patients with NAG (p=0.209).
Predictors of long-term mortality in decompensated cirrhosis
In the univariate analysis for patients with DC who died, serum albumin (p=0.007), bilirubin (p=0.024), INR (p=0.001), sodium (p=0.012), HVPG (p=0.006), and MELD score (p<0.001) were significantly related with long-term mortality. In a multivariate analysis using the Cox regression model, only HVPG [HR, 1.079; 95% confidence interval (CI), 1.001-1.163; p=0.046] and MELD score (HR, 1.279; 95% CI, 1.099-1.488; p=0.001) were significantly related (Table 3). In the subgroup analysis, the factors associated with long-term mortality in the AG were serum albumin (p=0.040), INR (p=0.019), HVPG (p=0.025), and MELD score (p=0.017). In the multivariate analysis, only INR (0.1 unit per increase; HR, 1.146; 95% CI, 1.011-1.298; p=0.033) and HVPG (HR, 1.078; 95% CI, 1.003-1.159; p=0.042) were independent risk factors for predicting poor long-term survival (Table 4).
DISCUSSION
Clinically, DC is defined as a condition in which complications of PHT or liver insufficiency are presented.2 In this study, HVPG values were closely associated with long-term mortality (AUROC=0.687) and were valuable in predicting 1- or 2-year mortality in patients with clinical DC.
HVPG in chronic liver disease is well known as having a role in the evaluation of fibrosis in chronic hepatitis, the stratification of patients with cirrhosis, and the response to therapy for PHT.2 According to a meta-analysis, a good hemodynamic response, defined by a decrease in HVPG of at least 20% from baseline or to ≤12 mm Hg, reduced episodes of variceal bleeding and complications such as ascites and spontaneous bacterial peritonitis and was also associated with low mortality.2122 However, the role of HVPG in DC is controversial, particularly in predicting long-term mortality. HVPG values in DC are almost all above 12 mm Hg in view of PHT, and the subclassification of DC according to the level of PHT or HVPG is not well defined. Our study showed that both long-term mortality and the mean values of HVPG in stage 3 DC were higher than those in stage 4. In the same way, the AG had higher levels of HVPG than the NAG. Similarly, the long-term mortality rates in patients with DC and ascites were significantly related to the levels of HVPG though not related to clinical stages 3 and 4. However, the clinical stage could not correctly predict higher long-term mortality, particularly in patients with stage 4. These results of the present study suggested that measurement of HVPG is more useful for predicting long-term mortality of cirrhotic patients, even in the state of DC. However, these findings should not be applied to critically-ill patients with DC, as HVPG was only measured in non-critically-ill patients in this study.
In clinical practice, the MELD score is widely used to evaluate the prognosis of patients with cirrhosis, while the use of HVPG is limited. Furthermore, comparison studies between HVPG and MELD score in patients with DC showed different results in the ability to predict long-term mortality.6141516 Suk, et al.15 suggested that HVPG in predicting mortality may be more useful than MELD, while other authors showed no additional effect of HVPG on MELD score.1416 Our study showed that the discriminative ability of HVPG to predict 1-year, 2-year, and overall mortality was useful, although it was not significantly different from that of the MELD score.
The 1-year mortality rate in DC varies 10-30% after the development of ascites, variceal bleeding, or ascites and hemorrhage.2 This study showed 1- and 2-year morality rates of 8.9% and 19.2%, respectively. These somewhat lower rates of long-term mortality might have been affected by selection bias, as we excluded critically-ill patients from enrollment. Of note, there was no significant difference in long-term mortality rates between clinical stage 3 (ascites) and 4 (VH±ascites; p=0.091).21 Although there may have been selection bias, the presence of ascites tended to be associated with a poorer outcome. This point was consistent with the results of Zipprich, et al.;14 however, our study showed that HVPG as well as MELD score contributed to the independent risk of death in all non-critically-ill patients with DC, though in the subgroup analysis of the AG, both INR and HVPG (and not MELD score) were independent risk factors for predicting poor long-term survival. A possible explanation of this result is that it was likely due to selection bias such that the study subjects in the AG had an almost normal range of serum bilirubin (1.4; IQR, 0.6-3.0) and creatinine (0.7; IQR, 0.6-0.8), indicating that the MELD score was mainly determined by INR in this group. It is well known that factors related to long-term mortality are positively associated with the degree of PHT and liver dysfunction. These findings of our study also confirmed that HVPG values had valuable information in predicting long-term mortality in patients with clinical DC or ascites.
Higher HVPG values were an independent risk factor of survival, such that each 1-mm Hg increase in HVPG resulted in a 3% increase in death risk.12 Several studies have found that HVPG values above 16 mm Hg or 18 mm Hg are an important predictor of poor outcome in DC.2615 In these studies, determining the prognostic value of HVPG was performed at the time of the first manifestation of decompensation. Similarly, we found that an HVPG of 17 mm Hg was the best discriminative cutoff value for the prediction of long-term mortality risk in patients with DC.
There were several limitations in this study. First, the study was performed in a single center with a relatively small number of patients who were not critically ill at the time of enrollment. Additionally, the follow-up period was not long, and the causes of cirrhosis were heterogeneous with most cases due to alcohol, restricting its application to other less common causes. Another limitation was that this study only considered the role of HVPG in all-cause mortality, not the prediction of other major complications. To overcome these limitations, long-term prospective multi-centered studies are needed.
In conclusion, this study showed that HVPG is useful in predicting long-term mortality in patients with DC, particularly in the presence of ascites. Although HVPG was not superior to MELD score, it was proven to be an independent predictor of mortality. In addition, it was noted that there was no significant difference in mortality between clinical stages 3 and 4. To confirm these findings, a large, long-term, prospective multi-centered clinical study is needed.


 XML Download