Journal List > Yonsei Med J > v.49(6) > 1030402

Lee, Koh, Nam, Jung, Sung, Kim, Shin, Shin, and Chung: Short Insulin Tolerance Test Can Determine the Effects of Thiazolidinediones Treatment in Type 2 Diabetes

Abstract

Purpose

The short insulin tolerance test is a simple and reliable method of estimating insulin sensitivity. This study was designed to compare the insulin sensitizing effects of thiazolidinediones (TZDs) on the degree of insulin resistance, determined by a short insulin tolerance test (Kitt) in type 2 diabetic patients.

Patients and Methods

Eighty-three subjects (mean age = 57.87 ± 10.78) with type 2 diabetes mellitus were enrolled and received daily one dose of rosiglitazone (4 mg) or pioglitazone (15 mg). The mean follow-up duration was 25.39 ± 9.66 months. We assessed insulin sensitivity using HOMA-IR and the short insulin tolerance test before and after TZDs treatment.

Results

When we compared patients' characteristics before and after TZDs treatment, the mean fasting glucose level was significantly decreased (183.27 ± 55.04 to 137.35 ± 36.42 mg/dL, p < 0.001) and the mean HbA1C level was significantly decreased (9.24 ± 1.96 to 8.11 ± 1.39%, p < 0.001). Also, Kitt values were significantly increased (2.03 ± 1.14 to 2.67 ± 0.97%/min, p = 0.003), whereas HOMA-IR was significantly decreased (2.98 ± 0.68 to 1.04 ± 0.24, p < 0.05). When classifying insulin resistance by Kitt values, insulin resistant subjects' values were increased (< 2.5 %/min; 1.51 ± 0.53%/min to 2.63 ± 0.88, p < 0.001), whereas the values decreased in insulin sensitive subjects (≥ 2.5%/min; 3.50 ± 0.75%/min to 2.75 ± 1.12%/min, p = 0.002).

Conclusion

The glucose lowering effects of TZDs by improving insulin resistance could be determined by using Kitt. However, Kitt may be a beneficial tool to determine TZDs' effects only when patients' Kitt values are less than 2.5%/min.

INTRODUCTION

Insulin resistance is the main pathologic mechanism of type 2 diabetes mellitus and cardiovascular disease.1-3 For evaluation of insulin sensitivity, the euglycemic hyperinsulinemic clamp is the gold standard method in both animal and human.4 However, this technique is very difficult and complex and has been replaced by other simple and rapid methods such as the Homeostatic Model Assessment (HOMA) and the short insulin tolerance test (Kitt).5 Kitt was shown to have a close correlation with glucose clamp studies and could be suitable for estimating insulin sensitivity over a long period.6
Thiazolidinediones (TZDs) are a more recently discovered antidiabetic agents thought to increase peripheral glucose utilization or inhibit hepatic gluconeogenesis by binding the nuclear peroxisome proliferators-activated receptors gamma (PPAR-γ).7-9 The beneficial effects of TZDs on glycemic control by improving the insulin resistance in type 2 diabetic patients are already known, but no data are available to determine the effects of TZDs by Kitt.10,11
In this study, we investigated the insulin sensitizing effects of TZDs in Korean type 2 diabetic patients by using Kitt.

PATIENTS AND METHODS

Subjects

Eighty-three subjects (mean age = 57.87 ± 10.78) who visited the diabetes clinic at Wonju Christian Hospital, South Korea from January 2004 to December 2006 were enrolled. Patients with type 2 diabetes who were inadequately treated with sulfonylurea or metformin (glimepiride, 50/83; gliclazide, 15/83; metformin, 18/83) were included in this study. Patients daily received either 4 mg of rosiglitazone or 15 mg of pioglitazone in a single dose regimen (rosiglitazone, 60/83; pioglitazone, 23/83), and medication was not changed throughout the study. Mean follow-up duration was 25.39 ± 9.66 months.

Assessment of insulin resistance

Insulin resistance was evaluated by means of Kitt and HOMA-IR. Insulin resistance was determined in all subjects at baseline and after 2 years. Plasma glucose disposal rate (Kitt; %/min) was calculated as previously described6: Kitt was the ratio between 0.693 and t1/2, where t1/2 is the time necessary to reduce the basal glucose level by one half. The t1/2 value was calculated from the slope of least square analysis of the glycemic concentrations, starting at the 3rd minute until the 15th minute after intravenous regular insulin injection (0.1 U/kg). We set our definition of insulin resistant state as a Kitt value below 2.5%/min, according to a previous study.12 HOMA-IR was calculated using fasting serum insulin (pmol/L) and fasting plasma glucose (mmol/L; fasting insulin fasting glucose ÷ 22.5).13

Clinical and biochemical measurements

Height, weight, waist circumference, hip circumference, waist-hip ratio (WHR), and body mass index (BMI) were measured in all subjects. BMI was calculated as weight divided by height squared (kg/m2). Waist circumference was measured with soft tape at midway between the lowest rib and the iliac crest. The hip circumference was measured at the widest part of the gluteus region. The waist-to-hip ratio was then calculated. Systolic and diastolic blood pressure (SBP and DBP) was taken after 5 minutes rest and cessation of smoking by an automatic sphygmomanometer. Blood samples for fasting glucose, fasting insulin (RIA, Cobra II, Packard, MI, USA), HbA1C (high performance liquid chromatography, variant II, Bio-Rad, Richmond, CA, USA), total cholesterol (TBA-200FR, Hitachi 7170, Tokyo, Japan), triglyceride, high-density lipoprotein cholesterol, and low-density lipoprotein cholesterol were collected after more than 10 hours of overnight fasting.

Statistical analysis

Data are expressed as means ± standard deviations unless stated otherwise. We used the Student's t test to compare characteristics between men and women and the values between insulin resistance and insulin sensitive states, as defined by Kitt. Paired t-test was used to compare values obtained before and after TZDs administration. A chi-square test was performed to validate differences in insulin resistance when variables were stratified. Pearson's correlation coefficient was used to establish the association between Kitt and clinical and laboratory parameters of subjects. All analyses were performed using the Windows-based SPSS statistical package (ver. 12.0, Chicago, IL, USA), and p < 0.05 were considered significant.

RESULTS

Clinical and biochemical characteristics of subjects

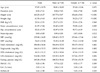
The main characteristics of study subjects are shown in Table 1. Male subjects were characterized by greater weight, waist circumference, waist-hip-ratio, and lower HDL cholesterol levels. Average BMI was 23.16 ± 2.51 kg/m2 (males 23.17 ± 2.51 kg/m2, females 23.14 ± 2.56 kg/m2), and waist circumference was 81.97 ± 7.04 cm (males 83.49 ± 6.90 cm, females 78.98 ± 6.43). Insulin sensitivity markers were not different between males and females.

Parameter changes

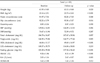
Subjects showed improved glycemic control after the addition of TZDs to their oral hypoglycemic drugs. As shown in Table 2, there were significant changes in fasting glucose (183.28 ± 55.04 mg/dL to 137.34 ± 36.4 mg/dL, p < 0.001) and HbA1C levels (9.24 ± 1.96% to 8.11 ± 1.39%, p < 0.001) after 2-year treatment with TZDs. Both body weight and BMI were significantly increased when compared with baseline values. Also, both waist and hip circumference increased significantly. No significant changes were observed in total cholesterol, LDL-cholesterol, and triglyceride levels. However, HDL-cholesterol levels significantly increased at 24 months when compared with baseline values (44.04 ± 11.17 mg/dL to 49.69 ± 14.97 mg/dL, p < 0.001; Table 2).
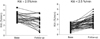
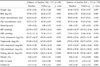
TZDs-induced improvement in insulin sensitivity measured by both Kitt and HOMA-IR was statistically significant (2.03 ± 1.14%/min to 2.67 ± 0.97%/min, p = 0.003 and 3.62 ± 2.98 to 1.61 ± 1.04, p = 0.012; Table 2). When the subjects were divided into insulin sensitive and resistant groups by baseline Kitt values, the changes of fasting glucose, HbA1C, and lipid profile were consistent with total subjects (Table 3). However, Kitt values were increased in insulin resistant subjects (1.51 ± 0.53%/min to 2.63 ± 0.88, p < 0.001) and decreased in insulin sensitive subjects (3.50 ± 0.75%/min to 2.75 ± 1.12%/min, p = 0.002; Table 3 and Fig. 1). In contrast, HOMA-IR was significantly decreased in both insulin resistance and sensitive subjects, defined by baseline Kitt values (Table 2).

DISCUSSION

It is well known that TZDs were efficacious in improving glycemic control and reducing HbA1C by insulin sensitizing action on muscle, adipose tissue, and liver.10,11,14-17 Our data showed that TZDs treatment improved insulin sensitivity approved by both Kitt and HOMA-IR methods in type 2 diabetic patients who had been inadequately treated with sulfonylurea or metformin.
It was reported that metformin or sulfonylurea combined with either pioglitazone or rosiglitazone significantly improve glycemic control.18,19 However, the combination of metformin or sulfonylurea with pioglitazone is associated with significant improvement in lipid and lipoprotein levels, whereas the rosiglitazone combination does not show a significant effect on lipid metabolism. In this study, we did not compare the effects between pioglitazone and rosiglitazone. However, fasting glucose and HbA1C levels were significantly improved, and lipid profiles except for HDL cholesterol levels were not changed after treatment with both pioglitazone and rosiglitazone compared with baseline values. We think that TZDs' effects on lipid metabolism should further be assessed in prospective trials.
Although several studies have provided strong evidence that TZDs may improve β-cell function,20-22 the major effects of TZDs are mediated via their insulin sensitizing effects on muscle and liver by binding to PPAR-γ.7,8,14-17 Previously, the insulin sensitizing effects of TZDs have been assessed by either euglycemic hyperinsulinemic clamp16,23-25 or HOMA index.18,19,26,27 Although the euglycemic hyperinsulinemic clamp is often referred to as the gold standard test, this technique is time-consuming and difficult to perform.28 Consequently, various simpler methods similar to the euglycemic hyperinsulinemic clamp method have been proposed in recent years. HOMA-IR is easily calculated from fasting glucose and insulin concentration, and relates closely with euglycemic hyperinsulinemic clamp.13,29 However, because insulin secretion is pulsatile and HOMA-IR is not a dynamic test, a single sample needs to be carefully interpreted.30 On the other hand, Kitt is a reproducible, inexpensive, and rapid method, allowing easy measurement of insulin sensitivity.5,6,31-33 In this study, we performed HOMA-IR and Kitt to estimate insulin sensitivity. As expected, both measurements for insulin sensitivity were improved after TZDs treatments. However, when we performed subgroup analysis with baseline Kitt values, Kitt values decreased in patients who showed Kitt values above 2.5%/min at baseline, while fasting glucose and HbA1C levels improved consistently in all subjects. HOMA-IR was equally improved regardless of baseline Kitt values. We could not exactly explain the reason of why Kitt values were not consistently changed by the treatment of TZDs. Nevertheless, we speculate various possibilities. First, Kitt may fail to estimate insulin sensitivity in insulin sensitive subjects. The amount of insulin used for Kitt (0.1 U/kg) is a supraphysiological dose and suppresses hepatic gluconeogenesis.31 After insulin injection during Kitt measurement, disappearance of glucose is mainly due to glucose uptake by muscles or adipose tissue. Consequently, Kitt may possibly underestimate the insulin sensitivity when patients have hepatic insulin resistance or show weak insulin resistance. In our study, insulin sensitivity may be improved in insulin sensitive subjects (Kitt > 2.5%/min) in a manner similar to insulin resistant subjects, although Kitt values did not change because of this reason. Second, TZDs may affect glycemic control in insulin sensitive subjects by an another mechanism rather than recovery of insulin resistance. It is well known that both beta cell function and insulin action are lessened in chronic hyperglycemic states34,35 and reversed by improved glycemic control.36,37 As mentioned above, since TZDs have an additional effect of preserving β-cell function,20-22 TZDs may improve the glycemic control by improving glucose toxicity even if Kitt values did not improve. Therefore, it is highly likely that the Kitt rate did not improve when the baseline was above 2.5%/min. However, it is highly desirable to perform clamp studies to clarify why Kitt is not consistently changed, and this is the limitation of the study.
In conclusion, Kitt could be a reliable method to estimate the insulin sensitizing effects of TZDs when Kitt values are less than 2.5%/min.

Figures and Tables

Fig. 1
The changes of Kitt values according to insulin resistant status defined by baseline Kitt values. Kitt values were significantly improved in subjects with insulin resistance. However, the Kitt values did not improve in subjects without insulin resistance.
ymj-49-901-g001
Table 1
Clinical and Biochemical Characteristics of Subjects
ymj-49-901-i001

BMI, body mass index; SBP, systolic blood pressure; DBP, diastolic blood pressure; HDL, high density lipoprotein; LDL, low density lipoprotein; Kitt, rate constant for glucose disappearance in the insulin tolerance test; HOMA-IR, homeostasis assessment method for insulin resistance.

Values are presented as mean ± standard deviation.

Table 2
Anthropometric Data and Biochemical Characteristics at both Baseline and Follow-up
ymj-49-901-i002

BMI, body mass index; SBP, systolic blood pressure; DBP, diastolic blood pressure; HDL, high density lipoprotein; LDL, low density lipoprotein; Kitt, rate constant for glucose disappearance in the insulin tolerance test; HOMA-IR, homeostasis assessment method for insulin resistance.

Values are presented as mean ± standard deviation.

Table 3
Parameter Changes according to Insulin Resistance as Defined by Baseline Kitt Values
ymj-49-901-i003

BMI, body mass index; SBP, systolic blood pressure; DBP, diastolic blood pressure; HDL, high density lipoprotein; LDL, low density lipoprotein; Kitt, rate constant for glucose disappearance in the insulin tolerance test; HOMA-IR, homeostasis assessment method for insulin resistance.

Values are presented as mean ± standard deviation.

References

1. Lempiäinen P, Mykkänen L, Pyörälä K, Laakso M, Kuusisto J. Insulin resistance syndrome predicts coronary heart disease events in elderly nondiabetic men. Circulation. 1999. 100:123–128.
crossref
2. Howard G, O'Leary DH, Zaccaro D, Haffner S, Rewers M, Hamman R, et al. Insulin sensitivity and atherosclerosis. The Insulin Resistance Atherosclerosis Study (IRAS) Investigators. Circulation. 1996. 93:1809–1817.
3. Haffner SM, D'Agostino R Jr, Mykkänen L, Tracy R, Howard B, Rewers M, et al. Insulin sensitivity in subjects with type 2 diabetes. Relationship to cardiovascular risk factors: the Insulin Resistance Atherosclerosis Study. Diabetes Care. 1999. 22:562–568.
crossref
4. Morris AD, Ueda S, Petrie JR, Connell JM, Elliott HL, Donnelly R. The euglycaemic hyperinsulinaemic clamp: an evaluation of current methodology. Clin Exp Pharmacol Physiol. 1997. 24:513–518.
crossref
5. Inchiostro S. Measurement of insulin sensitivity in Type 2 diabetes mellitus: comparison between KITT and HOMA-%S indices and evaluation of their relationship with the components of the insulin resistance syndrome. Diabet Med. 2005. 22:39–44.
6. Bonora E, Moghetti P, Zancanaro C, Cigolini M, Querena M, Cacciatori V, et al. Estimates of in vivo insulin action in man: comparison of insulin tolerance tests with euglycemic and hyperglycemic glucose clamp studies. J Clin Endocrinol Metab. 1989. 68:374–378.
crossref
7. Lehmann JM, Moore LB, Smith-Oliver TA, Wilkison WO, Willson TM, Kliewer SA. An antidiabetic thiazolidinedione is a high affinity ligand for peroxisome proliferator-activated receptor gamma (PPAR gamma). J Biol Chem. 1995. 270:12953–12956.
crossref
8. Willson TM, Cobb JE, Cowan DJ, Wiethe RW, Correa ID, Prakash SR, et al. The structure-activity relationship between peroxisome proliferator-activated receptor gamma agonism and the antihyperglycemic activity of thiazolidinediones. J Med Chem. 1996. 39:665–668.
crossref
9. Oberfield JL, Collins JL, Holmes CP, Goreham DM, Cooper JP, Cobb JE, et al. A peroxisome proliferator-activated receptor gamma ligand inhibits adipocyte differentiation. Proc Natl Acad Sci U S A. 1999. 96:6102–6106.
crossref
10. Park KS, Ciaraldi TP, Lindgren K, Abrams-Carter L, Mudaliar S, Nikoulina SE, et al. Troglitazone effects on gene expression in human skeletal muscle of type II diabetes involve up-regulation of peroxisome proliferator-activated receptor-gamma. J Clin Endocrinol Metab. 1998. 83:2830–2835.
crossref
11. Mudaliar S, Henry RR. New oral therapies for type 2 diabetes mellitus: The glitazones or insulin sensitizers. Annu Rev Med. 2001. 52:239–257.
crossref
12. Park SW, Yun YS, Ahn CW, Nam JH, Kwon SH, Song MK, et al. Short insulin tolerance test (SITT) for the determination of in vivo insulin sensitivity-a comparison with euglycemic clamp test. J Korean Diabetes Assoc. 1998. 22:199–208.
13. Matthews DR, Hosker JP, Rudenski AS, Naylor BA, Treacher DF, Turner RC. Homeostasis model assessment: insulin resistance and beta-cell function from fasting plasma glucose and insulin concentrations in man. Diabetologia. 1985. 28:412–419.
crossref
14. Norris AW, Chen L, Fisher SJ, Szanto I, Ristow M, Jozsi AC, et al. Muscle-specific PPARgamma-deficient mice develop increased adiposity and insulin resistance but respond to thiazolidinediones. J Clin Invest. 2003. 112:608–618.
crossref
15. Miyazaki Y, Matsuda M, De Fronzo RA. Dose-response effect of pioglitazone on insulin sensitivity and insulin secretion in type 2 diabetes. Diabetes Care. 2002. 25:517–523.
crossref
16. Miyazaki Y, Mahankali A, Matsuda M, Glass L, Mahankali S, Ferrannini E, et al. Improved glycemic control and enhanced insulin sensitivity in type 2 diabetic subjects treated with pioglitazone. Diabetes Care. 2001. 24:710–719.
crossref
17. Mayerson AB, Hundal RS, Dufour S, Lebon V, Befroy D, Cline GW, et al. The effects of rosiglitazone on insulin sensitivity, lipolysis, and hepatic and skeletal muscle triglyceride content in patients with type 2 diabetes. Diabetes. 2002. 51:797–802.
crossref
18. Derosa G, D'Angelo A, Ragonesi PD, Ciccarelli L, Piccinni MN, Pricolo F, et al. Metformin-pioglitazone and metformin-rosiglitazone effects on non-conventional cardiovascular risk factors plasma level in type 2 diabetic patients with metabolic syndrome. J Clin Pharm Ther. 2006. 31:375–383.
crossref
19. Derosa G, Cicero AF, Gaddi A, Ragonesi PD, Fogari E, Bertone G, et al. Metabolic effects of pioglitazone and rosiglitazone in patients with diabetes and metabolic syndrome treated with glimepiride: a twelve-month, multicenter, double-blind, randomized, controlled, parallel-group trial. Clin Ther. 2004. 26:744–754.
crossref
20. Gastaldelli A, Ferrannini E, Miyazaki Y, Matsuda M, Mari A, De Fronzo RA. Thiazolidinediones improve beta-cell function in type 2 diabetic patients. Am J Physiol Endocrinol Metab. 2007. 292:E871–E883.
21. Matsui J, Terauchi Y, Kubota N, Takamoto I, Eto K, Yamashita T, et al. Pioglitazone reduces islet triglyceride content and restores impaired glucose-stimulated insulin secretion in heterozygous peroxisome proliferator-activated receptor-gamma-deficient mice on a high-fat diet. Diabetes. 2004. 53:2844–2854.
crossref
22. Shimabukuro M, Zhou YT, Lee Y, Unger RH. Troglitazone lowers islet fat and restores beta cell function of Zucker diabetic fatty rats. J Biol Chem. 1998. 273:3547–3550.
crossref
23. Gastaldelli A, Miyazaki Y, Mahankali A, Berria R, Pettiti M, Buzzigoli E, et al. The effect of pioglitazone on the liver: role of adiponectin. Diabetes Care. 2006. 29:2275–2281.
24. Yu JG, Javorschi S, Hevener AL, Kruszynska YT, Norman RA, Sinha M, et al. The effect of thiazolidinediones on plasma adiponectin levels in normal, obese, and type 2 diabetic subjects. Diabetes. 2002. 51:2968–2974.
crossref
25. Miyazaki Y, He H, Mandarino LJ, DeFronzo RA. Rosiglitazone improves downstream insulin receptor signaling in type 2 diabetic patients. Diabetes. 2003. 52:1943–1950.
crossref
26. Osei K, Gaillard T, Schuster D. Thiazolidinediones increase hepatic insulin extraction in African Americans with impaired glucose tolerance and type 2 diabetes mellitus. A pilot study of rosiglitazone. Metabolism. 2007. 56:24–29.
crossref
27. Jones TA, Sautter M, Van Gaal LF, Jones NP. Addition of rosiglitazone to metformin is most effective in obese, insulin-resistant patients with type 2 diabetes. Diabetes Obes Metab. 2003. 5:163–170.
crossref
28. Radikova Z. Assessment of insulin sensitivity/resistance in epidemiological studies. Endocr Regul. 2003. 37:189–194.
29. Matsuhisa M, Yamasaki Y, Emoto M, Shimabukuro M, Ueda S, Funahashi T, et al. A novel index of insulin resistance determined from the homeostasis model assessment index and adiponectin levels in Japanese subjects. Diabetes Res Clin Pract. 2007. 77:151–154.
crossref
30. Wallace TM, Levy JC, Matthews DR. Use and abuse of HOMA modeling. Diabetes Care. 2004. 27:1487–1495.
crossref
31. Akinmokun A, Selby PL, Ramaiya K, Alberti KG. The short insulin tolerance test for determination of insulin sensitivity: a comparison with the euglycaemic clamp. Diabet Med. 1992. 9:432–437.
crossref
32. Hirst S, Phillips DI, Vines SK, Clark PM, Hales CN. Reproducibility of the short insulin tolerance test. Diabet Med. 1993. 10:839–842.
crossref
33. Grulet H, Durlach V, Hecart AC, Gross A, Leutenegger M. Study of the rate of early glucose disappearance following insulin injection: insulin sensitivity index. Diabetes Res Clin Pract. 1993. 20:201–207.
crossref
34. Robertson RP, Zhang HJ, Pyzdrowski KL, Walseth TF. Preservation of insulin mRNA levels and insulin secretion in HIT cells by avoidance of chronic exposure to high glucose concentrations. J Clin Invest. 1992. 90:320–325.
crossref
35. Boden G, Ruiz J, Kim CJ, Chen X. Effects of prolonged glucose infusion on insulin secretion, clearance, and action in normal subjects. Am J Physiol. 1996. 270:E251–E258.
crossref
36. Andrews WJ, Vasquez B, Nagulesparan M, Klimes I, Foley J, Unger R, et al. Insulin therapy in obese, non-insulin-dependent diabetes induces improvements in insulin action and secretion that are maintained for two weeks after insulin withdrawal. Diabetes. 1984. 33:634–642.
crossref
37. Garver WT, Olefsky JM, Griffin J, Hamman RF, Kolterman OG. The effect of insulin treatment on insulin secretion and insulin action in type II diabetes mellitus. Diabetes. 1985. 34:222–234.
crossref
TOOLS
Similar articles