

 PDF
PDF ePub
ePub Citation
 Print
Print


INTRODUCTION
The measurement of stress helps clarify problems and make appropriate treatment plans, and it also helps to evaluate the efficacy of treatment.1 Recently, cognitive processes (eg, appraisal, coping) and emotional states (eg, anxiety, depression) have been noted as essential in the definition of stress.2 Preexisiting stress measures, however, do not include cognitive responses as often as emotional, somatic, and behavioral responses.
The efficiency of cognitive function decreases under stress. In particular, severe stress or chronic stress leads to the overall reduction of intellectual functioning which includes cognitive distortions, misinterpretation of situations, unproductive or ineffective thought patterns, and indecisiveness. However, the interrelatedness of cognitive function and stress makes it difficult to find out what kind of cognitive symptoms are stress responses.1 Beck3 observed the tendency for making onesided and extreme judgments by those who are vulnerable to stress. This tendency may be explained by the individual's personality or by the stress. The importance is that regardless of the reason, these cognitive tendencies are more likely to occur in conjunction with other stress responses.1
Of all the aspects of the stress responses, the cognitive components are probably the most difficult to define and measure. Part of this difficulty arises from the muddle described earlier among cognitions as part of the stressors, cognitions as part of the stress responses, and cognitions as part of the coping process.1 Schwartz4 has pointed out that the word 'cognition' is used to mean any of a response class composed of private events, mediators of behavior, and the complex structures that organize and generate behavior. The word 'cognition' can be used in a variety of ways, but Cotton1 limited the role of cognitions as stressors to those cognitions involved in the process of appraisal - that is, cognitive interpretations of events which are labeled as 'stressful'. Cognitions which follow a stressful event are assumed to be part of the stress responses; cognitions which reinterprete the experience are part of the coping process. In this study, cognition following a stressful event was considered as a cognitive response.
It is recommended that patients record their cognitive response over a period of time to discover the negative cognitive responses, that is, their cognitive distortions. But the need for measurement is brought up for some of the following reasons; first, some patients who are lacking in verbal expression find difficulty in discovering their distorted cognitive responses. Second, interviews and the patients' own records are not sufficient to document cognitive change over the course of time.5
The preexisitning tools to measure cognitive responses include the Automatic Thoughts Questionnaire (ATQ),6 Social Anxiety Thoughts Questionnaire (SATQ),7 and the Meta-Cognitions Questionnaire (MCQ)8 for college students. Also available are the Cognition Checklist (CC),9 and the Negative Thoughts in Response to Pain (NTRP).10 The ATQ is an instrument that measures the frequency of automatic negative statements about the self. SATQ is a scale that is intended to measure the cognitive aspects of social anxiety. MCQ, CC, NTRP are primarily instruments developed for college students. The measures listed above have limitations because not only are they focused on special situations and a certain age level, but also patients were not used as control subjects.
Recently, the Stress Response Inventory was developed in Korea,11 but it is not a measure of cognitive responses perse. Therefore, the aim of this study is to develop a stress-induced cognition scale including all kinds of cognitive responses to stress, and to overcome the limitations of the previous measures mentioned above.
MATERIALS AND METHODS
Subjects and procedures for preliminary survey
The subjects used for the preliminary survey were 109 healthy adults (56 men, 53 women) over 20 years of age (mean ± SD, 41.6 ± 11.0 years). The mean (S.D.) length of education was 14.1 (3.3) years, and the mean (S.D.) monthly income was 2,485 (730) U.S. dollars. Eighty-three subjects were married, 22 were single, and the marital status of four was unknown. They were sent a letter of informed consent and a questionnaire, along with a written explanation of the study. All but six subjects responded to the questionnaire and returned it to the authors. The subjects were asked: "What do you think about when they face stressful situations?" Participants were also required to write 10 cognitive responses to stressful situations, beginning with the most common, along with their demographic characteristics.
The responses obtained from these 109 subjects were subgrouped according to similarity in content and expression, and the frequencies were checked for each response item. The final result was that 24 items were purely cognitive responses, and five had a mixture of cognitive and emotional elements. It was found that 29 responses were repeated more than five times.
Subject and procedures for preliminary questionnaire
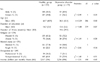
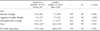
The 21 most commonly-mentioned items (those appearing more than nine times) were selected to create a preliminary questionnaire. At that time, the research team, comprised of 10 psychiatrists and psychologists, agreed on these 21 items. Each item on the preliminary questionnaire was arranged in a Likert-type format: 'Not at all' (0 point), 'Somewhat' (1 point), 'Moderately' (2 points), 'Very much' (3 points), or 'Absolutely' (4 points). The preliminary questionnaire was completed by 215 healthy subjects (108 men, 107 women) who were 20 years of age or older (mean ± S.D., 41.7 ± 10.4 years). Other sociodemographic characteristics of this group are described in Table 1.
The subjects included hospital employees and family members of medical students. They were sent a letter of informed consent and a questionnaire, as well as a written explanation of the study. All but 11 subjects responded to the questionnaire and returned it to the authors. Before they were screened for the presence or absence of any physical or psychiatric disorders via the questionnaire, the hospital employees were contacted directly by psychiatric residents to ensure that they had no physical or psychiatric disorders. For the family members of medical students, the medical students were asked to check for the presence or absence of physical and psychiatric disorders and to include in the study only those subjects who had no disorders. According to the self-report questionnaire, none of these subjects reported being treated for physical or psychiatric disorders or having symptoms of such disorders. In addition, all of the test subjects were found to be within normal limits in their annual physical check-ups.
The comparison group for the discriminant validity test was composed of patients who had been diagnosed with depressive disorders at the Department of Psychiatry at Severance Hospital. These patients were serially selected and interviewed, and given a verbal and written explanation of the outline of the study. Only those patients who granted informed consent were given the questionnaires which included items regarding the sociodemographic characteristics and the self-rating scales. The depressive disorder group included 45 patients with major depressive disorder and 28 with dysthymic disorder (32 men and 41 women in total; mean (S.D.) age 38.3 (12.3) years). The sociodemographic characteristics of the patients are described in Table 1. The diagnoses were made by an experienced psychiatrist using the DSM-IV criteria.12 Patients with other diagnoses were excluded from this study.
All 215 healthy subjects completed the other measures at the same time. Such measures included the Korean version13 of the SCL-90-R,14 the Korean version15 of the Global Assessment of Recent Stress (GARS) Scale,16 and the Perceived Stress Questionnaire (PSQ).17 The SCL-90-R is a 90-item self-rating instrument for assessing a person's psychopathology during the last week, and it includes nine subscales. The GARS is a self-rating instrument developed for assessing the severity of recent stressors in seven areas and one overall area during the week preceding its administration. The PSQ is a 30-item self-rating instrument designed to assess perceived stress during the month preceding its administration, and it is made of seven subscales.
The test-retest reliability of the preliminary questionnaire was calculated by the first and second testing by 62 randomly-selected subjects from the original 215 subjects after a two-week interval. Factor analysis was conducted and the factors were labeled.
Data analysis
A factor analysis was conducted using an oblique rotation after the maximum-likelihood factor analysis was completed. An independent t-test was used to compare the subscale scores and the total score of the SCS between the patient and healthy groups. The convergent validity of the subscale scores and the total score of the SCS was calculated with the total scores of the GARS scale, the total scores of the PSQ scale, and the subscale scores of the SCL-90-R, using Pearson's correlation. The test-retest reliability of the subscale scores and the total score of the SCS was calculated using Pearson's correlation on the first and second testing. The internal consistency of the subscales and the total score was calculated using Cronbach's α.
A comparison of the subscale and the total SCS scores according to sociodemographic characteristics (sex, occupation: professional or non-professional, marital status: married or single, and religion: present or absent) was made using an independent t-test. The relationships of age, education, income and the duration of illness with the test scores was examined using a Pearson's correlation. A multiple regression analysis was computed to determine the effect of the sociodemographic variables, with the dependent variable being the total score and the independent variables being those sociodemographic characteristics that had been confirmed as significantly influencing the total score
RESULTS
Sociodemographic characteristics of the subjects
The healthy group was significantly older, and had higher income level than the patient group. No significant differences were found between the two groups with respect to sex, education level, marital status or occupation (Table 1).
Factor analysis of the SCS
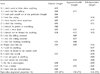
Factor analysis was conducted on 21 response items, using oblique rotation after a maximum-likelihood factor analysis, which yielded three factors with an eigen value of greater than one. Among them, all 21 items with a factor loading greater than 0.3 were extracted. In the case of those items with a factor loading greater than 0.3 on more than one factor at the same time, the greatest one was extracted.
The first factor, labeled 'extreme thought', was found to have the highest eigen value of 9.89, and explained 47.1% of the responses. This was followed by the second factor, labeled 'aggressive-hostile thought', the third factor, labeled 'self-depreciative thought'. Each item's factor loading is listed in Table 2.
The SCS was finalized with a total of 21 response items under the three subscales. There were 9 items under the extreme thought subscale, 4 items under the aggressive-hostile thought subscale, and 8 items under the self-depreciative thought subscale.
The FITMOD program was used to determine the fitness of the factors. It was found that the root mean square error of the approximation (RMSEA) index was 0.06. This suggests that the three factors originally extracted from the factor analysis are likely to be fit.
Reliability of the SCS
Test-retest reliability
Test-retest reliability of the three subscale scores and the total score was computed by a first and second testing. It was at a significant level (p < 0.001), ranging from 0.87 to 0.95 (r) (Table 3).
Internal consistency
Cronbach's α was computed for the three subscales scores and the total score of the 215 subjects, and the result was significant (p < 0.01), ranging from 0.82 to 0.91 for each of the three subscales, and 0.94 for the total score (Table 3).
Correlations of SCS subscales
The correlations between the total score and each of the subscale scores, as well as the correlations between the subscales, were all significant. Their levels ranged from 0.58 to 0.94 (Table 4).
Item-subscale total correlations
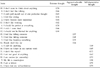
The response item scores of the three subscales correlated significantly with the subscale total score of the SCS (Table 5).
Validity of the SCS
Convergent validity
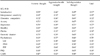
The convergent validity of the SCS was computed by correlating the scale scores with preexisting measures, such as the GARS, PSQ, and SCL-90-R. The three subscale scores and the total score of the SCS correlated significantly with the total scores of the GARS and the PSQ, and with each of the subscale scores of the SCL-90-R (Table 6).
Discriminant validity
Discriminant validity was also computed by comparing the scores of the patient group with those of the healthy control group. The patient group scored significantly higher than the control group on all the three subscales, and on the total score of the SCS (Table 7).
The relationship between the SCS subscale scores and the level of depression
The extreme thought subscale (r = 0.76 p < 0.001), the aggressive-hostile thought subscale (r= 0.49 p < 0.001), the self-depreciative thought subscale (r = 0.71 p < 0.001) and the total score of the scale (r = 0.77 p < 0.001) had significant correlations with the SCL-90-R depression subscale score in the healthy group. Each of the subscales (extreme thought subscale r = 0.81 p < 0.001, aggressive-hostile thought subscale r = 0.61 p < 0.001, self-depreciative thought subscale r = 0.76 p < 0.001) and the total score of the scale (r = 0.88 p < 0.001) had also significant correlations with the SCL-90-R depression subscale score in the depressive disorder patients.
The relationship between sociodemographic variables and the SCS scores
For the healthy group, several significant relationships between the sociodemographic variables and the SCS scores were found. When compared according to sex, females scored significantly higher on the total SCS score than males (12.3 ± 11.5 vs. 15.7 ± 13.2, t = -2.01, df = 213, p = 0.04). Among the three subscales, females scored significantly higher only on the extreme thought subscale than did males (5.9 ± 5.1 vs. 8.4 ± 6.2, t = -3.23, df = 213, p = 0.001). Income level had a significant negative correlation with the total score (r = -0.21 p = 0.002), but age (r = -0.07 p = 0.33) and education level (r = -0.12 p = 0.10) had no significant correlations with the total score. No significant differences for marital status (married vs. single, 12.4 ± 10.9 vs. 17.1 ± 15.2, t = -1.96, df = 59, p = 0.05), occupation (professional vs. nonprofessional, 11.4 ± 10.6 vs. 14.0 ± 12.8, t = -1.31, df = 158, p = 0.19), or religion (present vs. absent 14.9 ± 13.8 vs. 12.2 ± 9.7, t = 1.65, df = 189, p = 0.10) were found in the total score of the SCS.
A multiple regression analysis was conducted to control for sociodemographic variables such as sex, education level, and income. It was found that regardless of the sociodemographic variables, the patient group scored significantly higher than the healthy group in the total score of the SCS (R = 0.36, F = 39.3, p < 0.001; B = 20.78, SE = 1.92, β = 0.53, p < 0.001). However, no significant correlation was found between the duration of illness and the total score of the SCS for the patient group (r = 0.14, p = 0.25).
DISCUSSION
Three subscales (extreme thought, aggressive-hostile thought and self-depreciative thought) were identified after a factor analysis was performed for all the items of the SCS. The factor analysis results could be characterized in two ways. First, the items identified on the extreme thought subscale (nine items) were the most common. This was followed by the items for the self-depreciative thought subscale (8 items), and the items for the aggressive-hostile thought subscale (4 items). Second, the extreme thought subscale (47.1%) accounted for the largest proportion of the scale. These results suggest that extreme thought responses are possibly the most common among stress-related cognitive responses.
The test-retest reliability was significantly high, as was the internal consistency for each subscale and the total score. The correlations between each of the three subscales and the total score, as well as the correlations between each of the items and the subscale scores, were all significant. These results indicate that the SCS is highly reliable and stable.
Since this scale is a tool that measures cognitive responses related to stress, the convergent validity was checked by correlating the SCS with the three pre-existing measures relevant to stress, such as the Korean version of SCL-90-R,14 the Korean version of the GARS scale,16 and the PSQ.17 It was found to be significant, with high correlations between the three subscale scores or the total score of the SCS and the total scores for each of the GARS and the PSQ, or each of the subscales of the SCL-90-R.
The depressive disorder group scored significantly higher than the healthy group on all of the three subscales as well as the total SCS score. These findings suggest that the disorder group is likely to have a broader range of stress-related cognitive responses than the healthy group. These results could contribute to the discriminant validity of this instrument.
Regarding the relationship between sex and scale scores in the healthy subjects, females scored significantly higher than males in the extreme thought subscale and the total score, which indicate that negative cognitive responses to a stressor are more prominent in women than in men. A number of studies have found that women are more likely to become depressed than men.18-20 It was also found that women experience more negative life events than men.21 In terms of income level, the variable was found to have a significant negative correlation with the total SCS score, which indicates that the demographic variable may be associated with negative cognitive responses.
As is shown in Table 6, the extreme thought subscale, the self-depreciative thought subscale, and the total score of the scale all had the greatest correlation coefficients in their association with the SCL-90-R depression subscale among all the SCL-90-R subscales in healthy adults. For the depressive disorder patients, the level of depression was also significantly correlated with each of the subscales and the total score of the scale. These findings indicate that this scale is more likely to be related to depression than any other psychopathology.
In conclusion, these results suggest that the SCS is highly reliable and valid, and that it can be effectively utilized as a measure for research of the cognitive responses related to stress.


 XML Download