

 PDF
PDF ePub
ePub Citation
 Print
Print


INTRODUCTION
In patients with congenital heart disease (CHD), ventricular volume quantification is of critical importance in risk stratification, treatment planning, and outcome prediction. As the present gold standard for ventricular volume quantification, two-dimensional (2D), commonly short-axis, cine imaging is used and ventricular cavities are segmented by using simplified contouring and disc summation. In spite of its methodological imperfections, this method has been most commonly used in clinical practice mainly due to its reasonably high reproducibility and relatively short post-processing time (1). However, the accuracy of volumetry using this method is generally degraded for the right ventricle (RV) and a complex CHD (2). Errors in this method result from inclusion of the papillary muscles and trabeculations in ventricular cavity, incorrect inclusion of basal section at the semilunar and atrioventricular valve planes, and respiratory misregistration artifacts during multiple breath-hold 2D cine acquisitions (34).
Therefore, other segmentation methods have been developed to decrease these errors (456789101112131415). Of these, a threshold-based segmentation is an effective method separating the ventricular cavity from the myocardium which includes the papillary muscles and trabeculations based on pixel or voxel signal intensities (7891112131415). In addition, a three-dimensional (3D) analysis can avoid an error (about 20%) caused by disc summation of 2D slices (16). Consequently, a 3D threshold-based segmentation using a 3D image data seems to offer highly accurate and reproducible ventricular volume quantification, which has been evaluated predominantly by using a 3D cardiac CT data but not by using 3D cardiac MRI (17181920).
Only a single research group has reported comparable or higher correlations and reproducibility of ventricular volumetry utilizing 3D whole-heart MRI, compared with that using a phase contrast MRI or 2D short-axis cine MRI (567). However, in these studies, a deformable simplex mesh model (56) or a 2D threshold-based segmentation (7) was used for segmenting 3D whole-heart MRI data. Theoretically, the 3D threshold-based segmentation methodology is expected to further improve accuracy of 3D whole-heart MRI in ventricular volume quantification, if their results hold true. Therefore, the purpose of this study was to test whether the 3D threshold-based segmentation method, using 3D whole-heart MRI data, has an additional benefit over the simplified contouring method using 2D cine MRI data in quantifying ventricular volumes.
MATERIALS AND METHODS
Study Population
This retrospective study was approved by the Institutional Review Board of our hospital, which waived informed consent. To utilize flow measurements of the great arteries as a reference, left or right cardiovascular data pairs were excluded when mitral or tricuspid regurgitation greater than grade 1 or interventricular shunt was demonstrated at transthoracic echocardiography. Additionally, cases with functional single ventricles or with poor image quality were excluded. Thus, 110 patients with CHD (median age 18 years, age range 4 months–35 years; M:F = 74:36) who performed navigator-gated, contrast-enhanced, 3D whole-heart MRI during end-systole (ES) and end-diastole (ED), 2D short-axis cine MRI, and phase contrast MRI of the great arteries were enrolled in this study. The majority of included patients were; repaired tetralogy of Fallot (n = 86), followed by repaired pulmonary atresia with ventricular septal defect (n = 6), repaired pulmonary atresia with intact ventricular septum (n = 3), repaired pulmonary atresia, ventricular septal defect and major aortopulmonary collateral arteries (n = 2), and others (n = 13). Among them, completely matched left ventricle (LV) volume and aortic flow data were available in 109 patients after exclusion of one patient with grade 1–2 mitral regurgitation at echocardiography. Completely matched RV volume and pulmonary arterial flow data were available in 77 patients, after exclusion of 30 patients with tricuspid regurgitation ≥ grade 1 at echocardiography and three patients with no available pulmonary artery flow data.
Cardiac MRI
Cardiac MRI was performed by using a 1.5T system (Achieva; Philips Healthcare, Best, the Netherlands) and a 32-channel cardiac coil. Uncooperative patients were sedated with oral chloral hydrate. Intravenous injection of midazolam or ketamine was added if required. General anesthesia or controlled ventilation was not used. These sedated patients were breathing on their own throughout cardiac MRI examination. Heart rates (beats per minute [bpm]) and trigger delays (ms) for 2D short-axis cine imaging and 3D whole-heart imaging for both ES and ED phases were obtained from the annotations on the processed images or the Digital Imaging and Communication in Medicine (DICOM) header.
Phase-Contrast MRI
Through-plane 2D velocity-encoded phase-contrast MRI using retrospectively electrocardiography (ECG)-gated gradient recalled echo pulse sequence was acquired to measure flow volumes of the ascending aorta, the right pulmonary artery, and the left pulmonary artery. Imaging parameters that were used for the phase contrast imaging were as follows: repetition time (TR)/echo time (TE), 4.7 ms/2.6 ms; flip angle, 15°; turbo field echo factor, 3–4; the number of cardiac phases, 20; temporal resolution, 28 ms; the number of signal averages, 2; and section thickness, 5 mm. Field of view and pixel size (1.3–2.0 mm) were adjusted individually according to a patient's size. Initial velocity encoding settings (cm/sec) were set to 150 for the ascending aorta and 250 for the pulmonary arteries. When there was an aliasing artifact, the velocity settings were increased by 30–50 cm/sec. In order to make the imaging plane perpendicular to the long axis of a target vessel as much as possible, two orthogonal balanced steady-state free-precession (SSFP) scout images were used, i.e., coronal and sagittal images for the ascending aorta, axial and coronal images for the right pulmonary artery, and axial and sagittal views for the left pulmonary artery. Pulmonary artery flow volume was calculated as the sum of the right and left pulmonary artery flow volumes. In addition to an increase in pixel size (2 × 2 mm), sensitivity encoding (SENSE) with factor 1.7–2.0 was applied to phase-contrast MRI to decrease scan time for breath-hold acquisition in cooperative patients. In sedated or uncooperative patients, free-breathing phase contrast MRI was obtained with no SENSE, smaller pixel size, smaller field of view, and the number of signal averages of 3.
Short-Axis Cine MRI
Multi-slice retrospectively ECG-gated 2D short-axis cine MRI using balanced SSFP sequence and k-t Broad-use Linear Acquisition Speed-up Technique that included the entire ventricles was acquired during multiple breath-holds in cooperative patients and during free breathing in sedated or uncooperative patients. Imaging parameters used for the short-axis cine imaging were as follows: TR/TE, 2.9 ms/1.5 ms; flip angle, 60°; turbo field echo factor, 9–13; the number of cardiac phases, 20; temporal resolution, 30–50 ms; the number of signal averages, 1; in-plane spatial resolution 1.8–2.0 x 1.8–2.0 mm; 10–12 slices; section thickness, 8–10 mm; and SENSE factor, 0. Field of view was adjusted individually according to patient size. End-expiratory breath hold was requested to achieve a constant level of breath holding for both phase-contrast MRI and short-axis cine MRI.
Whole-Heart MRI
Respiratory navigator-gated, ECG-triggered, contrast-enhanced, 3D whole-heart balanced SSFP MRI with fat saturation and T2 preparation pulse was acquired in transverse plane at the ES and the ED, separately (n = 89) or simultaneously (n = 21) during free breathing. Imaging parameters that were used for the 3D whole-heart imaging were as follows: TR/TE, 3.8 ms/1.9 ms; flip angle, 60°; turbo field echo factor, 8–15; the number of cardiac phases, 1 or 2; temporal resolution, 30–100 ms; the number of signal averages, 1; voxel size, 1.3–1.8 mm × 1.3–1.8 mm × 1.3–1.8 mm; 130 slices; and SENSE factor, 1.5–2.0 in anteroposterior direction. Field of view was adjusted individually according to patient size. The acceptance window of pencil beam navigator placed on the diaphragmatic dome was adjusted to the range of 3–7 mm to achieve optimal navigator gating efficiency of approximately 60% depending on a patient's respiratory pattern. Eighty-phase four-chamber cine imaging was used to determine the timing and duration of the ES and ED phases independently of each other in 89 patients. In dual-phase whole-heart MRI sequence enabling simultaneous acquisition of the two cardiac phases (6), a shorter duration between the two was selected to avoid image degradation of a shorter, usually ES, phase in the remaining 21 patients. Since the true trigger delay for the ED phase determined by 80-phase four-chamber cine imaging was technically difficult to be incorporated in whole-heart MRI protocol, the actual ED trigger delay was set to be the longest allowable. The total scan time for the 3D whole-heart MRI including both ES and ED phases was variable depending on imaging parameters and navigator efficiency, and was approximately 10–12 minutes. Single dose (0.1 mmol/kg) of a gadolinium-based contrast agent (gadoterate meglumine; Guerbet, Villepinte, France) was intravenously administered immediately prior to whole-heart MRI.
Flow Quantification
For flow measurements, regions of interest were placed manually along the outlines of the great arteries including the ascending aorta, the right pulmonary artery and the left pulmonary artery on 20 magnitude images of 2D cine phase-contrast MRI by using a commercially available workstation (View Forum; Philips Healthcare). The measured forward stroke volumes were recorded.
Ventricular Volume Quantification
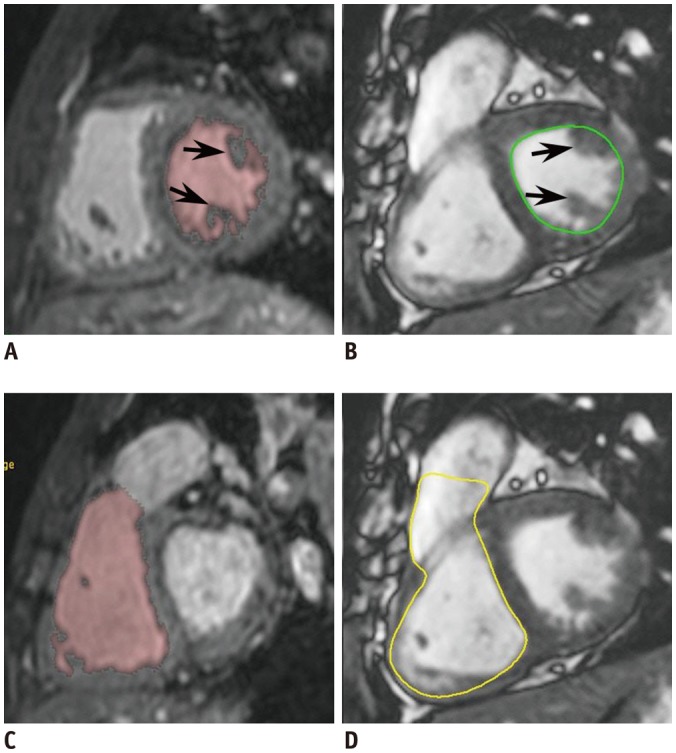
Ventricular volume quantification, using 2D short-axis cine MRI, was performed by using a commercially available workstation (View Forum). The ES and ED phases were chosen independently for each ventricle when the cardiac phase displayed the smallest and largest ventricular cavity at the mid-ventricular level, respectively. A manual simplified endocardial contouring method was used with inclusion of the papillary muscles and trabeculations in ventricular cavity (Fig. 1). At the basal sections, the semilunar and atrioventricular valve planes were manually drawn by tracing the valve planes on neighboring cine images.
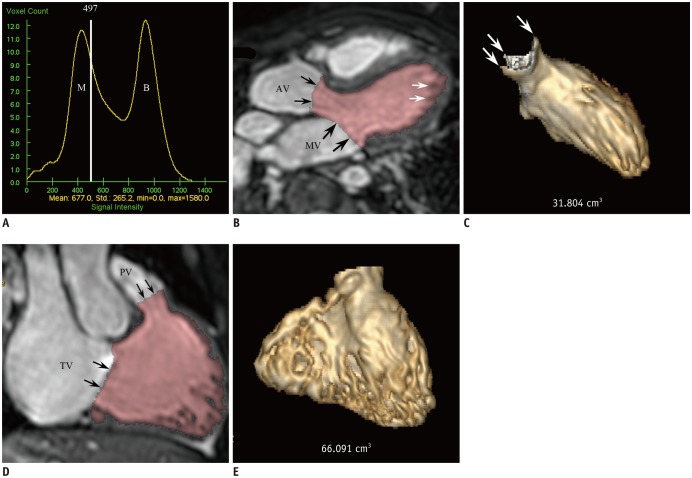
For 3D whole-heart MRI, ventricular volumes were quantified by using another commercially available workstation (Advantage Windows 4.6; GE Healthcare, Milwaukee, WI, USA). By using a 3D threshold-based segmentation method, the papillary muscles and trabeculations could be excluded from ventricular cavity (Fig. 1). An optimal segmentation threshold for the ES and ED phases was chosen independently for each cardiac phase by using a histogram-assisted analysis to identify the tissues consisting of 100% ventricular myocardium in the region of the interventricular septum (Fig. 2) (2021). Atrioventricular valve planes were manually adjusted by using a 3D region-growing editing tool and the semilunar valve planes were manually corrected by using a 3D scalpel tool (Fig. 2). Processing time for ventricular volume quantification, using the 3D threshold-based segmentation and subsequent manual adjustment, was recorded.
From the measured ES and ED volumes with the simplified contouring methodology using 2D short-axis cine MRI and with the 3D threshold-based segmentation method using 3D whole-heart MRI, left and right ventricular stroke volumes were calculated.
Statistical Analyses
The obtained data were statistically analyzed with SPSS statistical software version 23.0 (IBM Corp., Armonk, NY, USA). Continuous variables were expressed as a mean ± standard deviations. The heart rates and trigger delays for both ES and ED phases were compared between the 2D short-axis cine imaging and the 3D whole-heart imaging. For both 2D short-axis cine imaging and 3D whole-heart imaging, the stroke volumes calculated from the ES and ED ventricular volumes were correlated and compared with the arterial flow volumes. The ES and ED volumes were compared and correlated between the 2D short-axis cine imaging and the 3D whole-heart imaging. Paired t test and Pearson correlation were used for these analyses. Bland-Altman analysis was used to determine mean difference and 95% limits of agreement between the comparisons. A p value < 0.05 was considered statistically significant.
RESULTS
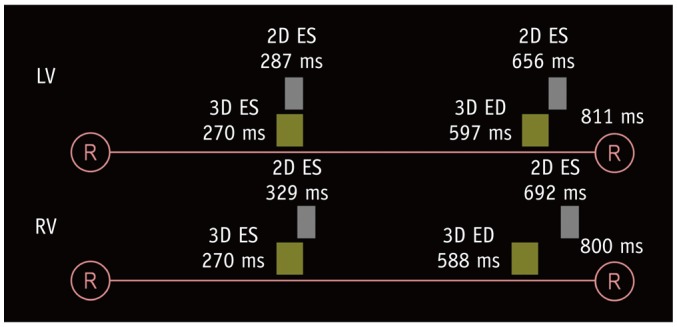
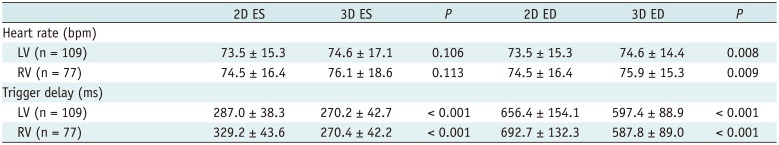
The comparisons of the heart rates and trigger delays for both ES and ED phases between the 2D short-axis cine imaging and the 3D whole-heart imaging are described in Table 1. All the patients displayed sinus rhythm during cardiac MRI examinations. There were no statistical differences in the heart rate between the 2D short-axis cine imaging and the end-systolic 3D whole-heart imaging for both the LV (73.5 ± 15.3 bpm vs. 74.6 ± 17.1 bpm, p = 0.106) and RV (74.5 ± 16.4 bpm vs. 76.1 ± 18.6 bpm, p = 0.113). For the ED phase, the heart rates were significantly higher during the 3D whole-heart imaging than the 2D short-axis cine imaging for both the LV (74.6 ± 14.4 bpm vs. 73.5 ± 15.3 bpm, p = 0.008) and the RV (75.9 ± 15.3 bpm vs. 74.5 ± 16.4 bpm, p = 0.009). The ES and ED trigger delays of the 3D whole-heart imaging were much less than those of the 2D short-axis cine imaging for both the LV (the ES phase: 270.2 ± 42.7 ms vs. 287.0 ± 38.3 ms, p < 0.001; the ED phase: 597.4 ± 88.9 ms vs. 656.4 ± 154.1 ms, p < 0.001) and the RV (the ES phase: 270.4 ± 42.2 ms vs. 329.2 ± 43.6 ms, p < 0.001; the ED phase: 587.8 ± 89.0 ms vs. 692.7 ± 132.3 ms, p < 0.001) (Fig. 3).
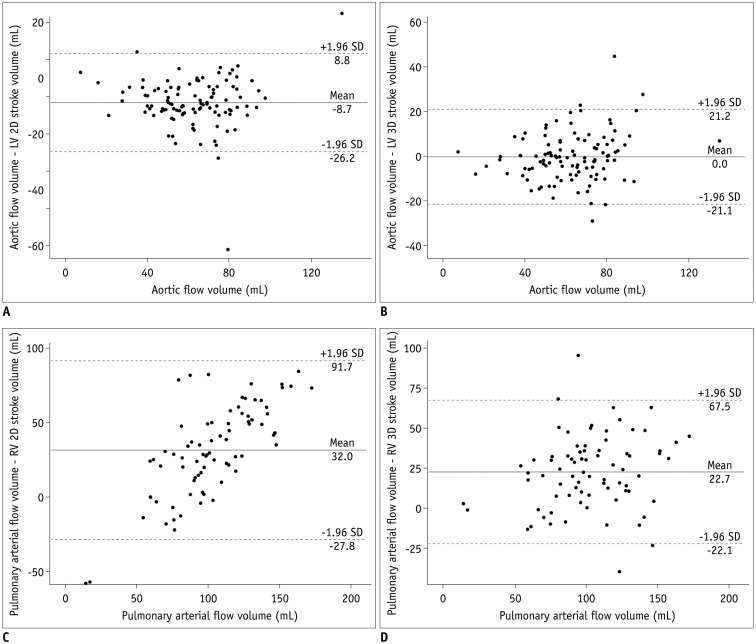
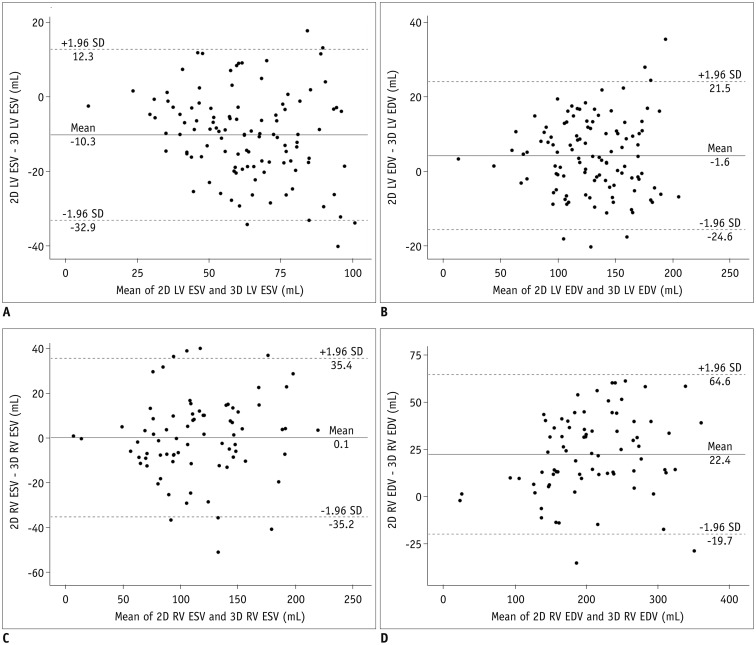
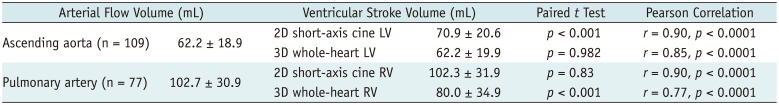
The comparisons and correlations between the arterial flow volumes measured by phase contrast MRI and the stroke volumes calculated from the ventricular volumes are noted in Table 2. The aortic flow volumes were not significantly different (mean difference = 0.02 mL, p = 0.982) from the LV stroke volumes obtained from the 3D whole-heart MRI but significantly different (mean difference = −8.7 mL, p < 0.001) from those obtained from the 2D cine MRI (Table 2). The pulmonary arterial flow volumes had no significant difference (mean difference = 0.4 mL, p = 0.83) from the RV stroke volumes obtained from the 2D cine MRI but significantly different (mean difference = 22.7 mL, p < 0.001) from those obtained from the 3D whole-heart MRI (Table 2). With the arterial flow volumes measured by phase-contrast MRI as the gold standard, Bland-Altman plots demonstrated variably wide 95% limits of agreement for the 2D LV stroke volumes (−26.2 mL and 8.8 mL), the 3D LV stroke volumes (−21.1 mL and 21.2 mL), the 2D RV stroke volumes (−27.8 mL and 91.7 mL), and the 3D RV stroke volume (−22.1 mL and 67.5 mL) (Fig. 4). Moreover the RV stroke volumes, obtained from the 2D short-axis cine imaging, tended to be overestimated for smaller pulmonary arterial flow volumes and underestimated for larger pulmonary arterial flow volumes (Fig. 4C). Higher correlations with the arterial flow volumes were observed in the 2D cine MRI than in the 3D whole-heart MRI for the LV (r = 0.90 vs. 0.85) and the RV (r = 0.90 vs. 0.77) (Table 2).
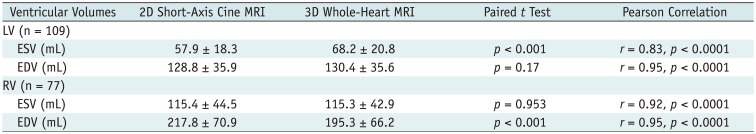
Table 3 shows the comparisons and correlations of the measured ventricular volumes between the 2D short-axis cine imaging and the 3D whole-heart imaging. LV ED and RV ES volumes displayed no significant difference (mean difference = −1.6 mL and 0.1 mL; p = 0.17, 0.953) between the two methods, while LV ES and RV ED volumes showed significant difference (mean difference = −10.3 mL and 22.4 mL; p < 0.001) between the two methods (Table 3). Bland-Altman plots displayed wide 95% limits of agreement in the ventricular volumes between the two methods for the LV ES volumes (−32.9 mL and 12.3 mL), the LV ED volumes (−24.6 mL and 21.5 mL), the RV ES volumes (−35.2 mL and 35.4 mL), and the RV ED volume (−19.7 mL and 64.6 mL) (Fig. 5). In Pearson correlation, ED volumes tended to have higher correlations (r = 0.95 vs. 0.83 for the LV, 0.95 vs. 0.92 for the RV) than ES volumes between the two methods.
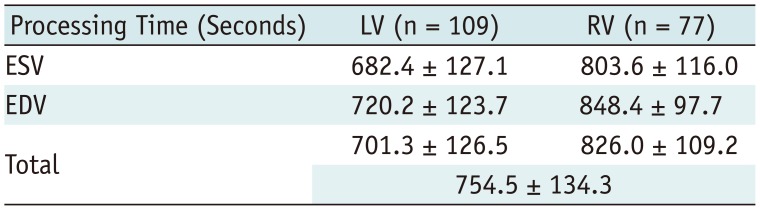
The processing time for ventricular volume quantification using the 3D threshold-based segmentation was 754.5 ± 134.3 seconds per a ventricle (Table 4). Although the processing time of the 2D simplified contouring method was not recorded, the ventricular volume quantification by using the 2D simplified method could be completed within 300 seconds per a ventricle.
DISCUSSION
Great arterial flow measurements using phase-contrast MRI has been frequently used as the reference in many studies investigating ventricular volume quantification because of its increased accuracy with a small error range, usually within ± 5% (2223). This study demonstrated that the stroke volumes calculated from the ventricular volumes had good correlations with the arterial flow volumes measured by the phase-contrast MRI (the reference standard), slightly higher for the 2D cine MRI than for the 3D whole-heart MRI (Table 2). Noteworthy, the results of this study were different from others reporting ventricular volume quantification of 3D whole-heart MRI that displayed comparable or higher correlations and reproducibility with those of flow measurements or 2D short-axis cine MRI (567). Instead of 3D threshold-based segmentation used in this study that is a very accurate and reproducible method, less accurate methods were used in their studies, such as a deformable simplex mesh model for 3D whole-heart MRI (56) and a 2D threshold-based segmentation for both the reformatted 3D whole-heart MRI in short-axis plane and the 2D short-axis cine MRI (7). Substantial underestimation of ED volumes, especially for the RV, quantified by using the 3D whole-heart MRI in this investigation seemed to be chiefly caused by early timing of the ED phase in spite of the longest trigger delay. The timing issue of the pulse sequence design of 3D whole-heart MRI has not been described in any literature on this subject. Consequently, the previous excellent results using 3D whole-heart MRI (567) should be further validated and cautiously used for ventricular volume quantification. In fact, 3D whole-heart MRI was abandoned for ventricular volumetry but performed only for a cardiovascular morphological evaluation in our institution, based on the results of this study.
The LV stroke volumes obtained from the 2D cine MRI were significantly greater (8.7 mL, 14.0%) than the aortic flow volumes. Different degrees of inclusion of the papillary muscles and trabeculations in ventricular cavity between the ES and ED phases might be attributed to this overestimation. Unfortunately, it could not be proven in this study. LV stroke volume is often overestimated up to 16.2 mL in the presence of mitral regurgitation, as compared with aortic flow volume (24); LV stroke volume calculated from ventricular volumes might therefore be slightly overestimated in this study due to the inclusion of trace mitral regurgitation. In this study, the smaller LV ES volumes obtained from the 2D cine MRI might be explained by an earlier ES trigger delay and a lengthened ES acquisition window of the 3D whole-heart MRI, but smaller ventricular volumes that is caused by the exclusion of the papillary muscles and trabeculations resulting from the 3D threshold-based segmentation counteracted the explanation. No significant difference in the LV ED volumes between the two methods was difficult to explain because the volume measured by a threshold-based segmentation would be smaller, e.g., −23% in a study (11). Although it was used as the gold standard, the aortic flow volume measured by the phase contrast MRI might be slightly underestimated due to the lack of inclusion of coronary artery flow (approximately 5% of cardiac output) and turbulent flow in the dilated ascending aorta often seen in patients with repaired cyanotic CHD.
The RV stroke volumes obtained from the 3D whole-heart MRI were much smaller (22.7 mL, 22.1%) than the pulmonary arterial flow volumes. Because the RV ES volumes were nearly identical (only a 0.1-mL difference) between the two methods, the underestimated RV ED volumes by approximately 10% obtained from the 3D whole-heart MRI might be attributed to the smaller RV stroke volumes. Although it was not totally proven in this study, the early timing of the ED phase of the 3D whole-heart MRI possibly resulted in the underestimated RV ED volumes.
An optimal threshold should be used for a threshold-based segmentation to guarantee high accuracy of ventricular volume quantification: a lower threshold overestimates ventricular volumes and a higher threshold underestimates them. In previous studies (8911, 151718), thresholds have been determined at 50–70% between the blood and myocardium signal intensities, by using automated myocardial effusion threshold reduction and intravoxel computation, by manual adjustment after automatic threshold definition, and by visual adjustment. In this study, an optimal threshold was individually determined by using a histogram-assisted analysis separating the most compacted myocardium, i.e., the interventricular septum, from the adjacent ventricular blood. Of note, the 2D threshold-based segmentation by utilizing automated myocardial effusion threshold reduction and intravoxel computation was failed in 7% (3/44) of the patients due to impaired blood-to-myocardium contrast on MRI (9). In this regard, a high-quality image dataset is of critical importance to take full benefits of a threshold-based segmentation approach. Cardiac MRI, however, is frequently susceptible to a variety of artifacts from motion, blood flow, magnetic field inhomogeneity, and metallic implants, which appears suboptimal for threshold-based segmentation. In this respect, cardiac CT with excellent image quality and less artifacts seems to be more suitable for 3D threshold-based ventricular volume quantification.
In this study, the atrioventricular and semilunar valve planes were manually adjusted for the 3D threshold-based segmentation. Such manual corrections are necessary to achieve high accuracy of ventricular volume quantification because semi- or fully automated segmentation approach is frequently imperfect in segmenting the valve planes particularly when the valves are open or in segmenting the ventricles with a ventricular septal defect (38). A prior study reported that manual adjustment was still necessary for an automated LV segmentation method in approximately 40% of the cases (25). As it is obligated to increase accuracy, the downside of such manual adjustment is longer processing time and potential to decrease reproducibility. In fact, the mean processing time for the semiautomatic 3D threshold-based segmentation including manual adjustment was approximately 13 minutes per a ventricle in this study that may be shortened by an improved segmentation algorithm in the future. Intra- and inter-observer variabilities were not evaluated in this study because the high reproducibility of a threshold-based segmentation method already has been intensely reported (89121318).
The Bland-Altman plots displayed variable 95% limits of agreement in the ventricular stroke volumes and the ventricular volumes, wider for the RV than the LV as expected in considering the complex RV geometry (Figs. 4, 5). In 2D short-axis cine MRI using the same segmentation method for left ventricular volume quantification, inter-study 95% limits of agreement have been reported in the range of ± 10–40 mL (2426). In addition to the inclusion of the RV volumetry data, the comparisons of the two different imaging techniques as well as the two different segmentation methods seem to increase the 95% limits of agreement in this study.
The 3D threshold-based segmentation used in this study included the so-called partial volume averaging effect between the ventricular blood and the myocardium that led to small overestimation of the ventricular volumes and underestimation of the myocardial masses. A partial voxel interpolation technique was reported to reduce this effect (25). However, this technique is not currently available in commercially available workstations. The partial voxel interpolation may be particularly beneficial for ventricular myocardial mass quantification because ventricular mass or ventricular mass-to-volume ratio has been found to be valuable in identifying or predicting adverse remodeling and outcome (2728).
Recently, single breath-hold compressed sensing 2D cine MRI has been under investigation to improve patient compliance and decrease respiratory misregistration artifact of standard 2D cine MRI (2426). However, the imaging technique currently has several limitations including long breath holding time (24–27 seconds), long reconstruction time, missing of the ED phase due to prospective ECG triggering, spatial and temporal blurring, fold-over artifacts, and flow-related artifacts that preclude its use for clinical routine (2426).
This investigation has several limitations. First, a simple and direct comparison could not be performed between the two segmentation methods or between the two imaging techniques because the two different imaging techniques were segmented by the two different methods. Therefore, several confounding factors might affect the comparisons in this study and the exact causes of the discrepant results are difficult to be clearly explained in this circumstance. This important limitation can be resolved in a prospective study that is designed to control these confounding factors well. However, as in this study, the two different MRI techniques also were segmented by two different methods in other studies (56). It was expected that 3D whole-heart MRI would result in much higher accuracy in ventricular volume quantification because a better 3D threshold-based segmentation method was used in this study, compared to a deformable simplex mesh model in the previous studies (56), but this was not the case. Nonetheless, the early timing of ED phase was newly found as a serious limitation of 3D whole-heart MRI in the ventricular volumetry. The timing issue of the pulse sequence may be resolved by using two cardiac cycles rather than using one cardiac cycle, but longer examination time or lower spatial resolution is a trade-off. Second, the timing differences between the two imaging methods could not be formulated to explain the volume differences between the two because fractional volume changes during the cardiac cycle is highly variable and only two cardiac phases were compared in this study. Based on the results, it, however, is speculated that the early timing of ED phase might have a greater effect on RV ED volumes. Third, the timing issue of whole-heart MRI was raised in a single MRI system in this study. Therefore, different results may be obtained in studies utilizing other MRI systems. Lastly, different respiration states in cooperative patients might affect the results of this study: breath-holding in the phase contrast MRI and the 2D short-axis cine-MRI, and free-breathing in the 3D navigator-gated whole-heart MRI.
Unlike its expected advantages, 3D whole-heart MRI has an inherent problem in selecting the correct ED phase, which should be seriously considered in using the imaging technique for ventricular volumetry.
 XML Download