

 PDF
PDF ePub
ePub Citation
 Print
Print


INTRODUCTION
State-of-the-art cardiac magnetic resonance (CMR) imaging with late gadolinium enhancement (LGE) allows assessment of myocardial viability at high spatial resolution, critical in accurately predicting the patient's prognosis and in informing the need for revascularization therapy (123). However, diagnostic performance of CMR imaging, predominantly conducted at 1.5T, has been validated with a double dose (0.2 mmol/kg) or more of gadolinium contrast, exceeding the label-recommended dose (generally 0.1 mmol/kg) (4). Thus, in clinical practice, LGE imaging using a double dose of gadolinium may lead to two concerns: potential risk of nephrogenic systemic fibrosis (NSF) (567) and difficulty in differentiating a subendocardial high signal from the brightened left ventricular (LV) cavity (8).
In recent years, magnetic resonance (MR) systems with higher magnetic field strength (3T) have become available for clinical application and have demonstrated considerable promise (910). LGE imaging can benefit from higher magnetic field strength owing to several points. First is improvement in signal-to-noise ratio (SNR). Theoretically, a two-fold increase in SNR can be obtained by increasing magnetic field strength from 1.5T to 3T (9). Second, prolonged longitudinal relaxation time (T1) of normal myocardium at 3T leads to maximization of absolute signal difference between normal and infarcted myocardium (1112). Hence, even with reduced dose of gadolinium contrast, 3T MR with LGE is anticipated to provide comparable image quality to 1.5T MR as well as decrease risk of NSF. However, to the best of our knowledge, there has been no study validating 3T LGE imaging using single-dose gadolinium contrast in intra-individual comparison with 1.5T MR using conventional double-dose gadolinium in patients with myocardial infarction.
We hypothesized that 3T CMR imaging using single-dose gadolinium contrast would provide comparable contrast-to-noise ratio between infarcted and normal myocardium (CNRinfarct-normal) as well as better CNR between infarct and LV cavity, and reveal higher reproducibility for quantification of relative infarct size, compared to 1.5T MR using a double-dose gadolinium. Thus, this prospective study was designed to conduct an intra-individual comparison of 3T MR with use of 0.1 mmol/kg of gadoterate meglumine to 1.5T MR using 0.2 mmol/kg of the same gadolinium agent for assessment of myocardial infarction.
MATERIALS AND METHODS
The Institutional Review Board of our hospital approved this prospective study and written informed consent was obtained from all patients prior to enrollment in this study.
Patients
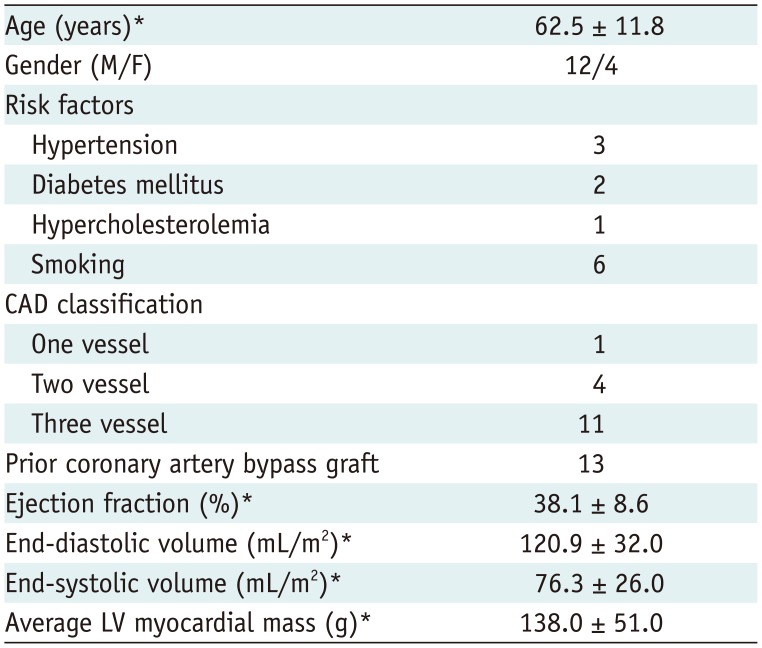
All patients diagnosed with chronic myocardial infarctions at previous CMRs based on findings described in previous studies (1314) and referred to the radiology department of our hospital December 2013–July 2014 for follow-up CMR were eligible for this prospective study. Exclusion criteria included renal impairment (glomerular filtration rate ≤ 60 mL/min), known hypersensitivity to gadolinium agents, and general contraindications to MR imaging. A total of 16 patients (M:F = 12:4; mean age, 62.5 ± 11.8; age range, 44–77) that underwent 1.5T MR using a double dosage of gadolinium contrast first, followed by imaging at 3T MR using single dosage of gadolinium within two weeks comprised our study population.
MRI Protocol
All MR examinations were conducted on a 1.5T MR scanner (Magnetom Sonata; Siemens Medical Solutions, Erlangen, Germany) using a 12-channel, phased-array body surface coil and a 3T MR scanner (Trio; Siemens Medical Solutions) using a 12-channel, phased-array body surface coil. A dielectric pad was placed on the patient's body to improve image homogeneity. All MR images were acquired during repeated end-expiratory breath-holds and were retrospectively electrocardiographically gated.
After conducting scout images, LGE images were obtained using an inversion recovery (IR) turbo fast low-angle shot sequence at 1.5T and 3T MR scanners. We adjusted scan parameters to be identical between the two examinations for optimal comparison and parallel imaging technique was not applied on either examination: for 1.5T MR, repetition time (TR)/echo time (TE) of 8.3 msec/3.4 msec, a flip angle of 25°, a receiver bandwidth of 140 Hz/pixel, a field of view of 172 × 250 mm, an image matrix of 256 × 139, and a slice thickness of 7 mm; for 3T MR, a TR/TE of 5.3 msec/2.0 msec, a flip angle of 13°, a receiver bandwidth of 285 Hz/pixel, a field of view of 172 × 250 mm, an image matrix of 256 × 139, and a slice thickness of 7 mm. Parameters of gradient system are as follows: a maximum gradient amplitude of 45 mT/m, a slew rate of 200T/m/sec, a rise time of 200 µsec; for 1.5T MR a maximum gradient amplitude of 45 mT/m, a slew rate of 200T/m/sec, a rise time of 225 µsec; for 3T MR. A single dose (0.1 mmol/kg) of a gadolinium agent (Uniray, gadoterate meglumine; Dongkook Pharmaceutical Co., Ltd, Seoul, Korea) for 3T MR and a double dose (0.2 mmol/kg) for 1.5T MR was injected at a flow rate of 2.0 mL/s followed by a saline flush of 20 mL at the same rate. After reviewing each patient's previous CMRs, one radiologist selected a representative short-axis slice that best presented the LGE of infarcted myocardium in advance, and the selected short-axis slice was identically conducted at both 3T and 1.5T MR systems at 10, 15, and 20 minutes after contrast administration. Optimal inversion time (TI) was determined using a TI scout (for 1.5T MR, a TR/TE of 28 msec/1.4 msec, a flip angle of 35°, a field of view of 318 × 340 mm, an image matrix of 192 × 90, and a slice thickness of 8 mm; for 3T MR, a TR/TE of 23 msec/1.1 msec, a flip angle of 30°, a field of view of 376 × 340 mm, an image matrix of 192 × 78, and a slice thickness of 8 mm), adjusted to obtain the maximal contrast between the viable and infarcted myocardium on each temporal scan (TI range for 1.5T: 10 minutes, 250–290 msec; 15 minutes, 250–310 msec; 20 minutes, 300–330 msec, and TI range for 3T: 10 minutes, 400–450 msec; 15 minutes, 420–470 msec; 20 minutes, 450–480 msec).
MR Image Analysis
Image Quality Assessment
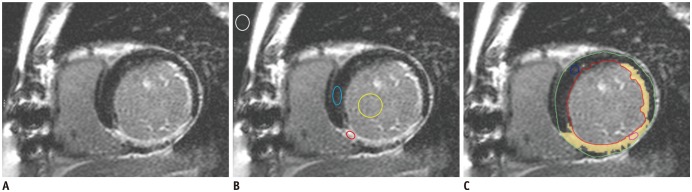
Two independent, experienced observers (with 10 years and 4 years of experience in CMR interpretation, respectively), blinded to field strength and dosage of gadolinium contrast agent, measured mean signal intensities (SIs) of circular regions of interest (ROIs) placed in the infarcted myocardium, remote normal myocardium, and LV cavity on single short-axis magnitude images. Noise was derived from standard deviation (SD) of SI of a ROI with an area of approximately 350 mm2 in the background air (Fig. 1). The location of the ROIs was identical using copy-and-paste tool on both 1.5T and 3T MR images. SNR was defined as mean SI of each region divided by noise. The CNRinfarct-normal was calculated using the following equation: CNRinfarct-normal = (SIinfarcted myocardium - SInormal myocardium) / noise. The CNR between infarct and LV cavity (CNRinfarct-LVC) was calculated using this following equation: CNRinfarct-LVC = (SIinfarcted myocardium - SILVC) / noise). All measurements were conducted on a picture archiving and communication system workstation (PACS; Infinitt, Seoul, Korea).
Infarct Size Quantification
Two observers, blinded to field strength and dosage of gadolinium contrast agent, measured the area of LGE on magnitude images by means of the 6-SD threshold method using a dedicated semiautomatic analysis program (CMR42 Version 4.1; Circle Cardiovascular Imaging Inc., Calgary, Canada) (Fig. 1) (1415). Papillary muscles and trabeculations were included into the LV cavity. Relative infarct area was expressed as a percentage of the LV myocardium area.
Statistical Analysis
Data are expressed as the mean ± SD. Quantitative results of the two examinations were compared using the paired two-tailed Student t test as the data revealed normal distributions after the Kolmogorov-Smirnov test. Inter-observer reproducibility for the measurement was evaluated using intraclass correlation coefficients (ICCs) generated by a two-way random-effects model with an absolute agreement definition and by Bland-Altman analysis. In accordance with Landis and Koch (16), the following ICC interpretation scale was used: 0.00–0.20, slight; 0.41–0.60, moderate; 0.61–0.80, substantial; and 0.81–1.00, almost perfect. All statistical analyses were conducted using SPSS version 17.0 (SPSS Inc., Chicago, IL, USA). Differences were significant when the p value was less than 0.05.
RESULTS
Details of demographic and clinical characteristics of all patients are listed in Table 1. Scanning at both field strengths was well tolerated by all patients, and all images were deemed of sufficient quality for analysis. Neither a problem with breath-holding nor electrocardiographic gating was encountered.
Image Quality Assessment
There were no significant differences in mean values between measurements of the two observers (p > 0.05, each) and correlation between two datasets was excellent for each measurement (r = 0.817–0.967; p < 0.05) (Supplementary Table 1 in the online-only Data Supplement). Thus mean values of both observers' measurements were used for further calculations.
Despite usage of only single-dose gadolinium, mean SIs of the three anatomical regions were higher at each temporal scan at 3T MR than at 1.5T MR using a double dose, albeit without statistical significance (all, p > 0.05) (Supplementary Table 2 in the online-only Data Supplement).
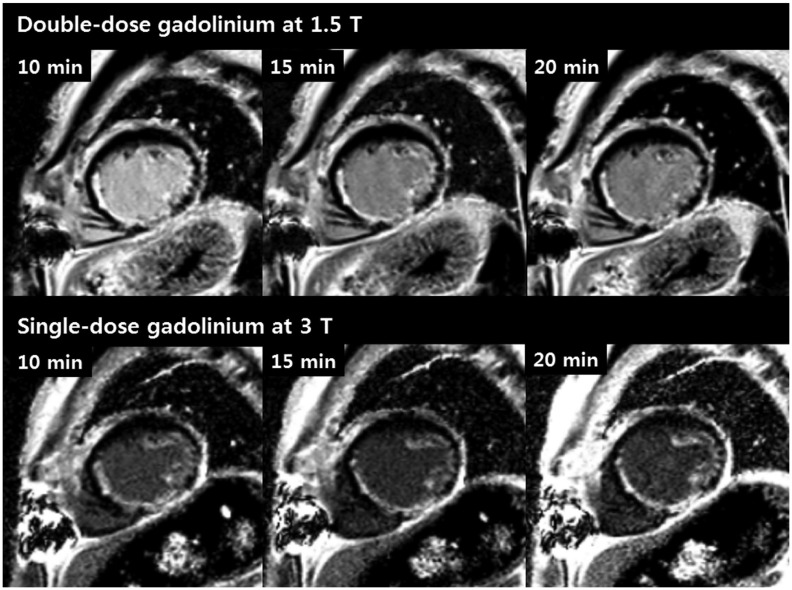
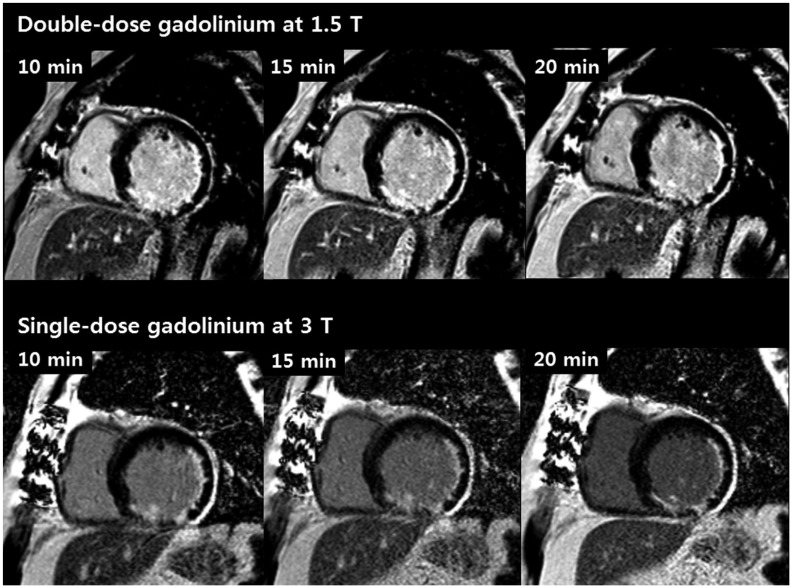
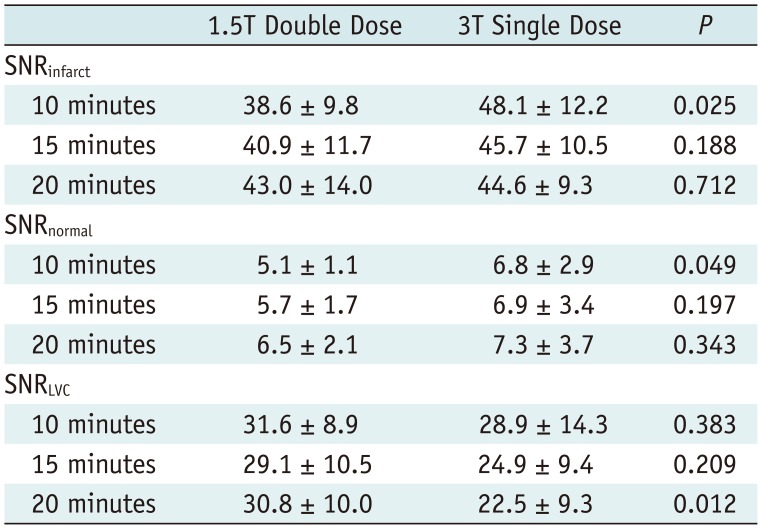
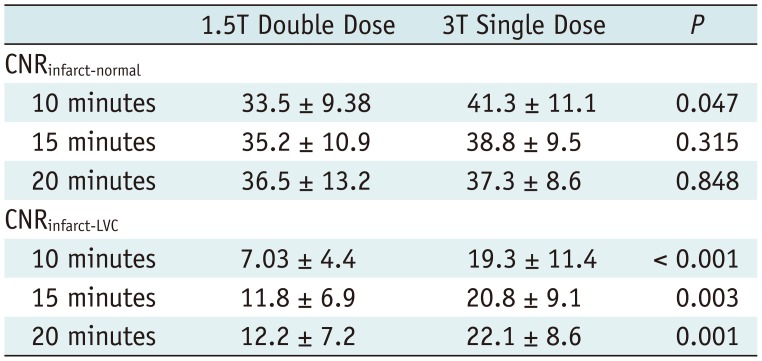
Table 2 revealed that there was no significant difference in most SNRs of three different regions including the infarcted and normal myocardium and LV cavity between the two examinations at most temporal scans (all, p > 0.05, except for SNRenhanced and SNRnormal at 10 minutes, and SNRLVC at 20 minutes). In terms of the CNR between infarcted and normal myocardium, a significant difference between the two examinations was revealed only at 10-minute scans (p = 0.047) (Table 3). Conversely, the CNR between infarcted myocardium and LV cavity was significantly higher at single-dose 3T MR at all temporal scans, compared to double-dose 1.5T MR (all, p < 0.05) (Table 3). Representative cases are exhibited in Figures 2 and 3.
Relative Infarct Area Quantification
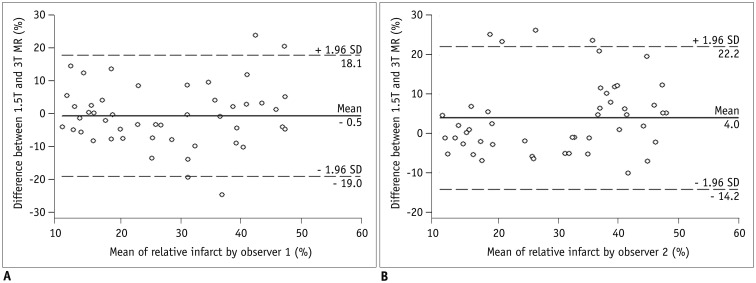
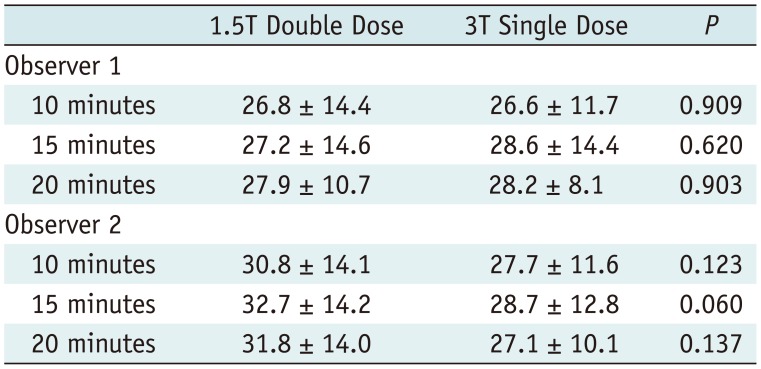
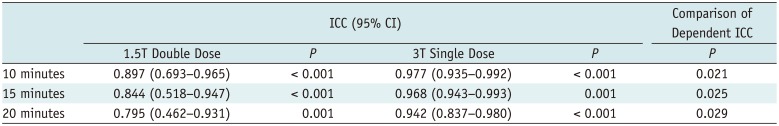
There were no differences in the relative infarct area between double-dose 1.5T MR images and single-dose 3T MR images (Table 4) for both observers. Table 5 summarizes the ICC values between observers 1 and 2 regarding inter-observer reproducibility for quantification of relative infarct area. Inter-observer agreement for infarct quantification at single-dose 3T images was significantly better than in double-dose 1.5T images (all, p < 0.05) (Table 5). Bland-Altman analysis (Fig. 4) revealed that both MR examinations revealed good agreement in measuring relative infarct area for observer 1 (mean bias, −0.5 ± 10.8%, range −19.0–18.1%) and observer 2 (mean bias, 4.0 ± 9.2%, range −14.2–22.2%).
DISCUSSION
Our study demonstrates the feasibility of single-dose 3T MR compared to double-dose 1.5T MR. The principal findings from our results can be summarized as follows: 1) CNR between infarcted and normal myocardium at 3T using single-dose gadolinium contrast was comparable to that of 1.5T using a double-dose gadolinium contrast. 2) CNR between infarcted myocardium and blood cavity was significantly higher at all temporal scans of 3T MR using single-dose contrast. Furthermore, 3) regarding the quantitative assessment of relative infarct area, 3T MR using single dose revealed nearly perfect ICC values with significantly better inter-observer agreement than 1.5T MR using a double dose.
It has been previously revealed that CMR with LGE at higher magnetic field strength can be beneficial for evaluation of myocardial viability, with notable improvement in image quality over 1.5T (10). One of the most appealing advantages of imaging at 3T MR is two-fold gain in SNR (9). T1 shortening effect of gadolinium agents can become more heightened owing to prolongation of T1 of the normal myocardium at 3T (9). Accordingly, increased efficacy of administrated gadolinium agents at 3T allows reduction in the amount of contrast agent that can be administered, in theory, without deteriorating image quality.
Previously, MR studies using single-dose gadolinium at 3T have been validated in the field of angiography (1718) but there have been no validated studies for evaluation of myocardial infarction to date. Similar to the design of our study, Herborn et al. (18) compared single-dose contrast-enhanced MR angiography at 3T with double-dose contrast-enhanced MR angiography at 1.5T intra-individually, and they proved the difference in mean image quality was statistically insignificant. Kramer et al. (17) demonstrated the feasibility of single-dose, time-resolved contrast-enhanced three-dimensional MR angiography in assessment of abdominal aorta and its major branches at 3T.
Interestingly, according to our results, even though we reduced the dose of gadolinium contrast agents by half when conducting 3T MR imaging, all SIs of the infarcted and normal myocardium and LV cavity at each temporal scan were higher than those of 1.5T double-dose images. This result can be attributed to increase in SNR at 3T (9), and prolonged T1 relaxation time of the normal myocardium with increase in efficacy of the T1 shortening effect of gadolinium agents, thereby, maximizing the signal difference between normal and infarcted myocardium (1112). However, MR imaging at 3T has disadvantages such as inherently stronger off-resonance artifacts (B0-field inhomogeneity) and dielectric shading artifacts (B1-field inhomogeneity).
These factors result in significant dark band artifacts and loss of tissue contrast on steady-state free precession pulse (SSFP) sequences and signal loss on spin echo pulse sequences that are unpredictable (919). Conversely, IR spoiled gradient echo sequences for late gadolinium enhancement imaging with use of standard inversion pulses is more sensitive to inhomogeneous B1 fields than SSFP sequences because non-uniform flip angles resulting from dielectric effect lead to uneven myocardial nulling. To overcome this limitation, we used a dielectric pad and it enabled reducing the B1 shading artifact at the conventional 3T system. In this study, IR spoiled gradient echo sequences were used in both examinations, and significant dark band artifacts and uneven myocardial nulling were not observed in both image data sets.
Conventional use of a double dose of contrast agents is used today as LGE was originally validated in animal experimental studies using a double-dose gadolinium and subsequent clinical studies were conducted using the same dose, establishing substantially higher image quality and diagnostic accuracy (2320). However, it is critical to note that gadolinium-based contrast agents may trigger development of an extremely rare but serious complication, NSF. Many publications have proven the dose-related association between gadolinium-based contrast agents and NSF (567). In this regard, reduction of gadolinium provided by single-dose 3T MR, yet with comparable or even superior performance, is of clear clinical significance.
Of the various gadolinium-chelate contrast agents, gadoterate meglumine (Gd-DOTA) has the highest thermodynamic stability (log10 Ktherm = 25.6), apparent stability (log10 Kcond = 19.3), pharmacokinetic stability, and decomplexation (2122). Uniray (gadoterate meglumine, Dongkook Pharmaceutical Co., Ltd.), used in our study, is a macrocyclic ionic gadolinium-based contrast agent as well as a generic agent of Dotarem (gadoterate meglumine, Guerbet, Roissy CdG, France). It is safe even in high-risk patients with impaired renal function and so far, no validated cases of NSF have been documented, solely attributed to Gd-DOTA (2223). In this study, none of the study patients revealed signs of NSF or other adverse effects until now. One comparative study between macrocyclic gadolinium-based agents revealed that gadobutrol (Gadovist; Bayer Healthcare, Berlin, Germany) has better T1 relativities than Gd-DOTA, and provided significantly higher CNR with one and half dosage, compared to double dosage of Gd-DOTA (24).
There is another major concern in terms of usage of a double-dose gadolinium contrast agents of brightened blood cavity leading to obscuration of subendocardial infarctions (1). This is a critical obstacle in the detection of subendocardial infarctions and in estimation of exact infarct size as some parts of subendocardial infarctions may be misinterpreted as a part of the LV cavity. According to a recent study reported by Kim et al. (25) that compared LGE images using single-dose versus double-dose 1.5T MR, they reported that the CNR between infarcted myocardium and LV cavity exhibited a negative value when a double dose of gadolinium was used, indicating that blood in the LV cavity was much brighter than the infarcted myocardium. Similarly, as we had initially hypothesized, the CNR between the infarcted myocardium and LV cavity was significantly and persistently higher at all temporal scans at 3T MR using single dose than at 1.5T MR using a double-dose contrast.
This improved contrast between the infarction and LV cavity at single-dose 3T MR may have led to significantly better inter-observer agreement we observed for infarct quantification compared to double-dose 1.5T MR. Besides reduction of contrast dosage, other technical approaches have been made to improve contrast between infarct and blood cavity with nulling of the blood signal: Flow-Independent Dark-Blood DeLayed Enhancement sequence (26) and standard double-inversion dark-blood imaging (827).
We recognize that this study has several limitations. The major limitation of our study is that it is a single center study with a relatively small population. However, we believe that significant differences in CNR between infarcted myocardium and LV cavity were successfully observed between the two groups. Several prior reports with similar design to ours revealed significant results using a small population: 16 subjects for the comparison between 1.5T and 3T LGE CMR using the same single-dose contrast in both groups (13), 13 (28) and 20 subjects (15) for the comparison between single-dose and a double-dose gadolinium contrast at 1.5T LGE CMR, and 23 subjects for comparison between single-dose 3T and a double-dose 1.5T MR angiography (18). We found that only 13 patients were needed to establish a power of 82% and 16 patients, a power of 90%, based on data from the previous study of Kim et al. (25). Considering our study design of a prospective intra-individual comparison, a smaller population could be needed. Second, to maintain the patent cohort uniformly, we only included patients diagnosed with chronic myocardial infarctions confirmed through previous MR studies. Thus, as the pathologic condition and patient statuses are different between acute and chronic myocardial infarctions, our results cannot be extrapolated to patients with acute myocardial infarctions. Third, we did not evaluate diagnostic accuracy nor detectability of LGE, as presence of LGE regions was confirmed on previous MR examinations in all patients recruited in our study. Fourth, magnitude images we analyzed for evaluation of image quality are sensitive to TI values. Therefore, to minimize error in selecting precise nulling time, we determined optimal nulling time using TI scouts only a few seconds prior to every temporal scan. Phase-sensitive inversion recovery (PSIR) images could not be used as a solution since PSIR reconstruction fundamentally implements the process of spatial smoothing to reduce the noise of reference images, and thus the value of noise on PSIR images would not indicate true value (20). Fifth, signal, contrast, and image quality are heavily influenced by contrast dosage and field strength itself as well as several other parameters affected by change in field strength. The latter includes longitudinal and transversal relaxation times (T1 and T2) of tissues, artifacts from off-resonances and B1 field inhomogeneity, radiofrequency (RF) coil design, and pulse sequence adjustments that may be required due to safety constraints regarding allowable energy deposited into the body from the RF pulses (9). For these reasons, a two-fold increase in SNR at 3T may not be reproducible in human studies. Last, we used MR parameters optimized for clinical examinations in daily routine practice. In clinical setting, at a 1.5T MR scanner, we use a higher receiver bandwidth than 3T machine. Thus, TR and TE at 1.5T is slightly longer than 3T machine and we used a larger flip angle to improve the CNR. Different parameters including TR, TE and flip angle may affect image quality. However, we believe that our data are meaningful even though parameters for 1.5T are more favorable to increase in SNR and CNR, CNRs are better at 3T with single dosage of contrast than 1.5T with a double dosage of contrast.
In conclusion, LGE imaging at 3T MR using a single-dose gadolinium provides better contrast between the infarct and blood cavity without reduction of contrast between infarcted and non-infarcted myocardium compared to 1.5T MR using a conventional double dose in patients with chronic myocardial infarction. LGE imaging at single-dose 3T MR revealed significantly better inter-observer agreement for infarct quantification. Therefore, 3T LGE imaging using single dose of gadolinium is expected to better delineate subendocardial infarctions by reducing the signal of the LV cavity.
 XML Download