

 PDF
PDF ePub
ePub Citation
 Print
Print


INTRODUCTION
Cardiovascular magnetic resonance (CMR) has emerged as a valuable tool for imaging cardiovascular system in small animals due to its non-invasiveness with relatively high spatial resolution and sensitivity of soft tissue contrast for radiation (1). Cine imaging in CMR is used routinely to assess the function of the heart (23). Late gadolinium enhancement (LGE) imaging is now a gold standard for the detection of myocardial infarction (MI) (4). Nevertheless, there are considerable experimental limitations to apply CMR in small animals (5). For example, it is difficult to apply CMR of clinical MRI system to small animals partly due to their rapid heart and respiratory rates (6). Under anesthesia, heart rates of rats may vary from 400 to 600 beats per minute (789) while their respiratory rates may vary from 30 to 60 per minute. External QRS-complex detection device is generally utilized for electrocardiography (ECG) gated CMR (10). However, heart rate depends on respiratory patterns, types of breath-holds (1112), and nervous feedback loops (12). Moreover, ECG signal is typically compromised by magneto-hydrodynamic (MHD) effect (i.e., when blood flows through the static magnetic field, it generates electrical fields that can corrupt the measurement of cardiac tissue depolarization) (13). At ultrahigh field like 7T, the susceptibility of ECG recordings to MHD effects is further pronounced (14). Rapid switching of magnetic field gradients with radio frequency (RF) magnetic field pulsing is another factor that can induce electrical fields superimposed on ECG signal (15). Therefore, irregular ECG gating can cause varied repetition time (TR) and affect the recovery of longitudinal magnetization between TR periods (16). This effect is even worse at higher field strengths, resulting in severe cardiac motion artifacts (17).
To address such problem associated with irregular ECG gating, a solution has been proposed and optimized with navigator-based retrospective gating technique called self-gated (SG) imaging approach (18). Navigator signals were acquired along with image data. A trace representative of respiratory motion and cardiac motion can be reconstructed by utilizing changes in MR signal. Navigator signals are retrospectively used to determine cardiac and respiratory cycles, allowing MRI k-space data to be reorganized and reconstructed retrospectively, thus producing cardiac images that are free of motion artifacts without the need for ECG or respiration sensors (319). This technique can eliminate failed-ECG deficits by extracting motion synchronization signal directly from the same MR signal used for image reconstruction. A cardiac and respiratory SG cine CMR has also achieved cine images in small animals without any external ECG or respiration gating (18). Another study has reported that SG method is suitable for cardiac MRI in mice with myocardial infarcts to evaluate infarcted murine heart function (20). However, to the best of our knowledge, no study has assessed SG cine sequence in 7T MRI system to assess myocardial infarct size with LGE imaging. In this work, SG cine CMR techniques were evaluated and optimized to assess MI in a myocardial ischemic/reperfusion rat model commonly having ECG-gating failure (21).
MATERIALS AND METHODS
Animal and Experimental Protocol
The local Institutional Animal Care and Use Committee approved all animal procedures involved in this work. Ten Sprague Dawley rats (males, aged 7–10 weeks) were obtained from Dashuo Animals, Ltd. (Chengdu, China). After being anaesthetized with chloral hydrate (i.p., 0.3 mL/100 g), they underwent surgery to induce MI. The left anterior descending coronary artery was occluded close to its ostium with a snare occluder for 45 minutes. It was then released for reperfusion. Following a visual verification of efficiency of reperfusion, the chest was closed. At 24 hours after the reperfusion, these animals were placed in a 7T MR scanner. Anesthesia was maintained during the whole MR experiment with 1.5% (v/v) isoflurane in oxygen (0.8 L/min) delivered via a nose-cone at a 1 L/min flow rate. Temperature was maintained at 36–37.5℃ with a heating pad and monitored using a rectal probe to preserve normothermic conditions during MR experiment. The forelimb and hind-limb of rats were wrapped in a copper foil. Peripheral ECG signal was derived via a silver wire. Core body temperature, ECG, and respiration were monitored with an SAII Model 1030 monitoring and gating system (Small Animal Instruments, Inc., Stony Brook, NY, USA). After acquiring post-MI images, rats were sacrificed for triphenyl tetrazolium chloride (TTC) staining to determine the size of MI.
MRI
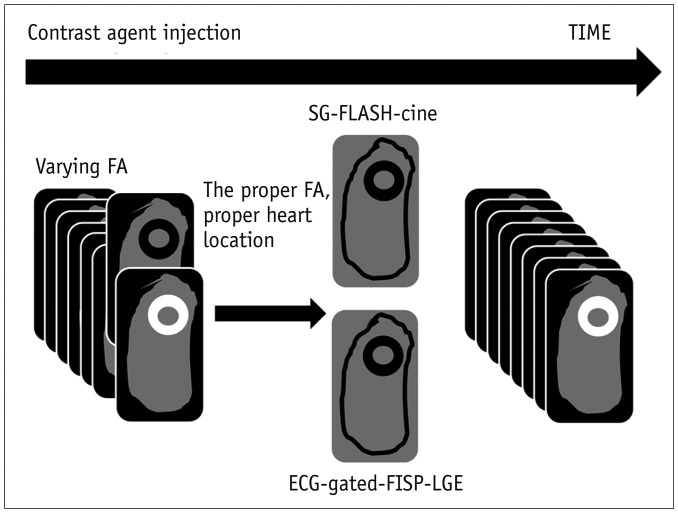
All MR acquisitions (Fig. 1) were performed with a 7T system (BRUKER BIOSPEC 70/30, Ettlingen, Germany). A birdcage coil with an inner diameter of 72 mm was used for RF excitation and an array surface coil of 56 mm was used for MR signal reception. Scout imaging was first acquired using gradient-echo sequence to localize short-axis images at the middle level of the left ventricle (LV). For delayed contrast enhancement, 0.6 mmol/kg (1.2 mL/kg) gadobenate dimeglumine was injected via an intravenous route for rats (tail vein) following the initial baseline scanning. All rats were covered with heating pad to keep the temperature stable.
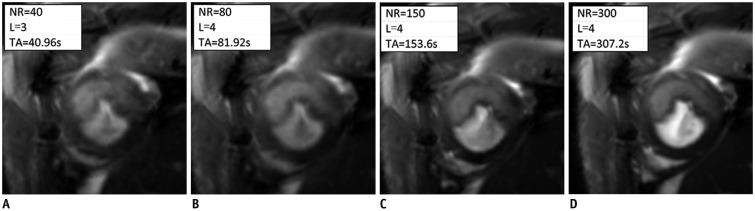
IntraGate fast low angle shot MRI (FLASH), an SG cardiac cine sequence, was used to image LGE in a short-axis view (Fig. 1). Six slices covering the heart from the base to the apex were obtained to evaluate myocardial infarct size after contrast agent was injected. The following sequence parameters were used: TR = 8.0 ms; echo time (TE) = 3.0 ms; flip angles (FAs) = 10°, 15°, 20°, 25°, 30°, 35°, 40°, 60°, 70°, or 80°; field of view (FOV) = 50 × 50 mm; matrix size = 256 × 256; slice thickness = 1.5 mm; and numbers of repetitions (NRs) per slice = 40, 80, 150, or 300. Cine movies with 10 frames per slice were reconstructed retrospectively. Total acquisition times (TAs) varied from 41 to 307 seconds.
As a reference, an ECG-gated fast imaging with steady-state precession (FISP) sequence along with a respiration trigger model was used to acquire LGE images with six slices. Imaging parameters were: TR/TE = 5.1/1.8 ms, FA = 25°, slice thickness = 1.5 mm, FOV = 50 × 50 mm, matrix size = 256 × 256, and the number of signal averages = 2. Total average TA was 220 seconds.
Data Analysis
Two independent observers with five years of experience each in CMR diagnosis who were blinded to imaging parameters and types of sequences visually scored the diagnostic quality of LGE images and delineated the infarcted area. The final infarcted region was defined as the average size measured by two observers. It was expressed as a percentage of the LV. These images were presented to the two observers in a random order. The overall image quality was scored based on a 4-point Likert scale (1 = poor, non-diagnostic; 2 = fair, diagnosis may be impaired; 3 = good, some artifacts but not interfering diagnosis, and good-contrast between normal and infarct myocardium; 4 = excellent, no artifact and excellent-contrast between normal and infarct myocardium). Intra-class coefficient and 95% confidence intervals were calculated to evaluate the concordance between the two types of image scores. A coefficient of 0.7 to 1 indicated good agreement. Infarcted size (%LV) with changed FA and NR were analyzed with one-way analysis of variance (ANOVA). Statistical significance was considered at p < 0.05. Quantitative variables are reported as means ± standard deviation (SD). All computations were performed with SPSS version 22 (IBM Corp., Armonk, NY, USA).
Signal intensity in each scar and tissue (SI_scar and SI_tissue) was estimated from the mean value in a region of interest from infarction region and normal myocardium tissues, respectively. Noise was estimated as SD (SD_noise) from a region free of artifact in the background where there was no signal. The equation of contrast-to-noise ratio (CNR) is shown as follows.
CNR = (SI_scar – SI_tissue) / SD_noise
RESULTS
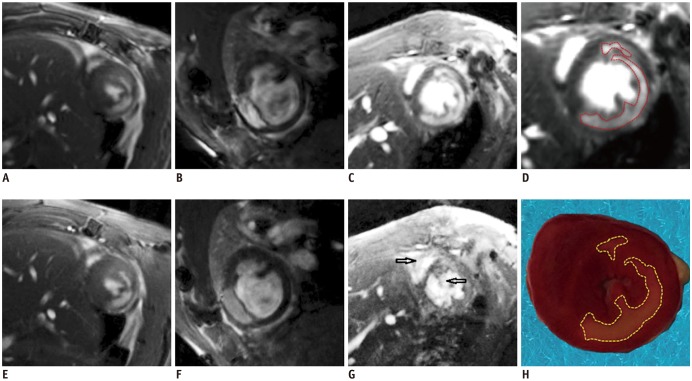
Rats that received surgery were all successfully imaged, revealing enhancement in both SG images and ECG with respiration double-gated images. This was confirmed by TTC staining. Six out of ten rats showed irregular ECG-gating with interferences. SG-LGE images were successfully obtained for all rats free of interferences. Representative short-axial LGE images acquired with SG and ECG-gating are shown in Figure 2. Images with excellent-contrast between normal and infarct myocardium without artifacts could be obtained from ECG-RESP-gating sequence if both ECG and respiration signals are well-triggered (Fig. 2). However, ECG-RESP-gating images suffered from irregular ECG-gating resulting from a large cardiac motion. In contrast, SG scans resulted in artifact-free depiction of MI regardless of the quality of ECG gating (Fig. 2). Size, shape, and location of these MI matched well with those revealed by TTC staining (Fig. 2).
Image Quality
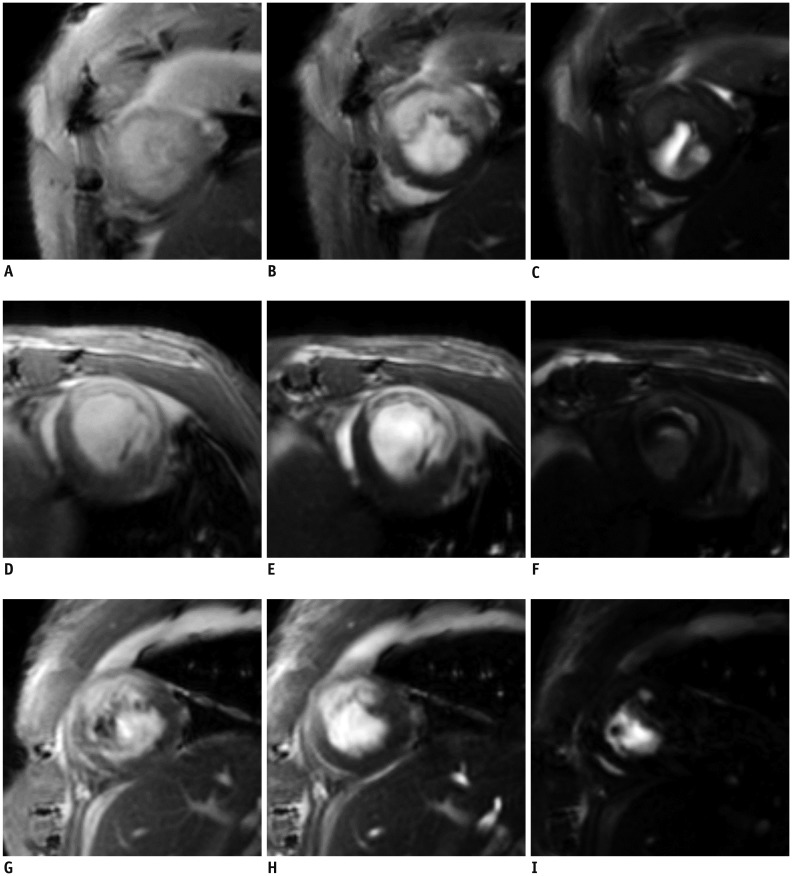
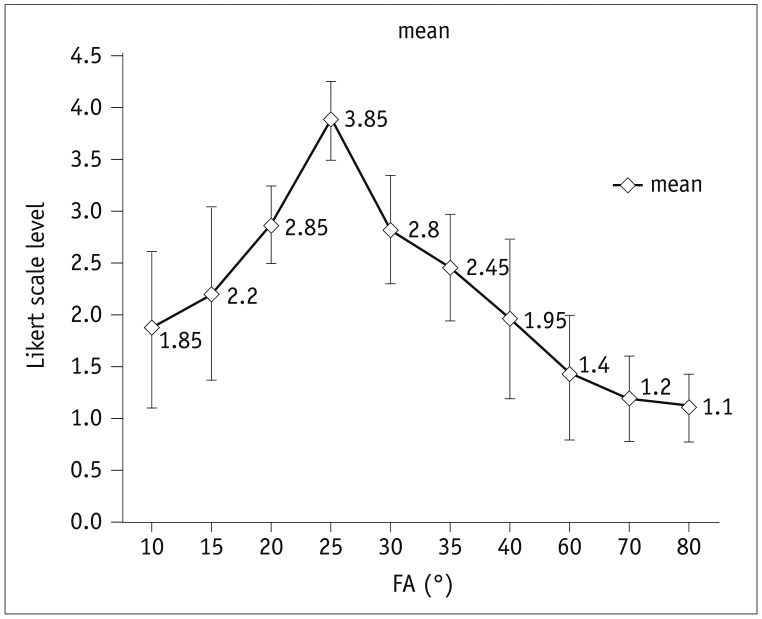
Various FA resulted in different contrast images (Fig. 3). Using FAs of 20°–30°, optimal image contrast was generated between the infarcted myocardium and the remote myocardium. However, when FA was increased up to 80°, some anatomic and functional information was lost, such as contrast and boundary in 80% (8/10) of rats (Fig. 3). Moreover, higher FA resulted in more irregular ECG and respiration gating. The image quality score was preferable when FA was at 20°–30° (Fig. 4). Kappa Cohen coefficient was 0.944 (range, 0.917–0.962) in Likert scale obtained from the two observers, indicating an excellent agreement between them. One-way ANOVA revealed no significant differences in infarcted size (%LV) for various FAs ranging from 10° to 40°. When FAs were increased up to 60°–80°, distinguishing the infarcted size (%LV) was difficult sometimes.
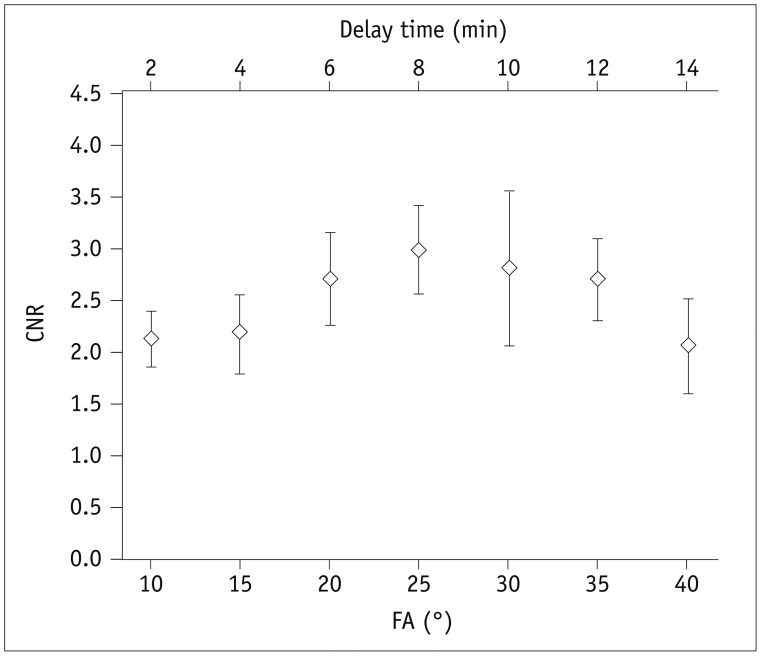
One-way ANOVA results showed no significant differences in image scores for different NRs (Table 1). Increasing NR (40, 80, 150, and 300) resulted in increase of TA (41, 82, 154, and 307 seconds, respectively) with the SG-LGE method (Fig. 5). The shortest TA was 41 seconds when NR was set at 40. This was much shorter than the TA when conventional ECG-RESP-gating FISP sequence was used (220 seconds). To reconstruct SG-LGE images with various FAs of 10°–80°, images data were acquired. Only central repetitions without disturbances were utilized, similar to fMRI data reconstruction. Given the relatively large difference in Likert scale score between NR of 80 and NR of 40 (Table 1), optimal NR was recommended to be 80. Since distribution of contrast agent in scar and tissue varied with increasing delay time, both delay time and FAs were critical factors that affected CNRs of SG-LGE images. Due to sequence preparation and TA, it took about 2 minutes to obtain SG-LGE images with varied FAs for each SG scan. FA (bottom x-axis) was 10°, 15°, 20°, 25°, 30°, 35°, and 40°, corresponding to delay time (top x-axis) of 2, 4, 6, 8, 10, 12, and 14 minutes, respectively (Fig. 6). Based on analysis of SG-LGE images, CNR (42.5 ± 5.5, 43.5 ± 7.5, 54 ± 9, 59.5 ± 8.5, 56 ± 13, 54 ± 8, and 41 ± 9) and image quality score (1.85 ± 0.75, 2.20 ± 0.83, 2.85 ± 0.37, 3.85 ± 0.52, 2.8 ± 0.51, 2.45 ± 0.76, and 1.95 ± 0.60) were achieved with different FAs (10°, 15°, 20°, 25°, 30°, 35°, and 40°, respectively).
DISCUSSION
In LGE CMR, an inversion recovery sequence is usually employed to differentiate hyperintensity of infarcted tissue from the adjacent hypo-intensity of normal tissue (2223). Inversion time is adjusted to null normal myocardial signals (24). In other pre-clinical studies, cine LGE CMR represents an attractive alternative to inversion recovery-based LGE CMR for assessing infarct size in mice at high field strengths (7T) (25). Previous studies have evaluated different imaging sequences to assess cardiac function and infarcted size in animal studies (518). Some approaches such as real-time imaging techniques have been developed to avoid failed-ECG gating in images acquisition (26). However, they failed to reveal spatial and temporal resolution provided by segmented acquisition techniques. Several studies have already demonstrated that SG technique can eliminate artifact that irregular ECG-gating technique suffers from (22127). Another study has investigated the benefit of motion-based reconstruction for retrospective cardiac cine in small-animal studies using B-spline-based compressed sensing method based on SG sequence (2). It has been suggested that ECG gating can be superseded using SG imaging techniques when cardiac trigger is extracted directly from MR measurement data (28). To the best of our knowledge, our work is the first effort to investigate the feasibility of using SG technique to detect myocardial infarct size in rat models at 7T MRI. By the method reported in this paper, high quality cine LGE images can be consistently obtained even when ECG-gating fails to trigger correctly inside the cardiac cycle secondary to MI. This study showed that FAs of 20°–30° could be used to create optimal image and contrast between normal and infarcted myocardium tissue. The best FA to obtain optimal contrast depends on each rat condition. In addition, the optimal NR for rats was 80, which was long enough to produce images of quality necessary for diagnostic purposes.
It is imperative that FA plays an important role in image acquisition. In contrast-enhanced T1-weighted three-dimensional (3D) spoiled gradient-echo sequences, higher FA at 30° can result in optimal contrast between tissue and lesions and improve detection and conspicuity of lesions (29). In cine sequences, T1-weighted image contrast is also strongly affected by sequence parameters TR and FA (30). The signal-to-noise ratio and CNR may be optimized by adjusting the excitation FA (30) when TR is fixed. De Naeyer et al. have confirmed that optimizing FA could increase the reproducibility of kinetic parameter estimates in dynamic contrast-enhanced MRI studies (31
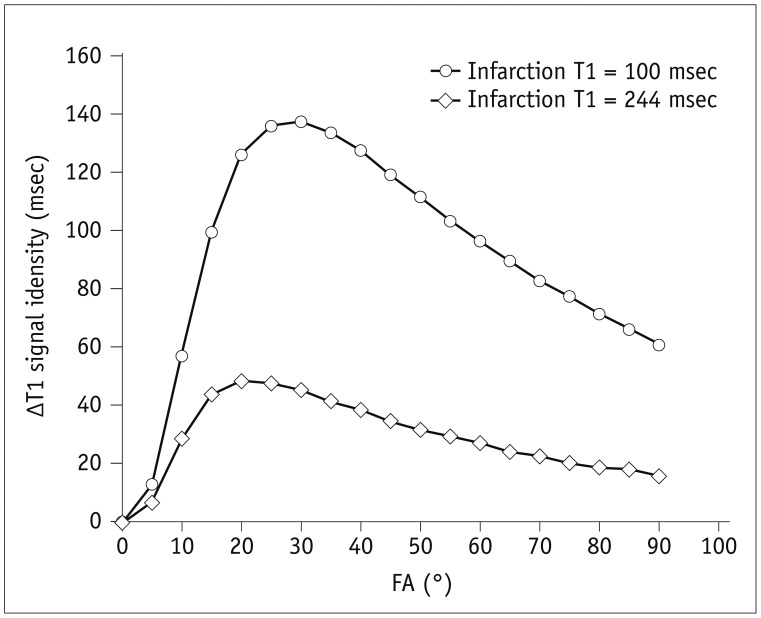
32). At 1.5T and 3T, optimal excitation angle of 20° for FLASH has been recommended (33). In our research, FAs of 20°–30° are recommended to achieve optimal contrast between infarcted and normal myocardium tissues. This observation is also supported by the following simulation. Based on a previous report on a rat study at 7T (34), the non-contrast myocardial T1 was measured at approximately 1636 msec while the post-contrast normal myocardial T1 was measured at 969 msec. The post-contrast infarction region was measured at 488 msec when 0.2 mmol/kg gadolinium was administered (34). If a 0.6 mmol/kg gadolinium was injected as in our study, assuming a uniform distribution of the contrast media within the rat body and a relaxivity r1 of 3 msec−1, the post-contrast normal myocardial T1 would be 488 msec. Because myocardial T1 in the infarction region is approximately less than half of the normal myocardial tissue (34), we can assume that T1 in the infarction region varies from 100 msec to 244 msec. Based on signal equation of gradient-echo sequences, deviations of T1 values between normal myocardium and infarction regions can be plotted as a function of FA (Fig. 7). The maximal contrast can be achieved with an FA of 20° to 30°, depending on T1 values of infarction regions. Moreover, our study consistently revealed that the maximal quality of contrast could be acquired individually with an FA of 20° to 30° depending on the scanning condition at the time. This means that FA is a vital parameter to obtain an optimal contrast between normal and infarcted myocardium.
Another important advantage of SG sequence is its relatively stable scanning time depending on repetition number rather than ECG-gating condition. NR is used to provide enough scans to extract cardiac and respiratory motion data for the reconstruction of desired cardiac- or respiration cine(s). However, increasing the NR after enough data acquired in SG sequence hardly had any effect on signal contrast, although it affected scan time and image quality associated with motion artifacts. In our study, it took the conventional ECG-gated sequence 3 minutes and 40 seconds to 8 minutes and 25 seconds to image of rats with MI depended on the ECG and respiration signal. With SG-LGE, the recommended 80 repetitions worked well for all rats at different heart rates and respiratory rates. It only spent 1 minute and 21 seconds to acquire the image, which was much less than the traditional FISP sequence.
However, this study has some limitations. It is known that contrast concentration is reduced immediately in coronary artery due to blood circulation once we apply the injection via rat tail vein. This can lead to changes of contrast distribution in myocardium. Besides, previous researches have indicated that contrast is distributed in the extracellular space of normal myocardium but excluded from myocardial cell (35). On the other hand, the contrast medium is distributed in extra- and intracellular spaces after losing myocardial membrane integrity in the infarcted myocardium. For this reason, the infarcted myocardium shows both delayed wash-in and wash-out effects due to distribution in the large extravascular volume compared to normal myocardium. These areas will have higher signal intensities than other areas (35). Contrast distribution in normal myocardium seems to be more sensitive to reduction of contrast concentration in coronary artery during scanning. It might present an accumulated effect in infarcted myocardium. Klein et al (36). have demonstrated that LGE occurs at about 5–30 minutes after contrast application in the infarcted myocardium. Accordingly, we acquired SG-LGE images at 30 minutes after injection and calculated the CNR. We considered that CNRs were mainly influenced by varied FAs and the contrast in both normal and infarcted myocardium. We also hypothesized that the contrast concentration in the myocardium was related to the delay time. The delay time actually reflected both wash-in and wash-out kinetic effects of contrast distribution in normal and infarcted myocardium as well as the reduction of contrast in coronary artery. According to the equation for CNR calculation, the deviation of signal intensity between the normal and infarcted myocardium in our study was increased rapidly (delay time: 2 to 12 minutes, FAs: 10°–35°) after injection. Contrast might have remained at high level in the infarcted myocardium but reduced in the normal myocardium for the delayed wash-in and wash-out effects in the infarcted myocardium. In this duration, both FA and contrast contributed to the increase of CNR. After 12 minutes (delay time = 12 minutes, FA = 35°), FA may be the primary element that contributed to CNR. However, the recovery of longitudinal relaxation was not enough to generate signal in one TR with large FAs. Therefore, CNR became nearly unreliable. To estimate image quality with varied FAs, using mutable contrast by calculating CNR is unsuitable. In addition, we used the Likert scale of SG sequence to assess qualitative grade of images without calculating CNR with large FAs. Comparative results for infarction size between cine LGE sequence and TTC stains are withheld in the current study. They will be published with other data in the future.
In conclusion, SG cine sequence can acquire LGE images without adverse effects by irregular ECG and respiration gating. Optimal FAs of 20°–30° and NR of 80 are recommended to acquire high quality CMR images within 82 seconds. This finding can help us reliably detect MI in rat models. It will facilitate the evaluation of various treatment options to this important cardiac disease.

 XML Download