

 PDF
PDF ePub
ePub Citation
 Print
Print


INTRODUCTION
Coronary chronic total occlusion (CTO) is defined as a complete occlusion confirmed by coronary angiography over a period of 3 months, and its prevalence has been reported as being 20–30% (12). Successful CTO percutaneous coronary intervention (PCI) leads to angina relief, lower mortality, as well as improvement of left ventricular (LV) function (345). In the setting of CTO with chronic myocardial ischemia, the affected myocardium shows depressed contractility to compensate the insult, while the collateral circulation improves blood supply to areas of downstream myocardium, and is closely associated with regional wall motion (67). However, whether the collateral circulation plays a role in the prediction of functional recovery in CTO patients has not been studied.
Late gadolinium-enhanced cardiovascular magnetic resonance (CMR) is widely used to predict the likelihood of functional recovery after revascularization. Most studies use a cutoff value of less than 50% transmural extent of infarction (TEI) to identify recovery of regional function, and this technique has an overall accuracy of 70% (8). Unenhanced rim thickness (RIM) is the thickness of the epicardial myocardial area without late gadolinium enhancement (LGE), and serves as a baseline marker for predicting functional recovery, with the reported threshold ranging from 3.0 mm to 4.5 mm (910).
More recent studies have shown that the extracellular volume fraction (ECV) can be non-invasively measured based on native and post-contrast T1 mapping and reflects the size of the extracellular space. ECV quantification has been confirmed to be a robust tool for the identification of the extent of myocardial injury or degeneration in a variety of cardiac diseases (111213). Previous studies reported that the degree of degenerative changes in the dysfunctional myocardium determines the likelihood of recovery after revascularization (10), and the epicardial unenhanced rim showed greater relevance as a predictor of functional recovery (14). A greater degree of degenerative changes, manifested by replacement of cardiomyocytes by fibrosis, leads to the increased extracellular space (10), thereby increasing ECV. Based on these insights, the purpose of this study was to investigate the additional value of ECV derived from T1 mapping for prediction of functional recovery in comparison with standard CMR measurement. The second goal was to demonstrate the influence of collateral circulation on the functional recovery in CTO territories.
MATERIALS AND METHODS
Patient Population
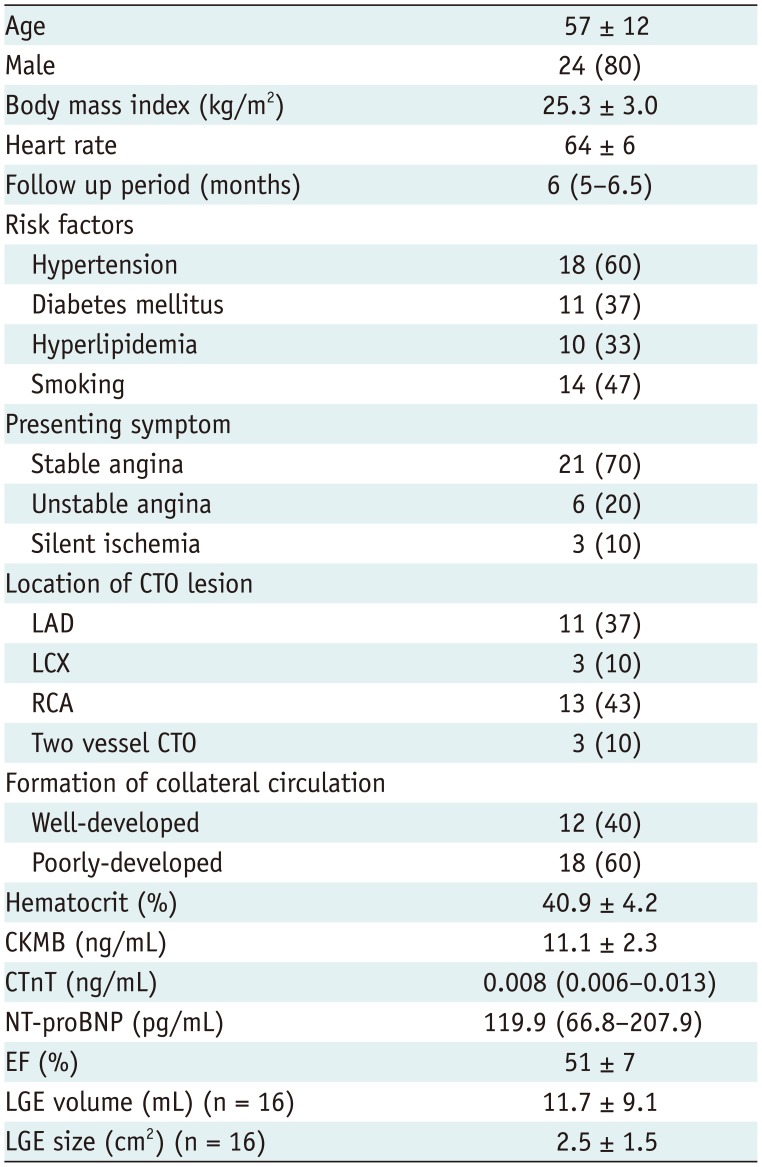
Our Institutional Review Board committee approved the study; all patients provided written informed consent. Between September 2013 and August 2015, patients with angiographically confirmed CTO scheduled for interventional cardiology procedures were prospectively enrolled. Exclusion criteria were as follows: myocardial infarction (MI) diagnosed within the last 3 months, arrhythmia, renal insufficiency, or contraindications for MRI. Fifty patients underwent CMR 12–48 hours before PCI. Of these, 38 patients had successful CTO-PCI, of whom eight refused to undergo reinvestigation. Finally, 30 patients {6 females, 24 males; mean age (standard deviation [SD]), 57 ± 12 years}, who had undergone baseline CMR, successful CTO-PCI, and follow-up CMR at 6 ± 1 months post-PCI were included in this study. PCI failure was associated with an inability to pass the guidewire through the occlusion in nine patients, failure to perform balloon intervention in 2, and failure to dilate the lesion in one patient. Venous blood sampling was conducted to measure hematocrit immediately prior to CMR. Some of the patients completing follow-up scans have been briefly described previously (15).
CMR
A clinical 1.5T Siemens MAGNETOM Aera scanner (Siemens Healthcare, Erlangen, Germany) was used for CMR procedures before and 6 months after PCI. Steady-state free precession (SSFP) cine MR imaging was performed. Imaging parameters were 2.5/1.1 ms, 80° flip angle, and Generalized Auto-calibrating Partially Parallel Acquisition (GRAPPA) with an acceleration factor of 2. T1 time was measured using an ECG-gated modified Look-Locker Inversion Recovery (MOLLI) sequence acquired in the basal, mid-ventricular, and apical short-axes before and 15 minutes after administration of 0.2 mmol/kg gadopentetate dimeglumine (Magnevist; Bayer AG, Berlin, Germany). Pre-contrast MOLLI protocols were based on two inversions and a 5- and -3 sampling scheme with three additional heartbeats for recovery between inversions. The post-contrast MOLLI sequences used three inversions and a 4-3-2 sampling strategy with an additional heartbeat for recovery. A non-selective inversion pulse with single-shot SSFP readout was conducted during MOLLI sequences. Specific imaging parameters included repetition time (TR)/echo time (TE)/flip angle of 2.3 ms/1.1 ms/35°, 360-mm field of view, 8-mm slice thickness, 120-ms minimum inversion time (TI), 80-ms TI increment, partial Fourier 7/8 reconstruction, and GRAPPA with a parallel acquisition factor of 2. Finally, LGE images were acquired 10 minutes post-injection of contrast agent using a breath-hold segmented phase-sensitive inversion recovery sequence (TR/TE/TI/flip angle/voxel size: 11 ms/3 ms/300 ms/25°/1.3 × 1.3 × 8 mm3). To ensure similar slice positioning, care was taken to align the most basal section of the short-axis stack to the level of the mitral annulus in the end diastole both for baseline and follow-up scans. Slice positions of T1 mapping were matched by copying the respective positions of the acquired cine images.
Coronary Angiography
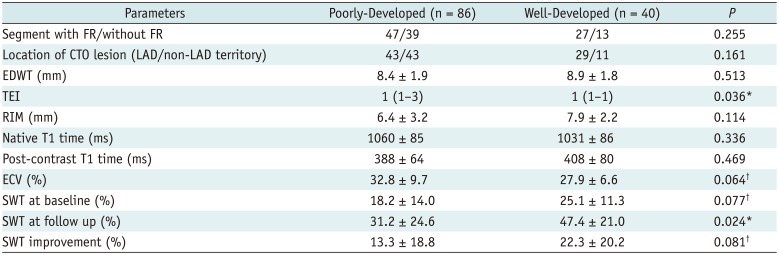
Collateral circulation was graded using Rentrop classification (0 = no collateral flow; 1 = filling of side branches; 2 = partial filling of the epicardial segment of the occluded vessel; and 3 = complete filling of the epicardial segment) (7) by an experienced cardiologist who was blinded to the clinical details and CMR results. To compare segmental differences, the collateral circulation was divided into poorly developed (grades 0–2) or well-developed (grade 3) collaterals.
Image Analysis
Images were analyzed using cvi42 software (Circle Cardiovascular Imaging Inc., Calgary, Canada). All images were independently analyzed by a single experienced radiologist, who was unaware of the clinical data and outcome of the patients. Intraobserver agreement for imaging parameters was determined by the same reviewer who reanalyzed the data with a time interval of more than 2 weeks. Interobserver agreement was assessed by a second reviewer. Segmental wall thickening (SWT) was calculated by the formula: (end-systolic wall thickness − EDWT) / EDWT × 100%, where EDWT represents end-diastolic wall thickness. Manual correction was performed when the delineation of endo- and epi-myocardial outlines was inappropriate. Myocardial segments in the perfusion territory of a CTO vessel were then pre-selected if they were dysfunctional and successfully revascularized. SWT less than 45% indicated myocardial segment dysfunction (9). Assignment of myocardial segments to the perfusion territory of CTO vessels was based on the American Heart Association scientific statement (16).
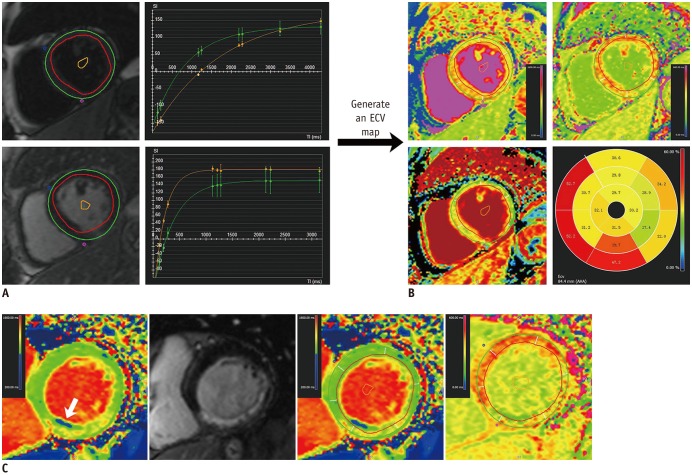
For per-segment analysis, three markers at baseline, TEI, RIM, and ECV were evaluated. Contrast-enhanced regions were identified on LGE images by using a 5 SD threshold above the mean signal intensity of remote myocardium, and TEI was defined as the ratio of the enhanced area of each segment to the segmental area, which was graded as 0–25%, 26–50%, 51–75%, and 76–100% (17). RIM refers to the average wall thickness of the unenhanced area of a segment (18) using the following formula: (100 − hyperenhanced area) × EDWT / 100. Mean segmental ECV was measured from matched T1 maps before and after contrast at the basal, middle, and apical slices. An ECV map was generated when the endocardial and epicardial contours, segmentation points, and a blood-pool contour were present in all slices of T1 maps (Fig. 1). Myocardial ECV was calculated based on the following equation (11):
ECV (%) = (R1myocardium post − R1myocardium pre) / (R1blood post − R1blood pre) × (100-hematocrit), where R1 = 1 / T1.
Segmental functional recovery refers to an absolute increase in SWT (> 10%) compared with baseline (9).
For per-patient analysis, LGE volume, global ECV, and remote ECV were respectively calculated both at baseline and follow-up. Global ECV represented the mean ECV of entire myocardium averaged by the basal, middle, and apical slices, while remote ECV excluded the regions positive of LGE. Changes in ECV were defined as the ratio of ΔECV (ECV at follow-up minus ECV baseline) to the baseline ECV value. LV ejection fraction (LVEF) absolute changes exceeding 5% at follow-up were deemed significant (1920) and used as the reference standard for global functional recovery.
Statistical Analysis
Data were expressed as mean ± SD or median and interquartile range as appropriate. Baseline and follow-up values of SWT were evaluated using paired Student's t test. Receive operating characteristic analyses were performed to define the best cutoff value to discriminate between segments with and without functional recovery, based on the reference standard of an increase of > 10% in SWT. Differences in sensitivity and specificity were compared using McNemar's chi-squared tests. Differences in segmental values were evaluated using a mixed linear model to account for non-independence of segmental data within each patient. Continuous variables were correlated using Pearson's correlation coefficients. Stepwise logistic regression analysis was used to determine the independent predictors of regional and global functional recovery. Variables with a p value < 0.1 in the univariate linear regression were included in a multiple linear regression analysis to respectively investigate the determinants of EF at follow-up and changes in EF, and collinearity diagnostics were conducted to observe and correct the multi-collinearity. Intraobserver and interobserver variabilities and agreements were respectively assessed using Bland-Altman analysis and intraclass correlation coefficient rIC. SAS software 9.3 (SAS Institute Inc., Cary, NC, USA) and MedCalc version 13 (MedCalc software, Mariakerke, Belgium) were used for statistical analyses.
RESULTS
Patient Characteristics
Patient demographics are shown in Table 1. Twelve patients presented well-developed collateral circulation on coronary angiography, and the remaining patients showed poorly developed collaterals. Six cases showed chronic fatty infiltration (Fig. 1C). In the 30 patients who completed follow-up scans, 177 segments were in the perfusion territory of the CTO, among which 126 were considered dysfunctional and enrolled for per-segment analysis.
Segmental Wall Motion
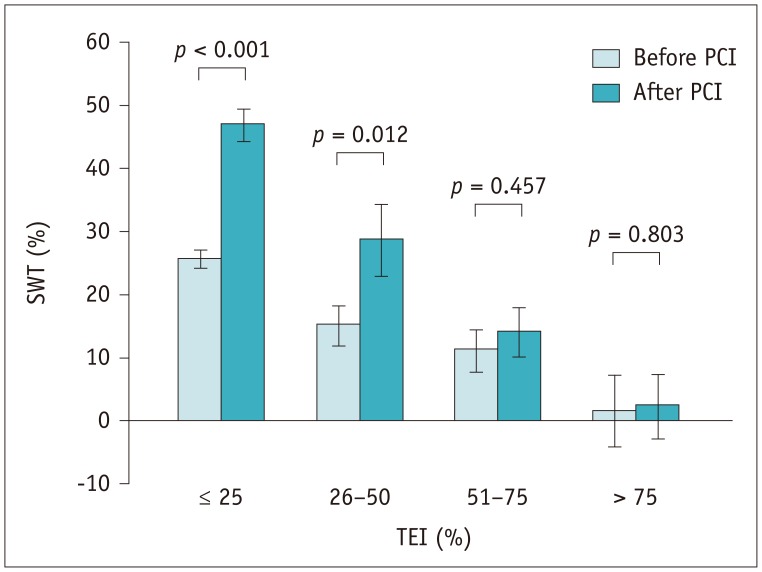
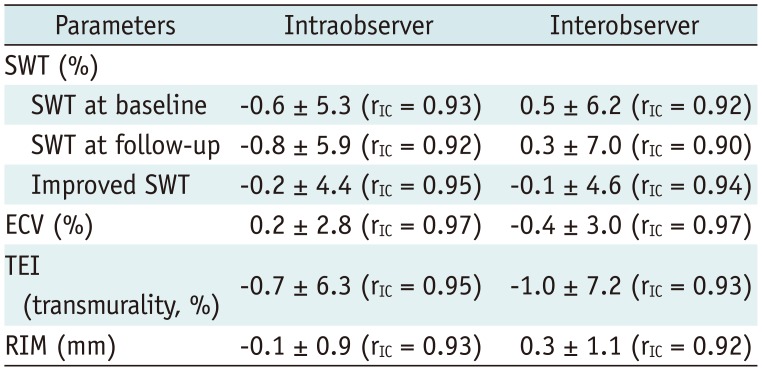
The baseline mean SWT of the dysfunctional segments was 20 ± 14%, which increased to 36 ± 25% at 6 months (p < 0.001). In segments with ≤ 25% (n = 80) TEI and 26–50% TEI (n = 19), the mean SWT increased significantly after revascularization (26 ± 11%–47 ± 21% and 15 ± 12%–29 ± 23%, p < 0.001 and p = 0.012, respectively). SWT showed an increasing trend in segments with 51–75% TEI (n = 22, 11 ± 14%–14 ± 16%, p = 0.457), and remained unchanged (2 ± 13%–2 ± 11%, p = 0.803) in five segments with TEI > 75% (Fig. 2). The intra- and interobserver repeatabilities of SWT are depicted in Table 2.
Prediction of Segmental Functional Recovery and the Role of Collateral Circulation
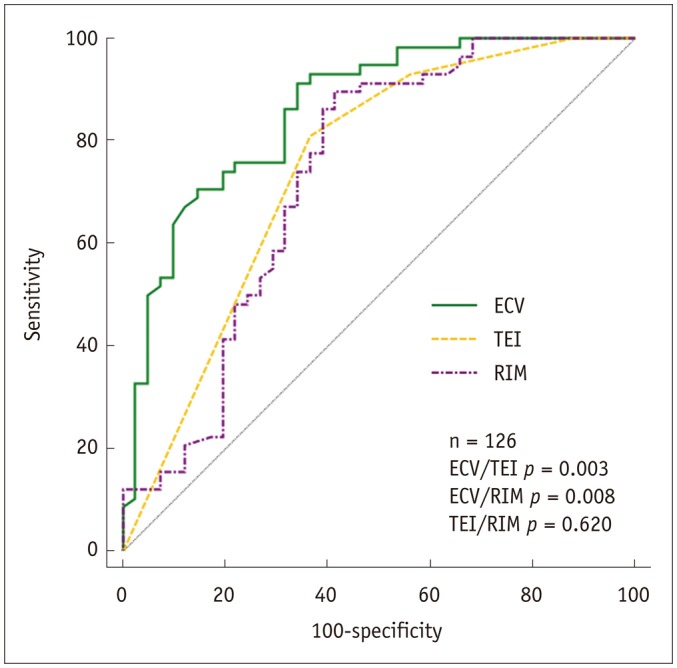
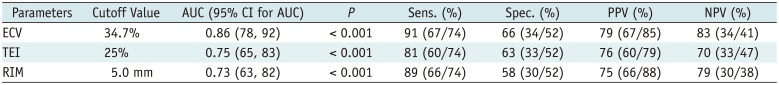
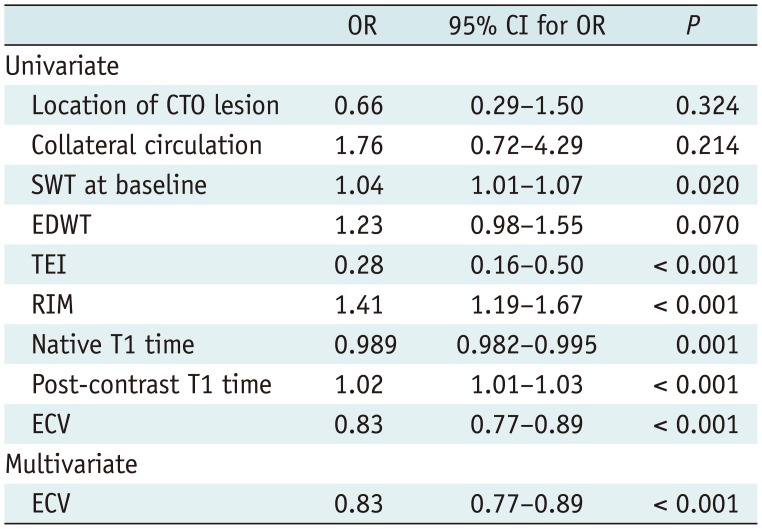
The predictive value of the imaging markers is shown in Table 3. The 25% and 50% cutoff values of TEI had no impact on the predictive performance (area under receiver operating characteristic curve [AUC]: TEI25 0.75 vs. TEI50 0.71, p = 0.328). Segmental ECV predicted regional functional recovery better than TEI or RIM (all p values < 0.010) (Fig. 3). In the segments showing conflicting findings for the outcome obtained by TEI and/or RIM (n = 36), ECV was the best predictor of regional functional recovery with a diagnostic accuracy of 36% (13/36), compared with that of 8% for TEI (3/36, p < 0.001) and 17% for RIM (6/36, p = 0.002). Specifically, the sensitivity of ECV was greater than that of TEI (57% vs. 0%, p = 0.031), whereas its specificity was superior to that of TEI (23% vs. 14%, p = 0.003) and RIM (23% vs. 0%, p < 0.001).
Intraclass correlation coefficients indicating intraobserver agreement for measurement of segmental ECV, TEI, and RIM were 0.97, 0.95, and 0.93, respectively. The corresponding interobserver agreement values for measurement of segmental ECV, TEI, and RIM were 0.97, 0.93, and 0.92, respectively (Table 2).
As for the influence of collateral circulation on wall motion, Table 4 demonstrated that well-developed collaterals were associated with a higher SWT at follow-up, and a larger baseline SWT (p = 0.077) and SWT improvement for a strong trend (p = 0.081). Additionally, formation of collaterals correlated with TEI, and tended to relate to the segmental ECV (p = 0.064). However, the statistical significance of collateral circulation was not observed for prediction of segmental functional recovery both in univariate and multivariate logistic regression analysis, which revealed mean segmental ECV as the only independent predictors of regional functional outcome after PCI (odds ratio [OR] = 0.83, 95% confidence interval [CI]: 0.77–0.89; p < 0.001) (Table 5).
Correlates of ECV with SWT
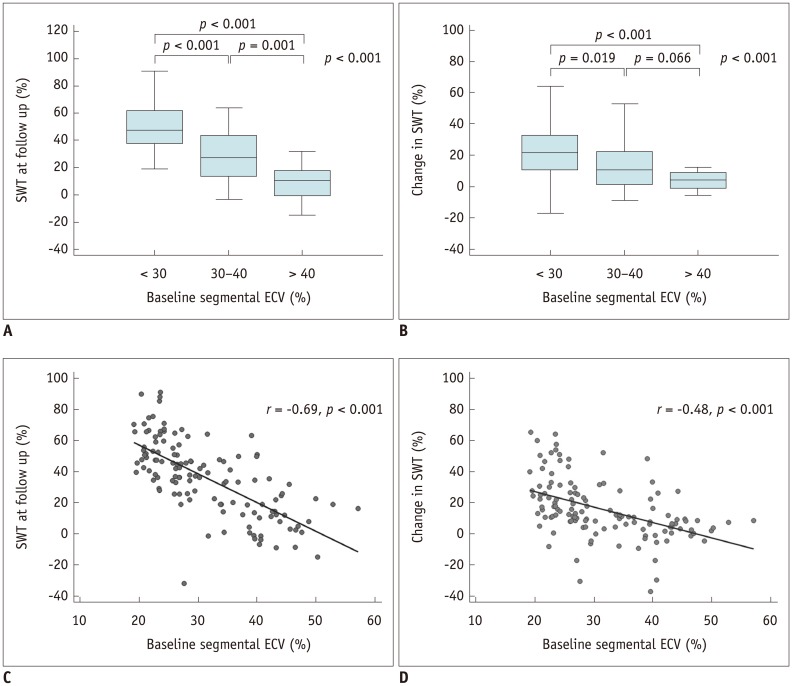
As illustrated in Figure 4, SWT at 6 months was significantly inversely correlated with the baseline segmental ECV according to both threshold-based (p < 0.001) and regression analysis (r = −0.69, p < 0.001). Likewise, changes in SWT from baseline to 6 months after revascularization correlated with segmental ECV (p < 0.001); however, there was an overlap in segments with 30–40% and > 40% ECV (p = 0.066). A moderate negative correlation between the segmental ECV and changes in SWT (r = −0.48, p < 0.001) was also found.
Prediction of Global Contractile Function and Functional Recovery
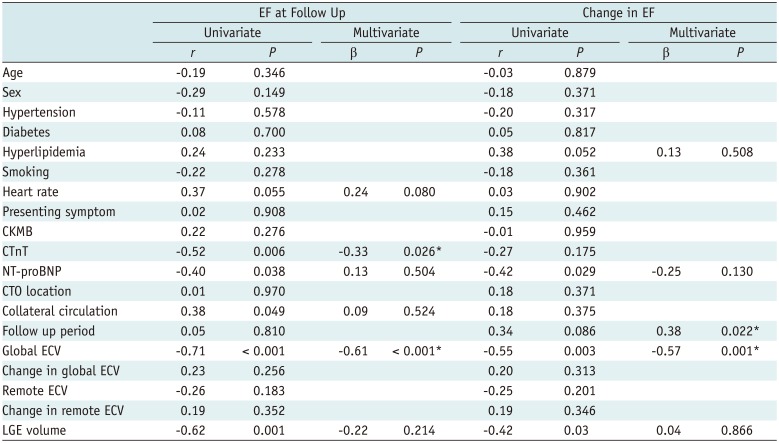
Revascularization significantly enhanced the mean LVEF in comparison with baseline (54.5 ± 8.5% vs. 50.7 ± 6.6%, p < 0.001). Seventeen patients (57%) demonstrated significant improvement in LVEF after revascularization (53.1 ± 3.6–60.3 ± 4.1, p < 0.001), whereas the remaining 13 patients showed no significant improvement in EF. Univariable linear regression analysis demonstrated that collateral circulation was significantly associated with EF at follow-up (r = 0.38, p = 0.049). Moreover, global ECV, but not remote ECV, and LGE volume on the patient level had a negative relationship with EF at follow-up. In multivariate regression analysis, global ECV (β = −0.61, p < 0.001) and cardiac troponin T (CTnT) (β = −0.33, p = 0.026) still showed a significant relationship, whereas collaterals and LGE volume did not. Among determinants of changes in EF, global ECV (β = −0.57, p = 0.001) and follow-up period (β = 0.38, p = 0.022) remained significant after adjusting for various parameters (Table 6).
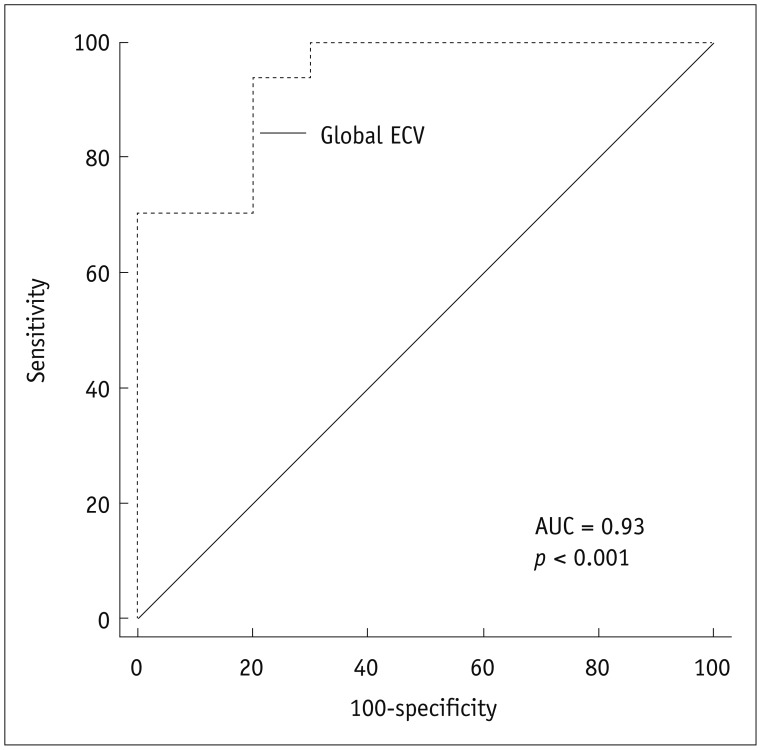
According to the results of multivariate binary logistic regression analysis, the global baseline ECV differentiated between patients with significant EF improvement and without post-revascularization (OR, 0.38; 95% CI, 0.17–0.85; p = 0.019), independently of LGE volume, remote ECV, collateral circulation, follow-up period, as well as demographic and laboratory parameters. The AUC was 0.93 (p < 0.001) for global ECV with a cutoff value of 30.0 (sensitivity, 94%; specificity, 80%; positive predictive value, 89%; negative predictive value, 89%) (Fig. 5).
DISCUSSION
This study demonstrated that ECV can complement LGE as a better prognostic biomarker of regional and global functional outcome 6 months following revascularization in patients with CTO. We found that dysfunctional segments were likely to recover regional function if ECV ≤ 34.7, TEI ≤ 25%, or RIM ≥ 5.0 mm. Segmental ECV functioned as the only determinant of regional functional outcome independently of other imaging markers and collateral circulation. The global ECV at baseline per patient was tightly correlated with EF at follow-up and with changes in EF, and also identified the patients with significant EF improvement with a cutoff value of 30.0 that was independent of the LGE extent.
Transmural extent of infarction assessments obtained by CMR are regarded as a prognostic marker. In the present study, the decreased possibility of restoration of segmental function with increased TEI was consistent with the findings of previous studies (212223). Although LGE is more sensitive than PET for nontransmural infarction, its accuracy is reduced in segments with intermediate TEI, showing varying rates of functional restoration ranging from 10% to 60% (17202425). From a histological point of view, the foci of preserved myocytes were found within myocardial infarcts (26), whereas LGE failed to grade the severity of myocardial injury, partly accounting for the wide range of functional recovery potentials. To overcome the limitation, an accurate and reliable method to depict the severity of injury rather than just the volume of injury in dysfunctional myocardium is highly desirable.
Extracellular volume fraction provides a continuous measurement of extracellular space, and thus acts as a novel tool to interrogate the severity of myocardial injury. In our results, segmental ECV allowed for prediction of functional outcome. The more severe myocardial damage is, the larger the extracellular space and greater is the ECV, resulting in a decreased rate of functional recovery. Furthermore, a better performance of ECV was noted in comparison with TEI and RIM, which was also validated in models of acute MI (27). This may be attributable to the different imaging mechanisms among these baseline markers. LGE helps assess the amount of non-viable myocardium but does not take into account the severity of tissue damage within the infarcted myocardium, nor the epicardial unenhanced rim. RIM only considers the thickness of the unenhanced area; besides, its calculation process, which is dependent on TEI and wall thickness, would lessen its clinical applicability. Segmental ECV integrates both the degenerative change within the infarcted myocardium and epicardial unenhanced rim, thus providing a comprehensive evaluation of segmental characterization, as well as showing more relative importance as a determinant of functional recovery. Although the diagnostic accuracy of segmental ECV was relatively low in the segments showing conflicting findings with functional outcomes, the technique still showed favorable performance in predicting the prognosis, which further confirmed the value of ECV.
The presence of well-developed collateral circulation plays a protective role in the downstream myocardium assigned to CTO vessels. Our previous study showed, as it already has been demonstrated by Chen et al. (6), Choi et al. (7), and Zhang et al. (28), that well-developed collaterals were associated with a lower incidence of MI, lower transmurality of LGE and LGE volume, and reduced regional wall motion abnormality score. Studies to date have mainly focused on the relationship between collateral circulation and baseline CMR markers. In the present study, a positive relationship with regional wall motion at follow-up was also found. A latest publication has reported that the healing of myocardial injury, as defined by ΔT1 from the acute to chronic stages, was closely related to the microcirculation function (29). Therefore, we conjectured that a well-developed collateral circulation may give rise to a less damaged myocardial segment, as depicted by a lower segmental ECV (p = 0.064) in the present study, and a more efficient myocardial healing process, thus showing a smaller portion of degenerative and dysfunctional myocardium and a higher SWT at follow-up. Although the collaterals exerted no influence on predicting segmental functional recovery, our findings maintained that collateral circulation at angiography facilitates earlier assessment of regional systolic function after revascularization.
Changes in the LVEF after successful recanalization of CTO have been illustrated with mixed results. In our cohort, a small but significant improvement in EF (54.5 ± 8.5% vs. 50.7 ± 6.6%, p < 0.001) was noted after revascularization, which was in accordance with previously published results (43031). Chadid et al. (5) reported that the increase in EF was confined to patients with baseline LVEF below the median of the cohort. In contrast, a significant decrease in end-diastolic volume with no significant improvement in EF has been reported (2225).
Various parameters, such as the extent of LGE, microvascular obstruction, global LV strain, etc. (323334), have been recognized as predictors of global LV function after acute MI. To our knowledge, few studies have probed the predictors of global LV function after recanalization in CTO patients. Our findings have demonstrated that both the global ECV value and LGE volume were associated with EF at follow-up and changes in EF, while the latter gave way to CTnT and follow-up period in multivariate regression analysis. Moreover, global baseline ECV emerged as an independent predictor of significant EF improvement following revascularization (OR: 0.38; p = 0.019). This can be partly explained by the fact that the increase in ECV in the affected myocardium represents myocardial fibrosis, and is associated with impaired global function and adverse LV remodeling (273536) and thus delayed or non-recovery of LV function at follow-up. Our study suggests that improved patient selection for revascularization can be achieved by CMR, which may help identify the patients most likely to experience beneficial LV systolic function improvement after CTO-PCI.
Our study has its limitations. First, the sample size in this study was small due to unsuccessful CTO-PCI procedures as well as the incidence of loss to follow-up. The unsuccessful PCI rate of 24% (12/50) in our study was acceptable compared with the previously published results (92225). Further studies with more patients and long-term follow-up are warranted. Second, our results were derived from a specific population whose EF was normal or mildly impaired, and it remains unknown whether the conclusions could be applied to the patients with moderate to severe EF impairment. Third, the ECV changes with the increasing age, and the cutoff value in the present study may not suitable for other age groups. However, CTO patients have a narrower age range, mainly 55–75 years (37), which broadly agreed with the present study. Therefore, it is feasible to apply the current cutoff value to the other CTO cohort. Finally, sustained recanalization at follow-up was not confirmed angiographically in all the patients. However, the lack of symptoms and absence of a new LGE zone at follow-up can exclude graft occlusion or in-stent restenosis.
In conclusion, non-invasive assessment of ECV provides incremental value in comparison with conventional CMR measures and remains the only predictor of functional outcome both at the segmental and global levels in patients with CTO. The clinical relevance of ECV potentially allows for improved early prognostication and resource allocation to patients who are more likely to benefit from CTO-PCI.
 XML Download