

 PDF
PDF ePub
ePub Citation
 Print
Print


INTRODUCTION
In human brain, dopamine metabolism produces neuromelanin, a dark pigment that is a by-product in substantia nigra (SN) and gives a dark color to the structure. In Parkinson's disease (PD), along with a dopaminergic neuronal loss, neuromelanin levels are also decreased. This is because neuromelanin is mostly within the dopaminergic cells in an intracellular form although a smaller portion becomes extracellular when released from dying cells (12).
Neuromelanin has an important role in protecting against oxidative stress-induced neuronal damage by toxic metals; it protects by chelating the metals in the cell by forming stable complexes (3). In 2006, Sasaki et al. (4) first demonstrated in-vivo neuromelanin imaging with 3 tesla (3T) magnetic resonance imaging (MRI). That pioneering study indicated that MRI dark-pigmented SN on pathologic specimens show prominent T1 hyperintensity, and that the T1 signal of SN is decreased in PD, compared to scans from normal volunteers. Additional work has suggested that the T1 hyperintensity of SN may be from a paramagnetic T1 shortening effect (45). Besides the changes seen in PD, loss of T1 hyperintensity of SN has also been observed in multiple system atrophy (6), progressive supranuclear palsy (7), corticobasal degeneration (8), and psychiatric disorders such as depression and schizophrenia (9).
Aside from motor-related symptoms, dementia is also quite common in PD, occurring in 40% of patients with the disease. PD-related dementia (PDD) is characterized by executive dysfunction, disordered attention, and decreased visuospatial/constructional abilities (10). As 26% of patients with PDD present with cognitive symptoms that overlap those observed in patients with Alzheimer's disease (AD), a differential diagnosis between PDD and AD is sometimes difficult especially in the early stages and particularly when using neuropsychiatric tests alone (1011). Despite overlapping cognitive symptoms, the major pathology of PDD is loss of the neuromelanin-containing dopaminergic neurons of SN, while that of AD is not, although there is a debate on the role of dopamine in AD pathology (12). In addition, neuromelanin depletion in PDD on MRI has not been studied yet while neuromelanin depletion has been extensively studied in PD as a whole group.
Hence, we hypothesized that the volume of neuromelanin-induced T1 signal intensity would be decreased in PDD, but not in AD and the age-matched controls and the volume measurement would differentiate PDD from AD and the control subjects. For our study, we evaluated volumetry orgdata of T1 hyperintensity in SN from PDD, AD and healthy subjects.
MATERIALS AND METHODS
Study Subjects
This retrospective study included 10 patients with PDD, 18 patients with AD and 13 age-matched healthy controls (Table 1). The patients with PDD and AD were recruited from the dementia center of our hospital, between August 2006 and July 2010. All patients were diagnosed based on information obtained from an extensive clinical history and neurological examination. All PDD patients were diagnosed according to the Brain Clinical Diagnosis Criteria from Parkinson's Disease Society in United Kingdom (13), the Diagnostic and Statistical Manual of Mental Disorders, Fourth Edition (DSM-IV) and the Emre et al. (14) PDD criteria. The diagnosis of dementia and probable AD was based on the DSM-IV criteria, and criteria recommended by the National Institute of Neurological and Communicative Disorders and Stroke, and the Alzheimer Patients and Related Disorders Association (15). The subjects who fulfilled the criteria for dementia with Lewy bodies (DLB) were excluded in this study (16).
Thirteen age-matched control subjects were selected from a consecutive series of patients, referred for the same MR imaging protocol as patients with PDD and AD, as part of a medical checkup between June 2007 and August 2011. The following criteria were used for inclusion of the control subjects in the study: no clinical evidence of neuropsychiatric disorders and no apparent abnormal findings on MRI scans. We excluded patients with a history of neurological disease, malignancy, stroke, or brain surgery. Indications for MRI scans in the controls were headaches (n = 1), dizziness or vertigo (n = 2), and health screening (n = 10).
All subjects undertook a standard battery of neuropsychological tests, including an assessment of global cognitive impairment using the scales for the mini-mental state examination and of global functional impairment using the Clinical Dementia Rating. An expert neuroradiologist with 17-years of experiences reviewed the MR images, in order to rule out any major neuropathology including a tumor, stroke or inflammatory/infective diseases.
Our Institutional Review Board approved the study, and written informed consent from the study subjects was waived.
MR Image Acquisition
All patients undertook MR imaging using a 3T unit (Signa HD×T; GE Healthcare, Milwaukee, WI, USA) with an 8-channel head coil. The routine MR imaging protocol included the following sequences: 1) axial and sagittal T1-weighted inversion-recovery (repetition time [TR]/echo time [TE]/inversion time [TI], 2468/12/920 ms; section thickness, 5 mm; matrix, 512 × 224); 2) axial T2-weighted fast-spin echo (FSE) (TR/effective TE, 4000/106 ms; section thickness, 5 mm; matrix, 384 × 384); 3) axial fluid-attenuated inversion-recovery (TR/TE/TI, 11000/105/2600 ms; sectional thickness, 5 mm; matrix 384 × 224); 4) axial T2-weighted gradient-echo (GRE) (TR/TE, 550/17 ms; section thickness, 5 mm; matrix, 384 × 224; flip angle, 15°); and 5) T1-weighted volumetric spoiled gradient recalled-echo (TR/TE, 7.3/2.7 ms; section thickness, 1.5 mm; matrix, 256 × 256; flip angle, 13°). The field of view (FOV) was 230 × 230 mm.
To visualize neuromelanin of SN, we obtained a thin section T1-weighted FSE sequence for upper brain stem with the following parameters: TR/TE, 600/14 ms; number of slices, 10; section thickness, 2.5 mm with intersection gap of 1 mm; matrix, 512 × 320; FOV, 220 × 220 mm; the number of acquisition, 4. The acquisition time was 3 minutes 40 seconds. The sequence was obtained in the oblique axial planes perpendicular to the 4th ventricle floor with coverage from the posterior commissure to the inferior border of the pons. We made sure that one section was located at the inferior edge of the inferior colliculi, for the best visualization of SN.
MR Image Analysis
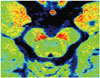
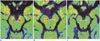
The volume of T1 hyperintensity was measured by tracing volumes of interest (VOIs) on each slice of T1-weighted FSE sequences where the T1 hyperintensity could be seen. VOIs' contours were defined semi-automatically using the level-set VOI tool of Medical Imaging Processing, Analysis and Visualization (MIPAV) (http://mipav.cit.nih.gov/). In this method, MIPAV software first analyzes the intensity values and uses the results from its level-set algorithm to determine the probable boundary of the T1 hyperintensity of SN, and then generates a contour. The total volume of neuromelanin was calculated by adding all the VOIs of the T1 hyperintensity of SN for each patient (Fig. 1). The window level and width was set as the signal intensity of the decussation of the superior cerebellar peduncle (DSCP) and 70% of the signal intensity of DSCP in the slice of SN. A National Institute of Health lookup table MIPAV software was applied to all the images. An experienced rater with four-year-experience of neuroimaging processing performed the entire imaging analysis under the supervision of a neuroradiologist. Imaging analysis was performed in a blinded manner for the diagnosis of subjects.
For normalization of the signal intensity, we also defined region of interest of 30 mm3 symmetrically in the ventral tegmentum located in the anterolateral areas of aqueduct as background. We calculated the normalized signal intensity of SNs by dividing their signal intensity by that of background area, i.e., the tegmentum of midbrain, then multiplied by 100.
To assess measurement reliabilities, we randomly selected the MR images of 26 subjects (two-thirds of cases in the study group). For those subjects, the rater repeated the measurement of the T1 hyperintensity volume at least 2 weeks apart. For inter-observer reliability, another rater of a three-year experience of neuroimaging processing independently measured and recorded the T1 hyperintensity volume of SN.
Statistical Analysis
A statistical analysis was performed by using the Statistical Package for the Social Sciences (version 17.0 for Windows; SPSS Inc., Chicago, IL, USA) and MedCalc (version 15.2.2, Mariakerke, Belgium). P < 0.05 was considered as statistically significant. Before performing individual analyses, the distribution of data sets was checked for normality. To compare the clinical features between AD and PDD, we used the Mann-Whitney U test for continuous variables. The Kruskal-Wallis test was used to evaluate differences in the neuromelanin volume of SN and the signal intensities of neuromelanin of SN among all groups, followed by a post hoc comparison. The correlation between age and MR imaging measurement was assessed with the Spearman correlation coefficient. The inter-observer and intra-observer agreement between the 2 raters were assessed with the intraclass correlation coefficient.
RESULTS
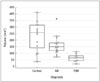
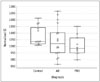
Three groups showed significant differences in terms of the volume of T1 hyperintensity (p < 0.001). The mean volume of T1 hyperintensity was significantly lower in PDD than in AD and normal controls (64.36 ± 28.21 mm3 vs. 160.59 ± 65.26 mm3 vs. 232.30 ± 110.79 mm3, respectively) (p < 0.005, Bonferroni corrected) (Fig. 2). However, the volume of T1 hyperintensity was not different between AD and the normal controls (p = 0.136, Bonferroni corrected) (Fig. 3). On the other hand, the mean normalized signal intensity of T1 hyperintensity was not statistically different among the three groups (p = 0.118). Nevertheless, the mean normalized SI of the SN VOI tended to be lower in PDD than in AD and the normal controls (1005.93 ± 76.77 vs. 1044.59 ± 119.18 vs. 1077.91 ± 73.24, respectively) (Fig. 4).
In normal healthy controls, age did not correlate with either the volume or the mean signal intensity of the T1 shortening of SN (p = 0.640 and 0.469).
Regarding the inter-observer agreement, the intraclass correlation coefficient for the T1 hyperintensity volume was 0.888 (95% confidence interval: 0.810–0.942, p < 0.001). In terms of the intra-observer agreement, the mean intraclass correlation coefficient value between the first and second measurement of the same data was 0.941 (95% confidence interval: 0.854–0.969, p < 0.001).
DISCUSSION
The results of our study indicated that the volume of the T1 hyperintensity of SN was markedly decreased in PDD, but not in AD and control subjects. Nevertheless, AD patients tended to show a mild decrease in the volume of T1 hyperintensity, as compared with the control subjects.
Although T1 hyperintensity of SN has been a hot topic in PD studies, T1 hyperintensity of SN has not been studied yet in patients with PDD. Decreased volume in the T1 hyperintensity of SN for the patients with PDD is consistent with the findings in previous reports on PD (46171819). Since the first report (4), there have been several reports on reduction in the T1 hyperintensity in various neurodegenerative diseases. In subsequent studies, the area or volume of the T1 hyperintensity of SN were reportedly decreased in PD compared with the control subjects (171820). In addition, the degree of the T1 hyperintensity differed between early and late stage of PD (7).
Sasaki et al. (45) suggested that T1 hyperintensity at the level of the midbrain is for SN neuromelanin-pigmented cells, which are known as the pars compacta of SN. From a study of pathologic correlations, the T1 hyperintensity of SN is consistent with the neuromelanin-containing area (16). Neuromelanin protects neurons against the toxic catecholamine accumulation and oxidative stress by binding with metals such as iron, zinc, copper and manganese (321). T1 hyperintensity of neuromelanin is mainly attributed to its paramagnetic property. When combining with metals such as iron and copper, neuromelanin shows paramagnetic contrast (22). Magnetization transfer effect due to multislice FSE sequence augments T1 hyperintensity by suppressing surrounding tissue signal intensity (2123). Although, there were debates on whether the boundary of the T1 hyperintensity or T2 hypointensity represents exactly the boundary of the pars compacta of SN, recent studies showed that T1 hyperintense area was located posterior to T2 hypointense area, at the pars compacta by obtaining susceptibility weighted imaging (SWI) and T1-weighted image at the same time (24). The broader T1 hyperintense area of the medial part of SN in our subject may be part of the ventral tegmental area, where dopaminergic neurons reside (5).
For AD, as another common neurodegenerative disease, only one recent report observed the decreased T1 hyperintensity in AD (19); however, to the best of our knowledge, our study is the first report that has compared AD, PDD and healthy controls in terms of the volume of the T1 hyperintensity of SN. In pathology and imaging studies, degeneration of SN is reported in patients with AD (1219). However, it was not clear whether SN has only secondary degenerative change or there is clear cell loss in AD patients. Our results suggest that there is at least a minor degree of cell loss in AD. In the step of patient inclusion, we meticulously excluded patients who fulfilled DLB (16). Nevertheless, without an autopsy confirmation, we cannot exclude the possibility of Lewy body pathology in our patients with AD. In addition, pathologic change of nigrostriatal pathway with Lewy bodies and alpha-synucleinopathy, which is characteristic of DLB, has been also reported in about 50% of AD patients and 30% of aged healthy subjects (12).
The signal intensity of neuromelanin showed no differences between the three groups. A decreased volume but preserved signal intensity of SN in PDD suggests that the main pathology is not lower neuromelanin content of each neuron, but a decrease in number of melanin-containing neurons in SN. PDD is an eventual result of PD, hence, our finding is also supported by previous reports that neuronal depletion of SN is the key finding in PD, although neuromelanin synthesis is reportedly reduced (125).
In this study, there was no correlation between age and the volume of the T1 hyperintensity of SN in normal subjects. Our result was in accord with the previously published result (17). Our finding suggests that the volume change of the T1 hyperintensity is not merely an age-related change but a pathologic change due to neuromelanin-containing dopaminergic cell loss.
Compared with the AD and control subjects, PDD showed profoundly reduced volume of T1 hyperintensity of SN. Obtaining a differential diagnosis of PDD and AD is sometimes difficult based on symptoms and clinical tests alone (11). Hence, more objective tests, such as the T1 hyperintensity volume measures, may be helpful in early diagnosis of PDD vs. AD. In addition to PDD and AD, several neurodegenerative disorders such as PSP and CBD can show both clinical symptoms of dementia and imaging findings of the reduced T1 hyperintensity of SN (726). PSP and CBD, however, have characteristic clinical features and are relatively rare in prevalence. Future study involving patients with earlier stages of PDD, AD, as well as PSP and CBD will be helpful in this regard.
Unlike our study, most previous MR imaging studies of SN in PD and PDD have used proton-density weighted imaging, and GRE and SWI (27282930). Most of them presumed that iron accumulation in the SN can produce the T2* shortening and that iron-sensitive imaging can mirror the change of SN by visualizing the iron accumulation in the SN or by visualizing the iron-depleted area of the dopaminergic cell-containing nigrosome (3031). However, these studies have often shown conflicting results as the iron accumulated area did not correspond to the SN boundary on the pathologic specimens (531). Especially, detection of the loss of the nigrosome on the T2*-weighted imaging or iron-sensitive imaging, i.e., finding darkness from brightness of nigrosome, can be bothersome because it requires human visual perception in a less intuitive way. Thus, the neuromelanin sequence may be more accurate in determining the pathology of SN than iron-sensitive imaging, because of the direct correlation of the neuromelanin sequence with neuromelanin-containing cells, which is the pathologic target of PDD.
In our analysis, volumetric measurements of T1 hyperintense SN showed high inter-rater and intra-rater agreement. Because of the high reliability, volumetry of T1 hyperintense SN could be a helpful imaging marker for the evaluation of PDD and AD.
Our study had several limitations. First, our disease groups were < 20 subjects each. Second, the SN volumes were not normalized to the intracranial volume to control for variability in the dimensions of structures across the subjects. As such, the effect of general atrophy cannot be ruled out. Third, a relatively low signal to noise ratio of the neuromelanin-sensitive sequence might induce an inhomogeneity of the signal intensity, which might affect the results (5). We carefully reviewed signal intensity inhomogeneity before the final approval of the MR examination of each patient and performed additional phantom test for quality control of T1-weighted images to minimize the inhomeogeneity effect. To overcome these limitations, a larger scale prospective comparison study of SWI and the neuromelanin sequence will be necessary in the near future.
In conclusion, the T1 hyperintensity volume of SN was significantly lower in patients with PDD, as compared with patients with AD and the normal controls. Assessment of the volume of neuromelanin T1 hyperintensity of SN may be useful to differentiate PDD from other degenerative diseases.

 XML Download