

 PDF
PDF ePub
ePub Citation
 Print
Print


INTRODUCTION
The assessment of skeletal maturity or bone age (BA) is a routine procedure in pediatric radiology, for which the Greulich and Pyle (GP) method is a commonly employed technique (12). However, the main problem with this method is interobserver variability (345). To avoid the subjectivity of human observations, researchers have attempted to develop auto-computation technology for BA assessment (6). Consequently, a fully automated image analysis method, BoneXpert, has been developed and used for several years. This software can assess the BA according to the bone shape, density and texture sensitive to epiphyseal fusion. BoneXpert is advantageous in eliminating the interobserver variability and bias, as compared with radiologist readings using the GP atlas and has been verified as a valid and efficient method in Asian populations (7891011).
Because BoneXpert can rapidly measure both the total BA of the hand and wrist and the individual BAs of 8–13 separate bone structures, it provides an opportunity to observe the maturity disparities of these bones, which have been noted by several authors (12131415). For example, the authors who developed the GP atlas noted that, even in normal children, the bones in the hand and wrist tend to behave more or less as a unit during development (1). Clinically, maturation disparity may cause inaccurate BA assessment. For example, if the BAs of the metacarpals, phalanges and distal radius of one child are 6.5, 7.5, and 6.0 years, respectively, according to the GP atlas, radiologists must balance these discrepancies to arrive at a single BA diagnosis, which can be difficult. Therefore, we aimed to investigate the existence, scope, regularity and possible underlying reasons of maturity disparities.
In our study, in addition to the objective automatic BoneXpert approach, subjective manual GP atlas assessment was also performed for comparative purposes to observe the phenomenon of maturation disparity. This technique was implemented because BoneXpert has been calibrated against the GP system, although it is an independent BA rating system (16). To the best of our knowledge, no report has been published on the objective and subjective evaluation of BA maturation disparity.
MATERIALS AND METHODS
Subjects
This study was a prospective study and approved by the Institutional Review Boards of our institutions. Left hand and wrist posterior-anterior (PA) views were obtained from children who came to the emergency room/clinic to evaluate for a possible bone fracture during the period of Jan 2010 to Dec 2013. Height, weight and other related information were obtained from medical records. Children with abnormal stature and those with a history of any serious disease or chronic illness were excluded. The subjects included in our study were 2 to 14 years old, since the validated age range for the current version (2.0) of BoneXpert is 2.5 to 17 years for boys and 2 to 15 years for girls. There were about a total of 234 radiographs of boys aged 2.5 to 14 years (mean age 8.6 years) and 170 radiographs of girls aged 2 to 13 years (mean age 6.9 years) in our study.
Bone Age Measurement
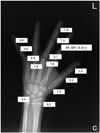
BoneXpert (Visiana, Holte, Denmark) has been integrated into the picture and archiving and communicating system and can fully and automatically locate the borders of 15 bones (the distal, and proximal bones of the 1st phalange, the distal, middle and proximal bones of the 3rd and 5th phalange, five metacarpals, radius and ulna) on the handwrist PA view. A BA is assigned to 13 bones (the 2nd and 3rd metacarpal has only one BA, and the same as the 4th and 5th metacarpal) mainly based on the bone shape, density and texture sensitive to epiphyseal fusion (Fig. 1) (717).
According to the calculating rule of BoneXpert, if a bone's BA value deviated from the average of all bones by > 2.4 bone years, it was deemed unacceptable. In addition, if fewer than 8 bones were recognized and calculated, the entire image was rejected, and no BA values were reported (2). In total, BoneXpert rejected 7 radiographs for poor image quality. Therefore, the remaining 397 radiographs (229 for boys and 168 for girls) were finally included in the study. For ease of comparison, the 7 rejected radiographs were also not included in the manual GP atlas analysis.
Additionally, according to the anatomical differences and related references, five groups were defined, each of which consisted of bones from the same row, to further clarify the maturation disparity (51314). The groups were as follows: 1) distal radius and distal ulna; 2) the first, third and fifth metacarpals; 3) the first, third and fifth proximal phalanges; 4) the third and fifth middle phalanges; and 5) the first, third and fifth distal phalanges. Currently, BoneXpert is unable to calculate the BA of carpals.
With BoneXpert, the mean BA for each of the five bone groups was determined by averaging the BAs of the individual bones within the same group. However, some bones were excluded from the mean BA. For example, if BoneXpert failed to calculate a BA for the distal ulna, the BA of the distal radius was regarded as the mean BA of the distal radius and distal ulna. Then, the mean BA for each of the five bone groups was compared with the chronological age (CA) of the corresponding child.
The method described above was repeated using the manual GP atlas technique. In some cases, if one epiphysis could not be seen clearly, the average of the BAs of the other bones in the same group was regarded as the mean BA. More attention was paid to some bones for which the BAs could not be acquired by BoneXpert because they may have BAs less than or greater than the average BA by 2.4 years or more. In this situation, BoneXpert may under- or overestimate the maturation disparity.
For GP atlas assessment, two pediatric radiologists who were skilled at BA diagnosis (with 8 and 14 years of experience, respectively) made separate diagnoses of the overall BAs and that of the Radius-Ulna-Short bones (RUS). If an image fell between two standard reference images in the GP atlas, such as 5 and 6 years, it was assigned as 5.5 years. The mean BA assessed by the radiologists was considered the final BA diagnosis.
There are two differences between the GP atlas and BoneXpert. First, BoneXpert can provide continuous BA values, such as 5.3 years, 5.4 years, and 5.5 years, whereas the GP atlas only provides standard images representing each year, such as 5 years, 6 years and 7 years. Therefore, the BA values of the GP atlas represent intervals. Second, researchers verified that the precision of BoneXpert is approximately 0.17 years, which corresponds to approximately one third that of subjective methods, such as the GP atlas. Here, the precision is also called the repeatability, which means the ability to obtain the same result with a repeated X-ray exposure. Therefore, BoneXpert is theoretically able to detect a significant change in maturation three times earlier than a radiologist (16); or in other words, in the same period time (for example 6 months), BoneXpert could find 0.17 years change of BA, while using a GP atlas, a radiologist may find a different BA estimation only if the BA changes is more than 0.5 years.
Data Collection
The overall BAs of all subjects were recorded using the automatic BoneXpert system and manual GP atlas and these were subsequently compared with their CAs. This step verified the validity of BoneXpert and manual GP atlas for our sample from an overall perspective. In the second step, the BA of each bone of each patient was recorded using two methods and the differences in individual BA values between the most advanced and retarded individual bones were compared. A high maximal BA difference between individual bones in the same radiograph can cause diagnostic difficulty during BA estimation and the maximal difference between individual bones is also a good indicator of maturation disparity.
Statistical Analysis
Statistical analysis was performed using SPSS (version 17.0; SPSS Inc., Chicago, IL, USA). The BA values between different individual bones and bone groups for boys and girls were compared using descriptive statistics, and the variance was assessed by one-way analysis of variance followed by a post-hoc test. A p value < 0.05 indicated a significant difference.
RESULTS
In our study, BoneXpert was used to analyze 2977 bones in 229 boys and 2184 bones in 168 girls. However, BoneXpert failed to determine BAs for 95 bones in 60 boys and 140 bones in 79 girls. Thus, BoneXpert rejected about 4.5% (235/5161) of individual bones, most of which were the radius or ulna, followed by the fifth middle phalanges. The distal epiphysis of the radius and/or ulna usually failed to be identified because it overlapped with carpals.
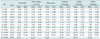
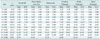
For BoneXpert, no significant difference was found between the overall BA and CA at any age level. For the five groups of hand-wrist bones, significant differences between BA and CA were observed in 15 of the 115 age groups for both genders. Among the 15 age groups, metacarpals groups of different ages with retarded BA were found in 6, and middle phalanges groups of different ages with advanced BA were found in 6 groups (Table 1).
For manual GP atlas, there were some differences compared with BoneXpert. First, for boys aged 11–13 years, a significant difference existed between the overall BAs and CAs. For the five groups of hand-wrist bones, significant differences existed between BA and CA in 24 of the 115 age groups for both genders. Among the 24 age groups, metacarpal groups of different ages with retarded BA were found in 7, and middle phalange groups of different ages with advanced BA were found in 9 groups (Table 2). Therefore, for both methods and two genders, middle phalanges and metacarpals were the most advanced and retarded BA development in the five bone groups, respectively.
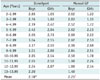
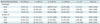
The yearly mean BA difference between the most advanced and retarded individual bones within the same radiograph using the two assessment methods were calculated. For both genders, the overall mean differences between the most advanced and retarded individual bones of children determined using the BoneXpert and GP atlas methods were approximately 2.58 and 2.25 years, respectively (Table 3).
The frequency of each maximal BA difference in each subgroup was summarized in Table 4. For example, in the BoneXpert group, in both sexes, almost half of these differences were in the 2- to 2.99-year-old group. Additionally, approximately 75.8% of the boys and girls in our sample had a maximal BA difference that exceeded 2 years. Furthermore, in the manual GP atlas group, approximately 59.4% of the children had a maximal individual BA difference exceeding 2 years.
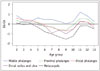
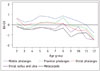
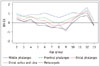
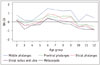
The mean differences between the BAs and CAs of the five bone groups for boys and girls were shown in Figures 2 and 3 for the BoneXpert method, and in Figures 4 and 5 for the GP atlas method, respectively. Although these four figures presented some differences, their similarities were obvious. First, the upper curves all corresponded to the middle phalanges, indicating that middle phalanges was almost the most advanced bone group for all age levels, with only with one or two exceptions, such as the distal phalanges at age 4 for boys assessed using BoneXpert. Second, the bottom curves of these four figures primarily corresponded to the metacarpals, although the distal radius and ulna were also present as the most retarded development group, especially for the girls assessed with the manual GP atlas method. Third, the other three groups overlapped within the range bounded by the curves of the metacarpals and the middle phalanges.
DISCUSSION
In this study, we analyzed the BA differences of RUS bones using both objective automatic BoneXpert software and subjective manual GP atlas assessment. Although significant differences existed in the BA and CA values of boys aged 11–13 years using the manual GP atlas method, differences in the BAs between bones were highly convincing because these measurements were obtained by the same two pediatric radiologists. Regarding BoneXpert, neither sex nor age groups presented significant differences between overall BA and CA in any of the 13 bones studied. This result confirmed that BoneXpert could provide a reliable standard for BA assessment in Chinese children (10). Based on the overall validity, we can further analyze detailed information on the maturation disparity between individual bones and bone groups in the regions of the hand and wrist.
Our results showed that maturation disparity was common in healthy Chinese children. In 75.8% of children assessed with the automatic BoneXpert system and 59.4% of children assessed using the manual GP atlas method, the maximal BA difference between individual bones exceeded 2 years. The mean BA differences between the most advanced and most retarded individual bones were 2.58 and 2.25 years for BoneXpert and the GP atlas, respectively. The high frequency of such large discrepancies suggests that pediatric radiologists are generally able to observe this phenomenon in routine BA evaluations. The discrepancies of 2.58 and 2.25 years between individual bones suggest that at least three to six standard pictures must be analyzed carefully to apply the GP atlas method, because the time intervals separating the standard pictures in the GP atlas range from 0.5 to 1 year. This maturation disparity increases the burden on pediatric radiologists.
In fact, maturation disparity represented a challenge during the production of the GP atlas because 58 standard plates were chosen from among more than 5000 radiographs of hands. However, almost every standard picture in the GP atlas still contains bones with disparate BAs (1). Although the authors of the GP atlas suggested that the "abnormal" development of individual bones should also be noted during the overall BA assessment (1), many clinicians prefer to consider a single, overall BA for all hand-wrist bones. Therefore, a total BA diagnosis may balance out the maturation disparity between bones.
Although maturation disparity is clearly widespread, it exhibits regular patterns. Based on our results, the maturation disparity is mainly attributable to the most advanced bones (middle phalanges) and the most retarded bones (metacarpals). In addition, the BAs of the proximal and distal phalanges were closer to the CA in both genders at most age levels. In other words, when applying the GP atlas to evaluate Chinese children, the metacarpals and middle phalanges are less reliable for BA determination (17). This point is important because radiologists can confidently rely on the proximal and distal phalanges instead of giving equal weight to each bone, thereby saving time and overcoming the issue of maturation disparity.
Our findings were somewhat similar to those of Lee (14), who applied the manual GP atlas to assess children from Hong Kong in China in the 1970s. They reported that the middle and distal phalanges tended to be relatively advanced, followed by the metacarpals, proximal phalanges and distal radius-ulna. However, in contrast to our findings, a study in a Spanish population claimed that the best agreement between BA and CA occurred between the distal ulna and radius and the metacarpal bones (15). Compared with their results, our study addressed not only groups of bones in the same rows of different regions, but also the largest discrepancy between RUS bones and the different frequencies of maturation disparity. For example, 59.4% of children assessed using the manual GP atlas method presented maximal BA differences of more than 2 years. In addition, the objective measurements of BoneXpert are also valuable.
In theory, the maturation disparity would become more serious if the rejected bones who's BoneXpert BAs differed from the average BA by 2.4 years were included. However, after careful, manual comparison, only a few cases of the fifth middle phalanges may be rejected because of over-advanced development, which might increase the maturation discrepancy to some degree. Therefore, the overall result may not be substantially altered. In addition, although the metacarpals were some of the most developmentally retarded bones in our study, BoneXpert did not reject any of the metacarpals for its BA values differing from the average BA by 2.4 years or more.
The main reason underlying maturation disparity may be that the bones in different regions exhibit unique growth velocities and patterns, which may be attributed to the different activities of the bones. For example, the ulnas often occurred later than the radius. Clearly, the degree of activity or the physiological function of the ulnas is inferior to that of the radius (1819). Similarly, the middle phalanges are the center axis of the fingers; therefore, they may be extremely active. In contrast, the metacarpal experiences much less activity than the middle phalanges (20). Therefore, in our study, the most advanced and retarded bone groups in terms of development are the middle phalanges and metacarpals, respectively.
Other reasons for maturation disparity may relate to the different assessment methods and races (11). For example, our study showed that the maturation disparities observed using the two methods are different to some degree. Furthermore, BoneXpert was designed to return the same average BA as the GP method for all 13 bones in Caucasian children. However, there is no a priori reason to expect agreement between the average BAs of these five groups in ethnicities other than Caucasian. In other words, the BA of metacarpals in our sample may be underestimated by BoneXpert or GP atlas assessment. For example, if a metacarpal is delayed by more than 2.4 years, it will be excluded by BoneXpert, although in reality, this bone may be only 1.8 years behind the expectation. However, revising BoneXpert to allow metacarpals to be delayed by up to 3.0 years would not be practical because doing so would require the subject's ethnicity to be input in BoneXpert.
Clearly, our study had limitations. First, we only analyzed 8 to 13 bones because of the inherent RUS focus of BoneXpert. Second, our samples did not include children under 2 years old because these young children often lack a clearly visible epiphysis that can be recognized by BoneXpert. Third, the Tanner-Whitehouse 3 method (TW3) is more reproducible and useful for the evaluation of individual bones than the GP atlas. However, TW3 was not used commonly in China, whereas BoneXpert and the GP atlas were calibrated to agree (on average) to ensure "backwards compatibility" between the two systems (7). Therefore, the manual GP atlas method was used for comparison in our study.
In summary, our study revealed that, in healthy Chinese children, approximately 59.4% of cases assessed with the manual GP atlas method and 75.8% of children analyzed with the automatic BoneXpert method presented maximal BA differences of more than 2 years. This discordance can cause difficulties in BA diagnosis. However, this maturation disparity exhibited a regular pattern i.e., in both genders and both measurement methods, the middle phalanges and the metacarpals were consistently the most advanced and most retarded bone groups, respectively. Additionally, the proximal and distal phalanges are more reliable for BA determination. Different functional activities, measurement methods and races may contribute to the observed maturation disparity. Thus, pediatric radiologists should seriously consider the phenomenon of maturation disparity.
 XML Download