

 PDF
PDF ePub
ePub Citation
 Print
Print


INTRODUCTION
Dynamic contrast-enhanced magnetic resonance imaging Radiology(DCE-MRI) is a noninvasive quantitative method of investigating microvascular structure and function. It tracks the pharmacokinetics of injected contrast agents as they pass through the tumor vasculature. It is also a promising technique for in vivo characterization of tumor angiogenesis and evaluation of therapy-induced microvascular changes (12).
In current clinical settings, only contrast agents with low molecular weight are used. These products show rapid extravasation from both tumor and normal blood vessels to the extracellular space. On the other hand, a contrast agent with high molecular weight shows only limited extravasation through normal blood vessels. Due to higher permeability of the tumor vasculature, macromolecular agents can penetrate the tumor and can provide better tumor detection with DCE-MRI (13). Generally, low molecular weight gadolinium-based agents often tend to overestimate tumor blood volume and vascular permeability because of their rapid extravasation from the blood to the extracellular space in tumor tissue. Meanwhile, macromolecular agents are known to provide more accurate tumor characterization and are superior in the differentiation of tumor vascular permeability (1456).
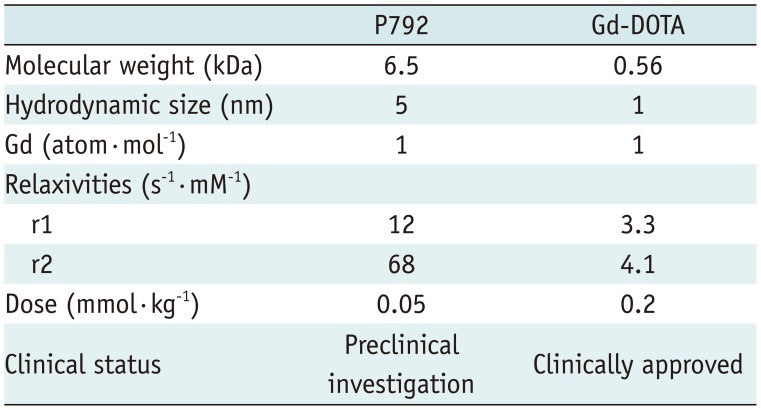
P792 (gadomelitol, Vistarem®, Guerbet, Aulnay-Sous-Bois, France) is a monogadolinated blood pool agent for MRI. It is a macromolecular gadoterate meglumine (Gd-DOTA, Dotarem®, Guerbet, Aulnay-Sous-Bois, Paris, France) derivative of 5 nm in diameter and 6.5 kDa in molecular weight, which is 5 times larger and 10 times higher than that of Gd-DOTA, respectively (78). P792 was originally developed as a blood pool agent with rapid clearance and mainly free renal elimination (1). It also has a high plasmatic relaxivity that facilitates smaller injection doses and a limited diffusion rate through normal vascular endothelium (9). A previous study that compared DCE-MRI pharmacokinetic parameters using contrast agents of different molecular weights in an animal model indicated the highest relative increase in Ktrans in tumor tissue compared with normal tissue with the use of macromolecular agent (P792) (1). Permeability parameters are highly dependent on the contrast agent used, and P792 showed highest tumor-selective permeability when 3 (low-, intermediate-, and high-molecular weight) kinds of contrast agents were compared (1).
A recent study showed that DCE-MRI is a feasible modality for demonstrating the serial changes in the vascular disrupting effect of CKD-516 (Chong Kun Dang Pharm, Seoul, Korea) (10). The vascular disrupting agent (VDA) CKD-516 is a newly developed small-molecule drug that inhibits tubulin polymerization via dual action mechanisms i.e., rapid disruption of established tumor vasculature by microtubule destabilization and apoptosis caused by cell-cycle arrest (1112). Because VDA is a primarily cytostatic agent, DCE-MRI can be used as a surrogate biomarker for the assessment of response to VDA by monitoring the hemodynamic changes (10).
The purpose of this study was to validate the utility of DCE-MRI using a macromolecular agent (P792), as compared with that using a low molecular weight agent in the assessment of vascular disrupting effect of CKD-516 in rabbit liver tumor models.
MATERIALS AND METHODS
Animal Model
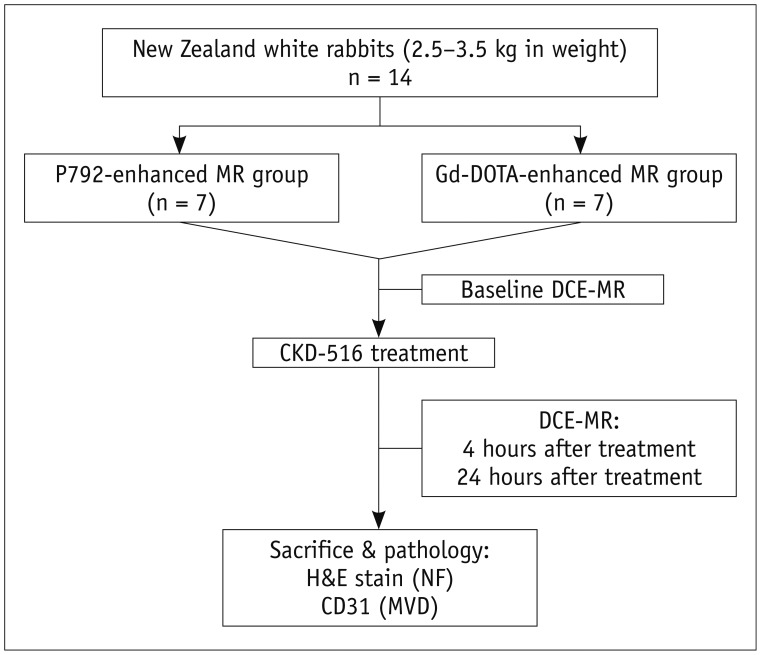
This study was approved by the Animal Care and Use Committee of Seoul National University Hospital (IACUC No.12-0305). Fourteen male New Zealand White rabbits weighing 2.5-3.5 kg were used. Before tumor implantation, animals were sedated with an intravenous injection of 5 mg/kg of a 1:1 combination of tiletamine hydrochloride and zolazepam and xylazine hydrochloride. The left lobe of the liver was exposed through a midline abdominal incision, and approximately 1 mm3, minced pieces of harvested VX2 carcinoma tissue were locally implanted. Tumors were incubated for 10-12 days after the tumor implantation prior to baseline imaging.
Experimental Protocol
At 12 days after tumor implantation, 14 tumor-carrying rabbits were randomly divided into the P792 group (n = 7) and the Gd-DOTA group (n = 7). Immediately after baseline MRI scanning, CKD-516 was administered by slow intravenous injection over 5 minutes via the auricular vein. Follow-up MRI was performed at 4 hours and 24 hours after treatment (Fig. 1).
MRI Contrast Agents
P792 and Gd-DOTA were used and their characteristics were presented in Table 1. P792 has a blood pharmacokinetic profile comparable to that of Gd-DOTA, but its higher molecular weight and larger diameter result in the slowing down of the rotational rate of P792, and therefore higher relaxivity is obtained (4). For similar T1 effects with both agents, the injected dose of P792 (0.05 mmol/kg) is consequently lower than that of Gd-DOTA (0.2 mmol/kg).
MRI Acquisition
MRI examinations were performed using a 3-T MRI system (Magnetom Trio, Siemens Medical Solutions, Erlangen, Germany) and using a human knee coil. Before scanning, anesthesia was induced as described above. After routine localization images, transverse T2-weighted fast spin echo images (repetition time [TR] = 4100 msec, echo time [TE] = 87 msec, slice thickness = 3 mm, matrix = 512 × 358) and T1-weighted images using a gradient echo sequence (TR = 3.5 msec, TE = 1.5 msec, slice thickness = 3 mm, matrix = 128 × 128) were acquired. For T1 mapping, unenhanced T1-weighted volumetric interpolated breath-hold examination (VIBE) images were acquired at each of the 3 flip angles using the following parameters: TR = 3.9 msec, TE = 1.4 msec, flip angles α = 2°, 8°, and 15°, slice thickness = 3 mm, number of excitation (NEX) = 4, field of view (FOV) = 14 × 14 cm, matrix = 128 × 128, number of slices = 20. Then, DCE-MRI using a free-breathing, radial three-dimensional VIBE with k-space-weighted image contrast reconstruction was performed after an intravenous bolus injection of contrast agent. The parameters were TR = 3.5 msec, TE = 1.5 msec, flip angle = 11°, slice thickness = 3 mm, NEX = 2, receiver bandwidth = 780 Hz/pixel, FOV = 14 × 14 cm, matrix = 128 × 128, number of slices = 20. The DCE-MRI was continuously scanned 15 times during 180 seconds.
Image Analysis
DCE-MRI Parametric Map Acquisition
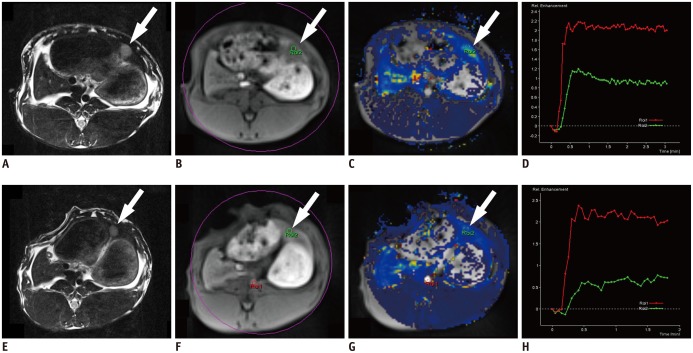
As in most of the earlier DCE-MRI trials for vascular targeting agents, we selected perfusion parameters including voxel-wise perfusion maps of volume transfer coefficient (Ktrans) and initial area under the gadolinium concentration-time curve until 60 seconds (iAUC) to evaluate the perfusion changes induced by CKD-516 (10). Parameteric maps of Ktrans and iAUC were generated from DCE-MRI using a post-processing software program (Tissue4D, Siemens Medical Solutions, Erlangen, Germany) based on the Tofts model (Fig. 2) (15).
Quantitative Measurement
For the quantitative image analysis, 1 blinded radiologist measured the tumor size. Response to treatment was determined by the change in tumor size defined as the longest diameter (LD) measured on axial T2-weighted images. For each animal, percentage change in tumor size between baseline and 24-hour follow-up scans was calculated using the following equation: size change (%) = ([LD24 hours - LDbaseline] / LDbaseline) × 100.
For each time point, DCE-MRI values including Ktrans and iAUC of the tumor were measured using an operator-defined region of interest (ROI). Each ROI was drawn by outlining the tumor border on each parametric map, from a section that included the LD of the tumor. Percentage changes in DCE-MRI parameters relative to baseline were calculated as follows: value change (%) = ([Valuegiven time - Valuebaseline] / Valuebaseline) × 100.
Reproducibility of MRI Parameter Measurements
For each contrast agent group, measurement reproducibility was assessed by the calculated intraclass correlation coefficient (ICC). Measurement of MRI parameters was performed thrice for the same image set, using the ROI drawn on the tumor by the same radiologist who had performed the postprocessing of DCE-MRIs. Each of the 3 measurements was done at an interval of at least 2 weeks to minimize recall bias, and the median value out of the 3 measurements was selected for the quantitative analysis. Agreement was classified as poor (ICC = 0-0.20), moderate (ICC = 0.40-0.75), or excellent (ICC > 0.75). The ICCs were reported with a 95% confidence interval (CI).
Qualitative Image Analysis
Qualitative assessment of source MR images was performed. Images were qualitatively assessed by a board-certified abdominal radiologist. The observer was blinded to the contrast agent used. Overall image quality of the DCE-MRI was scored on a 4-point scale where 1 = poor, 2 = fair, 3 = good, and 4 = excellent.
Histologic Analysis
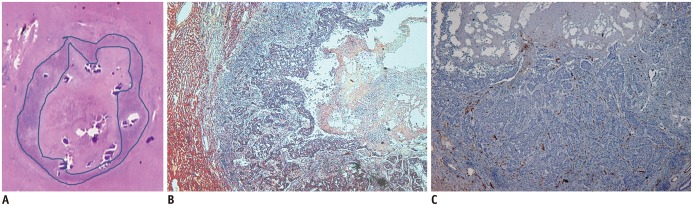
After the 24-hour follow-up MRI, animals were sacrificed by intravenous injection of potassium chloride under deep anesthesia, and frozen at -70℃ in a plastic frame to maintain their posture to avoid misregistration between the MR images and the pathologic specimens. Pathologic specimens were sectioned in the transverse plane at a 1 mm interval to match the MR images. For each tumor, a representative microscopic section that matched the corresponding MR image was selected. For each tumor tissue, hematoxylin and eosin, and CD31 staining were performed to evaluate the necrotic fraction (NF), and blood microvessel density (MVD) of the tumor, respectively. The percentage of tumor necrosis (necrotic area to the total tumor surface) was assessed in a semiquantitative manner using the following scoring scale: 1 = 0-20%, 2 = 21-40%, 3 = 41-60%, and 4 > 61%. To determine the histologic vascular parameters of the tumor, hot spots indicating higher vascular density areas than those in the rest of the tissue were chosen at low magnification (× 40) and CD31 stained vessels were counted at a high magnification (× 200, 0.544 mm2). The mean of 3 measurements in the hot spots was used as the mean MVD of the tumor.
Statistical Analysis
Mann-Whitney U test was used to determine whether there were differences in interval changes in the tumor size between the 2 groups. In the animals that survived until the 24-hour follow-up MRI, serial changes in DCE-MRI parameters at different time points were evaluated and compared between the 2 groups using Mann-Whitney U test. Spearman rank correlation test was performed to assess the correlation between the 24-hour follow-up MRI parameters and corresponding histologic features such as NF and MVD. Intra-measurement reproducibility of the DCE-MRI was assessed through the calculation of ICC. Comparison of the reproducibility of MRI parameter measurements between the 2 groups was done using the Z-test. Overall image quality of the 2 groups was compared using the Mann-Whitney U test. A p value < 0.05 was regarded as statistically significant. All statistical analyses were performed using MedCalc software version 12.2.1.0 (MedCalc Software, Mariakerke, Belgium).
RESULTS
One rabbit in the Gd-DOTA group died after 4-hour MRI scanning. Finally, 13 animals (n = 7 in the P792 group and n = 6 in the Gd-DOTA group) were included in the DCE-MRI and histologic analyses.
Comparison of Change in the Tumor Size after Treatment
In the P792 group, the mean diameter of the tumors was 0.81 ± 0.14 cm (mean ± standard deviation) before treatment and 0.73 ± 0.14 cm at 24-hour after treatment. Change in the tumor size was -9.96 ± 7.53%. In the Gd-DOTA group, the mean diameter of the tumors was 0.86 ± 0.11 cm before and 0.78 ± 0.08 cm at 24-hour after treatment, and the change in tumor size was -8.8 ± 5.64%. Tumor size reduction was not statistically significant in both groups at 24-hour after treatment, and the degree of change in tumor size was not significantly different between the 2 groups (p > 0.05).
Comparison of Change in the DCE-MRI Parameters after Treatment
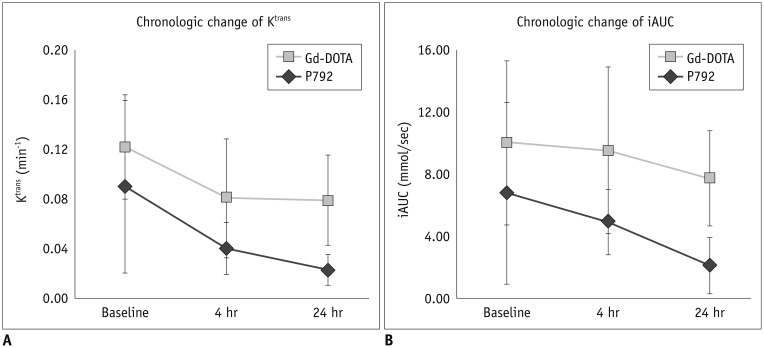
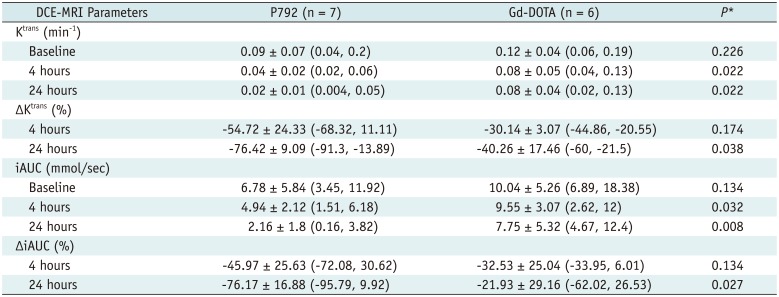
The median values of the percentage change in DCE-MRI parameters relative to the baseline in each group at each time point were summarized in Table 2 and chronologic change of parameters in the 2 groups were displayed in Figures 2 and 3. Baseline values of DCE-MRI parameters were not significantly different in both study groups (p = 0.226 for Ktrans and p = 0.134 for iAUC). However, both MRI parameter values were significantly different after 4 hours and 24 hours of treatment in both groups. Overall relative percentage changes in Ktrans and iAUC, at 4-hour and 24-hour after treatment, were greater in the P792 group than in the Gd-DOTA group. The differences were statistically significant at 24-hour after treatment (p = 0.038 for Ktrans and p = 0.027 for iAUC).
Correlation of DCE-MRI Parameters with Histopathology after Treatment
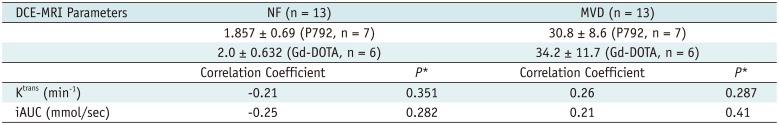
The mean NF was 1.857 ± 0.69 in the P792 group and 2.0 ± 0.632 in the Gd-DOTA group. The mean MVD was 30.8 ± 8.6 in the P792 group and 34.2 ± 11.7 in the Gd-DOTA group. DCE-MRI parameters at the 24-hour follow-up examinations and the corresponding histologic features were correlated. Both NF and MVD showed a weak correlation with DCE-MRI parameters (p > 0.05) (Table 3, Fig. 4).
Reproducibility of MRI Parameter Measurements
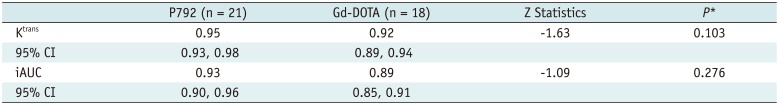
There were 21 MRI sets in total in the P792 group, and 18 MRI sets in the Gd-DOTA group. The ICC values were shown in Table 4. In the P792 group, Ktrans and iAUC showed ICC values of 0.95 (95% CI, 0.93-0.98) and 0.93 (0.90-0.96), respectively. In the Gd-DOTA group, Ktrans and iAUC showed ICC values of 0.92 (0.89-0.94) and 0.89 (0.85-0.91), respectively. Intra-measurement agreement was higher in the P792 group than in the Gd-DOTA group, but without statistical significance (p > 0.05).
DISCUSSION
Our study results demonstrated the usefulness of DCE-MRI using a macromolecular contrast agent in the evaluation of the antivascular drug effect. Ktrans and iAUC of the VX2 liver tumor significantly decreased at 24 hours after CKD-516 treatment in the P792-enhanced DCE-MRI group. As a comparison group, DCE-MRI using Gd-DOTA confirmed the results of the previous study and showed reproducibility (10). Furthermore, the antivascular effect using a macromolecular agent in DCE-MRI verified that a macromolecular agent is feasible for DCE-MRI studies in clinical practice. The result obtained in this study indicated that a 4 times lower dose of macromolecular agent is as effective as a low-molecular weight agent in antivascular drug. Ktrans and iAUC values of P792 and Gd-DOTA were similar in untreated tumors. In all of the groups, tumors were equally permeable to the macromolecular agent prior to CKD-516 treatment.
Furthermore, in our study, the overall percentage decrease in the DCE-MRI parameters after antivascular treatment was more prominent in the P792 group, as compared with the Gd-DOTA group. As mentioned above, low molecular weight agents often overestimate tumor blood volume and vascular permeability, because they readily diffuse across endothelial walls of both normal vessels and tumor vessels. Meanwhile, macromolecular agents provide more accurate tumor characterization and are better able to differentiate tumor vascular permeability (16). The decrease in tumor vascularity and therefore endothelial permeability at 24 hours after CKD-516 treatment is consistent with the reduced vessel permeability reported in previous studies with various antiangiogenic drugs and tumor types (510). Interpretation of vascular kinetic parameters requires the consideration of balance between blood flow and capillary permeability in the tissue of interest. Ktrans is a function of flow (perfusion) and permeability. When permeability is high, Ktrans is dependent on the blood flow. On the other hand, in cases of low permeability, Ktrans is more influenced by the permeability surface area (12). This ability is highly associated with the molecular weight of the contrast agent. After antiangiogenic treatment, tumor vascular permeability is decreased and Ktrans at this stage reflects permeability more than tumor blood flow (12). This explains the higher percentage decrease in Ktrans and iAUC in the P792 group after treatment.
Owing to the high relaxivity of P792, only a quarter of the Gd-DOTA dose was sufficient, thereby reducing the possible risk of gadolinium toxicity. This is particularly important in patients with preexisting renal disease. Of note, repeated administration of a gadolinium-based extracellular agent increases the risk of nephrogenic systemic fibrosis (16). P792 allows for a lower injection dose than Gd-DOTA, which may be useful in decreasing the gadolinium dose.
A less encouraging but expected result is that the histologic examination in our study showed only a weak correlation between the degree of tumor necrosis or MVD and DCE-MRI parameters in both groups, although several previous studies confirmed a positive correlation between tumor angiogenic activity and DCE-MRI parameters (617). However, the application of MVD as a biomarker for validating the VDA effect is debatable; histologic MVD may not reflect the functional vascular properties after VDA treatment (10). DCE-MRI may be superior to the histologic method for characterization of tumor angiogenic activity because histologic capillary density reflects only the anatomic number of microvessels in sites of greatest vessel density, while DCE-MRI parameters also consider the volume and permeability of these vessels as well as their number (17). Therefore, DCE-MRI may be more comprehensive than microvessel count in providing tumor characterization. The Ktrans parameter is most physiologically correlated with tumor vascularity and permeability, and is a recommended biomarker for the evaluation of the early therapeutic effect of VDA (18).
In the assessment of reproducibility, the P792 group showed higher inter-measurement agreement. Overall image quality scoring was also slightly higher in the P792 group without statistical significance, in partial agreement with our expectation considering the higher T1 relaxivity of the macromolecular agent. According to a previous pharmacokinetic study of P792 in the animal model, normalized plasma concentration of 0-10 minutes is reportedly much higher than that of Gd-DOTA (19). This indicates that P792 compartmentalizes in the vascular space, while decreased plasma concentration reflects unlimited glomerular filtration.
This study has several limitations. First, intra-individual comparison of the 2 MRI contrast agents in the assessment of DCE-MRI parameter was not performed. Use of the 2 agents consecutively in the same study subject was not feasible due to image contamination caused by the previous agent. Instead, we tried to control the parameters such as tumor size between the 2 groups to minimize confounding effects. Second, for measurement of DCE-MRI parameters, 1 ROI on 1 axial MR image of the tumor at each time point was selected. Measurement on cross-sectional images might be less representative of the entire tumor than volumetric measurement, when the three-dimensional characteristics of the tumors are considered. In addition, measurement with 1 ROI including the whole tumor may not sufficiently demonstrate the pixel-by-pixel changes in the serial follow-up (13). Third, since we only evaluated the histologic features on the 24-hour follow-up scan, correlation between any early changes (i.e., 4-hour after treatment) in the DCE-MRI parameters and corresponding histologic changes could not be assessed. An earlier study with a similar design using only a low molecular weight agent showed no correlation between the MVD and the Ktrans value at 4-hour post treatment (10). These shortcomings remain a subject for future investigations. Fourth, only 2 DCE-MRI parameters, i.e., Ktrans and iAUC were evaluated in this study. Even though other parameters such as Kep or Ve would provide additional information, vascular volume and permeability were analyzed in this study, as well as a prior one (10).
In conclusion, our preclinical study suggested that DCE-MRI using a macromolecular agent is superior to that using a low molecular weight agent in the demonstration of antivascular drug effect. In addition, the reproducibility of MRI parameter measurements and overall image quality are the same for the macromolecular and low molecular weight agents, with approximately 1/4th smaller dose of gadolinium than the low molecular agent. Therefore, DCE-MRI using a macromolecular agent may serve as a promising tool for monitoring the antivascular treatment. Despite the limitations mentioned above, the use of macromolecular agent in reducing the possible risk of gadolinium toxicity would expand the patient indication.
 XML Download