

 PDF
PDF ePub
ePub Citation
 Print
Print


INTRODUCTION
Diffusion tensor imaging fiber tracking (DTI-FT) is a unique method that measures relative diffusion coefficients along fiber tracts (1, 2) and reveals the orientation and integrity of white matter (WM) tracts in vivo (3, 4, 5, 6). Between the two common groups of FT algorithms, deterministic FT provides more improved information (7, 8) than probabilistic FT (9, 10). Deterministic DTI-FT can be used to assess WM characteristics over the entire extent of WM tracts and aggregated fiber bundles (11). A variety of tract characteristics have been qualitatively and quantitatively measured in the fields of neural disease, neurosurgical planning, and real-time image-guided neurosurgery (12, 13, 14, 15).
Diffusion tensor imaging protocols generally involve diffusion-weighted (DW) measurements in at least six non-collinear number of diffusion gradient directions (NDGDs). As NDGD increases, more directional DW images are acquired to calculate the derived tract characteristics at the expense of longer scanning time (16). The maximum NDGD could extend to 256 directions spread isotropically over a sphere (17). However, the effects of NDGD on diffusion tensor tract characteristics in human studies have yielded variable results. Some researchers have claimed that using more than six DW gradient directions provides a better measure of the diffusion tensor than the conventional six directions (18), and the minimum NDGD for robust estimates of anisotropy is 18-21 directions (19). However, other researchers have suggested that varying NDGD does not change scalar indices for a specific region of interest (ROI) analysis (20). More recently it was reported that six-direction data provide diffusion measures with comparable robustness to 30 or even more directional data. Appropriate parameter values for most WM tracts have been determined using a deterministic FT algorithm (21). The optimum NDGD in DTI protocols for determining tract characteristics remains unclear, and the effects of NDGD on diffusion tensor tract characteristics remain controversial. Thus, the purpose of this study was to investigate the effects of different NDGDs on diffusion tensor tract characteristics.
MATERIALS AND METHODS
Subjects
Twelve healthy volunteers (mean age, 27.1 ± 4.5 years; range, 22-34 years) with no known neurological disorder or brain injury underwent DTI scanning with NDGDs of 6, 11, 15, 21, and 31 orientations. The scanning protocol was approved by the local Institutional Ethics Committee. This study was carried out according to the standard procedures of the Hospital Ethics Committee and with written consent of the human subjects.
DTI Protocols
All scans were acquired using a 1.5-T magnetic resonance scanner (GE Healthcare, Waukesha, WI, USA) equipped with a standard head coil. Head motion was minimized using restraining foam pads provided by the manufacturer. Sagittal T1-weighted images were acquired with slices clearly showing the anterior commissure (AC) and the posterior commissure (PC). Diffusion-coded images parallel to the AC-PC line were then obtained utilizing a multiple-slice single-shot SE DW echo planar imaging sequence with the following parameters: acquisition matrix, 128 × 128; reconstruction matrix, 256 × 256; field of view, 240 mm; repetition time/echo time, 6000/80 ms; flip angle, 90°; slice gap, 0 mm; and b, 1000 s/mm2. The DW images were acquired from the five most common NDGDs (6, 11, 15, 21, and 31 non-collinear gradient orientations); baseline images had no diffusion weighting.
Tract Selection
White matter fiber tracts connecting different regions of the brain have complex pathways. The WM tracts are classified into three types based on the size of the connected areas, such as tract branch, individual tract, and whole brain. In our scheme, three fiber tract groups, including the splenium of the corpus callosum (CC), the entire CC, and the full brain tract were chosen to be evaluated for tract characteristics. The CC is the largest WM structure in the human brain and carries the majority of communication between the two brain hemispheres. It has confirmed anatomical pathways and can be easily distinguished from other fiber tracts. Therefore, the entire CC was selected to observe the effects of NDGD on individual tracts. The CC consists of four parts: the splenium, genu, body, and rostrum. The splenium of the CC was chosen as a typical tract branch for the detailed evaluation of NDGD on tract characteristics. The full brain tract occupies the entire WM structure in the human brain; this was also employed to study the overall effects of NDGD on DTI-FT.
Tract Characteristics
Tract characteristics are used to describe specific WM tracts in anatomical shape, length, and diffusion properties. Tract architecture was used to evaluate the anatomical structures of the fiber tracts produced at five given NDGDs. Six tract characteristics (number of fibers [NF], average length [AL], fractional anisotropy [FA], relative anisotropy [RA], mean diffusivity [MD], and volume ratio [VR]) were used to evaluate the three selected fiber tract groups. The measure of NF was derived from a DTI quantitative analysis and provided an index of the NF paths traversing a ROI (22). AL was used as a metric to measure the mean length of all streamlines for a given fiber tract in mm (23). FA and RA revealed all anisotropic properties of water diffusion (24). MD measured the MD along the selected tracts by averaging the lengths of the three axes of each ellipsoid (24). VR represented the average ratio of each ellipsoid volume to its sphere volume (24).
Tract Propagation
Twelve DW image sets and B0 image sets were processed using DTI Studio (Processing Tools and Environment for Diffusion Tensor Imaging, ver. 3.0, H. Jiang and S. Mori, Radiology Department, Johns Hopkins University, Baltimore, MD, USA) to generate tensor field data (23). FT then employed the fiber assignment using the continuous tracking algorithm, which propagates in streamlined anterograde and retrograde directions from an initial seed point along the direction of the major eigenvector using a fixable spatial increment (25, 26, 27). The multi-directional DW images were aligned at the pre-processing step using the image registration algorithm packaged in the automated image registration (23). The defined termination criteria for the FA threshold, turning-angle, propagated step, and background threshold were used to suppress false-positive tracking or to stop tracking. The four thresholds we used were: FA threshold, 0.25; turning angle, 60°; propagated step, 2000; and background threshold, 20. Hand-drawn ROIs at the tract branch level, the tract level, and the whole brain level were used to display the splenium of the CC, the whole CC, and the full brain tract, respectively.
Visual Observation
The structures of the splenium of the CC, the whole CC, and the full brain tract were visually inspected for shape and anatomy from two- (2D) and three-dimensional (3D) views. Each tract was overlaid with the FA images to display the propagated fiber pathways for clear observations.
Statistical Analyses
The six tract characteristics were also measured using DTI Studio. Statistical analyses for the splenium of the CC, the whole CC, and the full brain tract were performed at the tract branch, the tract, and the whole brain levels to evaluate differences in NF, AL, FA, RA, MD, and VR among the five NDGDs groups, respectively. Repeated-measures analysis of variance (RMANOVA) was performed for each tract characteristic to determine whether a statistically significant difference occurred within the five NDGD groups; NDGD was the analysis of variance factor. We specified five levels for this factor, and indicate the quantitative variables in the dataset associated with the levels for the within-subjects factor. If the initial hypothesis that the means were equal is rejected, then follow-up pairwise comparisons were conducted to determine which of the means differed significantly. Additionally, the trend in each tract characteristic with increasing NDGD was also predicted. Statistical analyses were performed using SPSS ver. 19.0 software package (SPSS Inc., Chicago, IL, USA). P values < 0.05 were considered significant. We did not adjust the significance criterion for multiple pairwise comparisons given the exploratory nature of the study.
RESULTS
Qualitative Evaluation
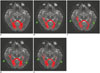
Figure 1 shows the splenium of the CC with five NDGDs (6, 11, 15, 21, and 31 orientations) at the tract branch level. A visual inspection revealed that the anatomic structure of the tracked fibers was recorded accurately at all five NDGDs. However, a higher NDGD (11, 15, 21, and 31 orientations) (green arrows in Fig. 1B-E) detected longer fibers that extended into bilateral temporal lobes. The DTI-FT with larger NDGDs (11, 15, 21, and 31 orientations) gave better tracking than DTI-FT with NDGD of six orientations.
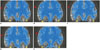
Figure 2 shows the tracked CCs with five NDGDs (6, 11, 15, 21, and 31 orientations) at the tract level. More branches of the CC were propagated to the bilateral cerebral hemispheres with increasing NDGD, and their anatomical structure coincided with the WM anatomy in the 2D and 3D views. No differences were detected at NDGDs of 11, 15, 21, and 31 directions, as shown in Figure 2B-E by the white arrows.
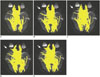
Figure 3 demonstrates full brain tracts with five different NDGDs (6, 11, 15, 21, and 31 orientations) at the whole brain level. After a detailed examination, the tracked fibers almost matched the anatomic configuration. More tracts were extended to the brainstem and cerebellum with high FA values (labeled by yellow arrows in Fig. 3) at five higher NDGDs. Some low FA value tracts in the parietal lobe showed different configurations; one such difference is indicated by the red arrows in Figure 3.
Quantitative Analyses
Mean values and standard deviations (SD) of NF, AL, FA, RA, MD, and VR are listed in Table 1 for tract branch level analyses with five NDGDs. The means of NF, FA, RA, MD, and VR decreased slightly when NDGD increased from 6 to 31 orientations, whereas AL showed a marginal increase. Each tract characteristic was analyzed by RMANOVA and revealed significant (p < 0.05) differences within the five NDGD groups. The tract characteristics of NF, FA, RA, MD, and VR with NDGD of six orientations were significantly greater (smallest p = 0.001 to largest p = 0.041) than those with other NDGDs (11, 15, 21, or 31 orientations), whereas AL measured with NDGD of six was significantly smaller (smallest p = 0.001 to largest p = 0.012) than with four other NDGDs (11, 15, 21, or 31 orientations). No differences were detected among the four NDGD groups of 11, 15, 21, and 31 directions (smallest p = 0.137 to largest p = 1.000). The trend in each tract characteristic with increasing NDGD was a quadratic correlation, with positive changes for AL and negative changes for NF, FA, RA, MD, and VR.
The means and SDs of NF, AL, FA, RA, MD, and VR at the tract level are listed in Table 2. The mean values of tract characteristics had the same trend as those measured at the tract branch level. Accordingly, the statistical analysis produced similar results as the analyses at the tract branch level. The tract characteristics of NF, FA, RA, MD, and VR with NDGD of six orientations were significantly greater (smallest p = 0.001 to largest p = 0.042) than those with other NDGDs (11, 15, 21, or 31 orientations), whereas AL measured with NDGD of six was significantly smaller (smallest p = 0.001 to largest p = 0.041) than with four other NDGDs (11, 15, 21, or 31 orientations). No differences were observed among the four NDGD groups of 11, 15, 21, and 31 directions (smallest p = 0.374 to largest p = 1.000).
The NF, AL, FA, RA, MD, and VR values at the whole brain level were compared at the five NDGDs, and the means and SDs are listed in Table 3. The results of statistical analysis were similar to those of the two analyses at the tract branch and tract levels. The tract characteristics of NF, FA, RA, MD, and VR with NDGD of six orientations were significantly greater (smallest p = 0.001 to largest p = 0.030) than those with other NDGDs (11, 15, 21, or 31 orientations), whereas AL measured with NDGD of six was significantly smaller (smallest p = 0.001 to largest p = 0.022) than with four other NDGDs (11, 15, 21, or 31 orientations). No differences were observed among the four NDGD groups of 11, 15, 21, and 31 directions (smallest p = 0.059 to largest p = 1.000).
CONCLUSION
We investigated the effects of NDGD on diffusion tensor tract characteristics. The gradient-coded schemes in our DTI protocols were changed from the most commonly used six orientations to 31 orientations to evaluate the effects of NDGD on tract characteristics. Our findings suggest a balance between improved resolution and acceptable scan time. Specifically, we conclude that 1) small NDGD is valuable for real-time reconstruction of main fiber tracts; 2) higher NDGD permits more accurate FT; and 3) NF, FA, AL, RA, MD, and VR tract characteristics were not different with larger NDGDs (11, 15, 21, or 31 orientations).
Because DTI protocols employ multiple imaging parameters all other parameters were held constant throughout our study, to eliminate their effects (28). DTI Studio software is widely used in clinical research and was used here for 3D reconstruction of the fiber tracts (29, 30, 31). Precise tensor estimations are particularly important to pre-align DW images (32, 33). Diffusion anisotropy, the number of streamlines, and AL provide useful information for clinical evaluations of a given fiber tract, shape, and anatomy (34). Therefore, we evaluated fiber architecture of NF, AL, FA, RA, MD, and VR in all cases.
Number of diffusion gradient directions and image noise are the two major factors that affect accuracy of tensor computations for the derived tract characteristics. Larger NDGD means that more directional DW images can be used to improve accuracy of the tensor computation. Image noise can increase eigenvalues, leading to deterioration of DTI-FT, and could introduce a positive bias into the calculated direction-correlated RA and FA values (35, 36). It was previously reported the signal-to-noise ratio (SNR) improves significantly when NDGD is increased from six to 30 orientations (37). DTI-FT with a larger NDGD and an improved SNR allows better tract reconstruction.
Visual inspection revealed that DTI-FT with smaller or larger NDGDs detected most of the fiber tracts. DTI-FT with smaller NDGDs did not faithfully reconstruct some full brain tracts in low FA brain regions. It was evident that accuracy of the tensor computation would worsen in low FA regions. Therefore, the propagated tracts with varying NDGD in low FA regions had different configurations. DTI-FT showed significant improvement with larger NDGD at the expense of longer scan times.
Number of fibers, FA, RA, MD, and VR values were maximal and AL values were at their minimum at NDGD of six orientations, with the lowest SNR among the five NDGDs. The FA and RA measure produced positive bias which was consistent with previous reports (35, 36, 37). MD and VR become larger at the lowest SNR due to higher eigenvalues. Accordingly, some false fibers might be produced and lead to increase of NF, and deteriorated FT performance resulted in a decrease in AL. However, increasing NDGD beyond 11 did not change the tract characteristics. A sufficient number of directional DTI with a higher SNR would improve the accuracy of the tensor computation.
Our study had two limitations. Firstly, many voxels at the fiber crossing regions contained multiple fiber pathways. In this study, only the deterministic FT based on the single-tensor model was used for fiber propagation, indicating that the fiber reconstruction algorithm was limited to true fiber reproduction. More detailed fiber information would be provided by deterministic FT based on the multiple tensor models (38, 39). Therefore, evaluating DTI-FT using multiple tensor models could be a future study. Secondly, DTI tract measurements are very sensitive to minor differences in MR hardware, scanning protocols and processing details. Until now, it was impossible to obtain a gold standard to evaluate reliability or consistency of DTI acquisition protocols with varying NDGDs. More sophisticated and probably more exhaustive studies on a variety of MR scanners may be needed to form conclusions.
In conclusion, our observations provide a basis for balancing an accurate evaluation of tract characteristics against acceptable scan time. It is possible to detect the main fiber tracts with NDGD of six orientations; however, using more NDGD (≥ 11 orientations) may improve the tract characteristics at the expense of longer scan times.


 XML Download