

 PDF
PDF ePub
ePub Citation
 Print
Print


INTRODUCTION
Chronic liver diseases cause a global public health problem as they result in hepatic fibrosis (HF) and ultimately lead to cirrhosis, decompensated liver disease, and hepatocellular carcinoma (HCC) (1). Among the various causes of chronic liver diseases, hepatitis B virus (HBV) infection is the most common cause in Asian countries including South Korea. In patients with HBV infection, determining the severity of HF is particularly important for several reasons (2). First of all, the degree of fibrosis has prognostic significance. The prognosis of patients with chronic HBV infection is affected by the extent and progression of fibrosis. Furthermore, it is important to evaluate HF as it can provide important information not only for making the diagnosis but also for optimal treatment planning (3). Although percutaneous liver biopsy is the most commonly used technique as well as the gold standard for the assessment of HF (4), it has some limitations such as possible procedure-related complications, sampling error, and intra- or interobserver variability leading to overstaging or understaging of fibrosis (5, 6). These limitations of liver biopsy have led to the development of alternative, noninvasive methods for evaluating HF (4, 7).
Until now, several noninvasive imaging techniques, including magnetic resonance elastography (MRE), diffusion-weighted magnetic resonance imaging, dynamic contrast-enhanced magnetic resonance imaging, and ultrasonography (US)-based elastography techniques such as transient elastography (TE) or Acoustic Radiation Force Impulse Imaging, have been investigated in order to assess HF (8-12). Among these methods, MRE is considered to be a promising noninvasive tool for the longitudinal evaluation of the degree of HF due to its high technical success rates and good diagnostic performance (9, 13, 14). Furthermore, MRE has several advantages over US-based elastography techniques such as a larger sampling volume and a lower technical failure rate, especially in patients with a large body habitus or ascites (4, 5, 15).
Despite the high diagnostic performance of MRE for staging HF in patients with chronic liver diseases, previous studies have shown different cutoff values for differentiating between each stage of HF stage (9, 16, 17). The variability noted in these studies could be associated with evaluation of cases with diverse etiologies of chronic liver disease such as HBV or hepatitis C virus infection and alcoholic hepatitis. For example, the presence of pericellular fibrosis and thickening of the terminal hepatic venule are the main distinguishing histological features of alcoholic hepatitis, while bridging type of fibrosis is more predominant in chronic hepatitis B (CHB) or chronic hepatitis C (CHC) than in alcoholic hepatitis (18). In addition, the total fibrotic material in CHB may be lower than that in CHC (17, 19). Although there are a few studies of MRE that focused on a single cause of chronic liver disease, these studies were concerned with CHC as CHC is more prevalent than CHB in most western countries. To the best of our knowledge, however, the diagnostic performance of MRE for the staging of HF in patients with chronic HBV infection as a single underlying cause has not been reported. Therefore, the purpose of this study was to evaluate the accuracy of MRE for the diagnosis of HF in patients with HBV-related liver disease.
MATERIALS AND METHODS
Study Population
Our institutional review board approved this retrospective study, and the requirement for obtaining informed consent from patients was waived. Between August 2009 and June 2011, 980 consecutive patients who underwent liver MR imaging including MRE on a 1.5T MR unit for the evaluation of suspected malignant focal hepatic lesions based on previously performed imaging studies or as a part of liver MR imaging for further evaluation of suspected chronic liver diseases or living liver donor candidacy. Among them, we retrospectively selected 203 consecutive patients with HBV infection and a pathologic diagnosis of HF. HBV infection was diagnosed by positive serology tests for serum hepatitis B surface antigen or hepatitis B e antigen and antibodies. We excluded eight patients who met at least one of the following exclusion criteria: 1) inadequate biopsy specimen to establish a histologic diagnosis of HF (n = 4), 2) impossible to measure the liver parenchymal fibrosis stage because of numerous overlying masses or a huge mass larger than 10 cm in diameter (n = 4).
In addition, between January 2010 and June 2011, we also enrolled 166 potential living liver donor candidates who were screened and evaluated for liver transplantation at our institute. Finally, 195 patients and 166 potential living liver donors (261 males and 100 females; age range, 16-79 years; mean age, 45.3 years) were included; 261 men (mean age, 46.3 years; range, 16-79 years) and 100 women (mean age, 42.7 years; range, 16-73 years). Among the 166 liver donor candidates, liver donation was performed in 129 candidates. Therefore, 195 patients with HBV-related liver diseases, and 129 liver donors had a histologic confirmation of HF or absence of HF, but the other 37 liver donor candidates did not have a histologic evidence of hepatic fibrosis.
MRI Techniques
Magnetic resonance examinations including MRE were performed on a 1.5T whole-body MR unit (Signa HDx; GE Healthcare, Milwaukee, WI, USA) using an eight-channel torso phased-array coil. The standard liver imaging protocol was composed of a respiratory-triggered, T2-weighted, rapid acquisition, relaxation-enhanced sequence; a T2-weighted, single-shot fast spin-echo sequence; a breath-hold T1-weighted dual echo (in-phase and opposed-phase) spoiled gradient-recalled echo sequence; a single-shot spin-echo echo-planar diffusion-weighted imaging sequence with three values (b values of 0, 100, 800); and a T2*-weighted GRE sequence. MRE was performed before the administration of contrast material.
Dynamic three-dimensional fat-saturated spoiled gradient-echo sequences (liver acquisition with volume acceleration; GE Healthcare, Milwaukee, WI, USA) were obtained before and after the intravenous administration of gadoxetate disodium (Primovist®, Bayer Healthcare, Berlin, Germany) at a dose of 0.025 mmol/kg (0.1 mL/kg body weight) at a rate of 1.5 mL/s, followed by a 30-mL saline flush. Using an MR fluoroscopic technique, hepatic arterial-phase images were obtained 9 seconds after the contrast medium arrived in the descending thoracic aorta, and after this two additional sequential axial image sets were obtained at 10-second intervals during the first minute after the hepatic arterial phase, thereby obtaining both portal phase and hepatic venous phase images. In addition, late dynamic phase images and hepatobiliary phase images were obtained at 3 minutes, 10 minutes, and 20 minutes after contrast injection.
MRE
Images were obtained with patients in the supine position using a 19-cm-diameter, 1.5-cm-thick, cylindrical passive longitudinal driver (MR-Touch; GE Healthcare, Milwaukee, WI, USA) placed against the right anterior chest wall with the center of the driver at the level of the xiphisternum. In order to produce propagating shear waves in the liver, continuous longitudinal vibration at 60 Hz was used and was transmitted from the active driver to the passive driver, which was held in place by an abdominal binder (20). A 2-dimensional gradient-echo MRE sequence was used to acquire axial wave images with the following parameters: repetition time/echo time, 100/26.8 ms; flip angle, 30°; field of view, 32-37 cm; matrix size, 256 × 64; slice thickness, 10 mm; and a 5-mm interslice gap. Two to four transaxial slices were obtained for each MRE examination.
The patients were instructed to hold their breath when each slice was being obtained as described in our previous study (21). To obtain a consistent position of the liver for each phase offset, patients were asked to hold their breath at the end of expiration. The MRE acquisition of each slice required two breath-holds, with each breath being held for 16 seconds. After the data acquisition was completed, the shear wave images were automatically processed to generate elastograms, which depicted the shear stiffness in kilopascals (kPa) using a previously described inversion algorithm (22).
Analysis of MRE
Before measuring the mean shear stiffness, one of the authors who was experienced in reading MRE images and elastograms, evaluated the MRE images including the anatomic image set, wave image set, and the elastogram set. To evaluate the quality of the elastograms, this reviewer referenced anatomic images and wave images in each patient, and classified them as either adequate or inadequate MRE examinations. Based on the results of a previous study on MRE (21, 23), inadequate MRE examinations, such as technical failure were determined based on the following: 1) when wave images showed poor wave propagation, 2) anatomic images showed severe respiratory motion along the slice selection axis (z-axis), or 3) there was significant signal loss of the liver parenchyma compared with that of the kidneys and the muscle, which suggested increased iron overload (21, 23).
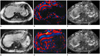
In order to calculate liver stiffness (LS) values of the hepatic parenchyma, three round-shaped (2-3 cm wide) regions of interest (ROI) were placed on the MRE by one reviewer who was blinded to each patient's liver histology results (14). ROIs were drawn in the anatomic image obtained during the MRE acquisition. As a rule, ROIs were usually placed in the right lobe of the liver as the left lobe is prone to cardiac motion artifacts; thus avoiding large hepatic vessels and their large branches, liver edges, and large bile ducts. The ROIs were then transposed to the corresponding position in the wave images to ensure that they were placed in regions with adequate wave propagations which were regular and relatively free of reflections and interference patterns, and were also clearly demonstrated on the confidence map, which displays both reliable and unreliable areas on wave images (24). Finally, the ROIs were copied to the corresponding position in the elastogram, which gave the stiffness values in kPa. The average LS values (kPa) were calculated as the mean value of ROIs on two slices (Fig. 1).
Histopathologic Analysis
Liver specimens of the patients with HBV-related chronic liver disease were obtained from 195 patients: 191 patients had undergone surgery and four patients had undergone percutaneous liver biopsy. In addition, liver biopsy samples were also obtained from 129 liver donors. The specimens were fixed in a formalin-alcohol-acetic acid solution and were embedded in paraffin; 4-mm-thick sections were then cut and stained with hematoxylin-eosin. All specimens were analyzed by one expert hepatopathologist who had seven years of clinical experience in interpreting liver pathology examinations and who was not aware of the MRE results or the clinical data.
The grade of necroinflammatory activity and the fibrosis stage were semi-quantitatively evaluated in 190 patients with HBV infection, and 129 liver donors. However, in five patients, although the fibrosis staging was possible, evaluation of liver cell necroinflammatory activity was not possible due to small volume of the biopsy sample. Although fibrosis mainly causes an increase in the HF values, severe inflammation such as fulminant hepatitis could affect the LS values. Therefore, we wanted to assess whether there is any impact of necroinflammatory activity on LS measurements using MRE.
The necroinflammatory activity in the liver and the liver fibrosis stage were assessed according to the Standardized Guidelines proposed by the Korean Study Group for the Pathology of Digestive Diseases (25-27). The grade of necroinflammatory activity consisted of lobular activity (L) and porto-periportal activity (P), both of which were graded from 0 to 4 where 0 = none, 1 = minimal, 2 = mild, 3 = moderate, and 4 = severe. Fibrosis was also graded as F0-F4 as follows: F0 = no fibrosis, F1 = portal fibrosis, F2 = periportal fibrosis, F3 = septal fibrosis, and F4 = cirrhosis (27).
Statistical Analysis
All statistical analyses were performed using commercial software (SPSS, version 17, SPSS Inc., Chicago, IL, USA; MedCalc, MedCalc Software, Mariakerke, Belgium; and Instat 3.05, GraphPad Software, San Diego, CA, USA). We determined the technical success rate of MRE after excluding the cases showing poor wave propagation on wave images, severe respiratory motion along the z-axis on anatomic images, or increased iron overload on T2*-weighted images. Among the patients with successful MRE images, the diagnostic performance of MRE for detecting significant fibrosis (≥ F2), advanced fibrosis (≥ F3), and cirrhosis in CHB patients, was evaluated by using receiver operating characteristic (ROC) curves and its 95% confidence interval (28), and the results were expressed according to the sensitivity, specificity, positive and negative predictive values, and area under the receiver operating characteristic curve (Az). The living liver donor candidates who did not have a pathologic results of hepatic fibrosis were regarded as being F1, as they had no clinical and laboratory abnormal findings which suggests presence of liver diseases. Spearman's correlation coefficients (r) and their associated probability (p) were also used to assess the correlations between the stiffness value (measured by MRE), the fibrosis score, and the inflammatory score. A p value less than 0.05 was considered statistically significant.
RESULTS
Success Rate and Patient Characteristics
In 27 of the 361 study patients (7.5%), the MRE examination was classified as being inadequate and causes of the technical failures were poor wave propagation seen on wave images (n = 12), severe respiratory motion (n = 3) along the z-axis, or the presence of iron deposits in the liver as seen on T2*-weighted gradient echo images (n = 12). In the other 334 patients (170 patients with HBV infection and 164 potential living liver donors; mean age, 44.5 years; age range, 16-79 years; mean body mass index [BMI], 22.6 kg/m2; BMI range, 16.2-31.4 kg/m2), as the MR elastograms were adequate, these patients were included for statistical analysis. The baseline characteristics of our study patients are summarized in Table 1.
Relationship between Histopathologic Results and Liver Stiffness Measured by MRE
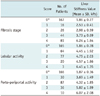
According to the histopathologic evaluation of hepatic fibrosis, 167 (50%) of the 334 patients with technical success were in the F0 stage, 16 patients (5%) were in the F1 stage, 26 patients (8%) were in the F2 stage, 44 patients (13%) were in the F3 stage, and 81 patients (24%) were in the F4 stage. In addition, after excluding the five patients in whom evaluation of liver cell necroinflammatory activity was not possible due to small volume of the biopsy sample, the histologic grading of lobular activity and porto-periportal inflammation was performed in the other 329 patients. The lobular activity (L) was graded as L0 in 165 patients (51%), as L1 in 64 patients (19%), as L2 in 77 patients (23%), as L3 in 20 patients (6%), and as L4 in 3 patients (1%). The porto-periportal activity (P) was graded as P0 in 166 patients (50%), as P1 in 30 patients (9%), as P2 in 87 patients (26%), as P3 in 36 patients (11%), and as P4 in 10 patients (3%).
Relationship between the LS Values of MRE and the Histopathologic Parameters
There was a statistically significant positive correlation between LS values of MRE and the fibrosis stages evaluated by histology (r = 0.901, p < 0.001). In addition, although the degree of the correlation between lobular activity (r = 0.103, p = 0.19 for L) or porto-periportal activity (r = 0.419, p < 0.001 for P) and LS values was not strong, these inflammatory activities contributed marginally to increasing the LS values. The mean LS values of F0, F1, F2, F3, and F4 were as follows: 1.86 ± 0.27 kPa for F0; 2.53 ± 0.41 kPa for F1; 2.98 ± 0.59 kPa for F2; 3.73 ± 0.69 kPa for F3; and 6.24 ± 1.84 kPa for F4 (Table 2).
Diagnostic Accuracy of the LS Measurement in Patients with HBV Infection
"Normal living liver donor" subject data was included in the F0 group for differentiating F0 from HF (≥ F1) using the ROC analysis. ROC curve analysis showed that MRE was able to discriminate patients without fibrosis (F0) from those with mild fibrosis (F1) (AZ, 0.985; sensitivity, 92.2%; specificity, 98.2%) with a shear LS cutoff value of 2.45 kPa. In addition, with a shear LS cutoff value of 2.69 kPa, the Az, predicted sensitivity, and specificity for differentiating significant HF (F2) from mild fibrosis (F1) were 0.988, 95.4%, and 95.6%, respectively. MRE was also able to discriminate patients with severe fibrosis (F3) from those with liver cirrhosis (Az, 0.987; sensitivity, 95.1%; specificity, 94.5%) with a shear LS cutoff value of 3.94 kPa (Table 3).
DISCUSSION
In our study, the LS values measured by MRE showed a good correlation with the HF stages determined by pathological evaluation of the liver tissue. In addition, MRE showed excellent performance in the assessment of the HF stage in patients with HBV infection and in whom the Az were 0.988 for significant fibrosis (≥ F2) and 0.987 for liver cirrhosis (F4). Our study results were in good accordance with results of the previous studies in patients with CHC or nonalcoholic fatty liver disease (29, 30). This high accuracy in the assessment of HF in patients with hepatitis B is also important for assessing the patient prognosis, selecting the antiviral therapy, and predicting the treatment efficacy. Clinically, the detection of significant fibrosis (≥ F2) is important as these patients are at an increased risk of developing cirrhosis along with the accompanying complications (e.g., ascites, encephalopathy, and portal hypertension) (31, 32). Predicting cirrhosis is also an important part of the clinical assessment because surveillance for HCC and gastroesophageal varices should be considered in patients with cirrhosis (33). Therefore, based on our study results, we believe that MRE might not only be useful for early detection of HF but also for evaluating cirrhosis with or without complications in patients with CHB or HBV-induced liver cirrhosis.
In our study, the optimal cutoff values for the diagnosis of significant fibrosis (≥ F2) and liver cirrhosis (≥ F4) were 2.69 kPa and 3.94 kPa, respectively. Our cutoff values for significant fibrosis (≥ F2) and liver cirrhosis (≥ F4) were, therefore, somewhat lower than those in previous studies (16, 30, 31). The lower cutoff values compared to those in previous reports could be due to several factors, including the differences in underlying causes of chronic liver disease and the unequal distribution of fibrosis stage in each study (17, 34). According to several previous studies which investigated the performance of TE in patients with HBV, the cutoff value for hepatitis B was usually lower than that for hepatitis C (17, 19). This could be explained by the fact that the histological features of hepatitis B are different from those of hepatitis C, i.e., as CHB tends to make the liver macronodular and heterogeneous, the total amount of fibrotic material in CHB may be lower than that in CHC (19, 35). Other researchers have suggested that both the different types and the extent of inflammatory infiltrate within the liver may account for the difference in cutoff values between CHB and CHC (36). Furthermore, in our study, the mean stiffness values of the liver, as measured by MRE, increased significantly along with the increase in the fibrosis stage, but, the mean LS values did not increase along with the necroinflammatory activity. This indicates that the mean stiffness values of the liver are usually more affected by the fibrosis stage than by the necroinflammatory activity, which is in agreement with the results of previous studies assessing LS or elasticity using MRE or TE (31, 37).
Our study also demonstrated that in 27 patients (7.5%), the image quality of elastograms was classified as being inadequate. The main causes of technical failure were poor wave propagation and the presence of iron deposits in the liver. Iron overload, which is common in cirrhosis, can cause loss of the liver signal on MRE sequence which is a gradient echo sequence with long echo time, and is susceptible to field inhomogeneity. Therefore, in conditions with severe iron overload in the liver, shear wave propagation could not be measured with the MRE sequence. Our study results are somewhat similar to those of previous MRE studies which reported 94% technical success rates (31). The minor differences in our study results and those of previous studies can be primarily attributed to the high percentage of patients with advanced liver cirrhosis in our study, or to the fact that we applied stringent criteria to a large number of these patients.
Our study has several limitations. First, there is limitation associated with the validation study using liver biopsy as a reference. Although liver biopsy is the current gold standard for assessing HF, it has limitations due to factors such as inter- and intraobserver variability and sampling errors. Furthermore, the information provided by liver biopsy has limitations in reflecting the information obtained by MRE, because the sampling volume in liver biopsy is lesser than that in MRE; and heterogeneous distribution of fibrosis often hampers the correct interpretation of liver biopsy. Second, the degree of necroinflammatory activity in the liver and the liver fibrosis stage were evaluated according to the Standardized Guidelines (25-27) proposed by the Korean Study Group for the Pathology of Digestive Diseases rather than by the METAVIR scoring system. However, these guidelines are similar to the METAVIR scoring system which is widely used for HF staging all over the world with a slight modification for a highly endemic region of chronic HBV infection in Korea (25, 26). Third, we could not compare our study results with those obtained using the aspartate aminotransferase-to-platelet ratio index or ultrasound elastography, both of which are the other noninvasive tools for the staging of HF. However, previous studies have also reported that the diagnostic performance of MRE is better than that of other noninvasive tools (9, 31). Fourth, liver MRE imaging in our study was performed using the same MR scanner. Therefore, it might not be possible to extrapolate our study results to an actual clinical situation in which multiple MR examinations are performed using various MR scanners. Therefore, further studies with a larger number of patients may be required in order to be able to apply LS measurement to CHB in Asian countries using MR scanners obtained from more than one manufacturer.
In conclusion, MRE has a high technical success rate and an excellent diagnostic accuracy with a high sensitivity, specificity, and large areas under the receiver operating characteristic curve for the staging of HF in patients with CHB.


 XML Download