

 PDF
PDF ePub
ePub Citation
 Print
Print


The recent advances in positron emission tomography (PET) with using 2-deoxy-2-fluoro-[F-18]-D-glucose (FDG) have made a significant contribution for differentiating between benign and malignant pulmonary diseases. However, FDG accumulation is not specific for just malignancies because there are many causes of FDG uptake in benign tissue. As the results, increased FDG uptake in such lesions as benign tumors or in inflammatory processes leads to false-positive results and the misdiagnosis of malignancies. High FDG uptake has been observed in many infectious and inflammatory conditions including histoplasmosis, tuberculosis, blastomycosis, cryptogenic organizing pneumonia, sarcoidosis, silicosis and etc (1-7).
Simple pulmonary eosinophilia is also known as Loeffler's syndrome, and it is an acute pulmonary eosinophilia that shows characteristic clinical and radiological changes (8). In most cases, only limited investigations are done because the clinical manifestations are usually minimal. Along with the development of modern diagnostic technology, we frequently encounter the incidental detection of simple pulmonary eosinophilia during the metastasis work-up of cancer patients and also during cancer screening in those healthy subjects who are without a previous history of cancer (9). To the best of our knowledge, there has been no study to describe the PET findings of simple pulmonary eosinophilia. The purpose of this study was to describe the findings of simple pulmonary eosinophilia with using FDG PET.
MATERIALS AND METHODS
Subjects
Between May 2003 and April 2005, 14 consecutive patients (10 men and four women, mean age: 52 years, age range: 35-75 years) who underwent thoracic CT and whole body PET and who were subsequently proven to have simple pulmonary eosinophilia were included in this study. Approval from the institutional review board was not needed for reviewing radiologic and PET images at our institute. The diagnosis of simple pulmonary eosinophilia was made based on the diagnostic criteria defined by Allen et al. (8); a) migratory pulmonary abnormalities on CT, b) increased peripheral blood eosinophils, c) minimal or no pulmonary symptoms, and d) spontaneous resolution within one month.
The PET scans were performed in four patients who were suffering with malignancy to evaluate for metastasis, and PET scans were performed in 10 healthy subjects who underwent voluntary cancer screening. We perform FDG at our institution PET for two different purposes: as an evaluation for metastasis in cancer patients and as a cancer-screening procedure for presumptively healthy subjects who had no previous history of malignancy and they volunteered for this program.
FDG PET Examination and Evaluation
Positron emission tomography scans were obtained on a dedicated whole body PET scanner (ADVANCE, GE Medical Systems, Milwaukee, WI). All the patients had fasted, except for water, for at least 6 hours before the PET studies. The blood glucose levels at the time of injection were less than 6.5 mmol/L for all the patients. Image acquisition for the whole body scanning started about 60 min after the intravenous administration of 370-666 MBq (10-15 mCi) FDG. Five bed positions were examined for 5 min at each step for the whole body emission scans, and the post-injection transmission scans were followed with 3 min/steps. The emission tomographic images were reconstructed using the iterative ordered subsets expectation maximization algorithm. The segmented attenuation correction was performed using the transmission images. Thoracic CT scans were used to localize the abnormality before PET was performed. A qualified nuclear medicine physician (S.K.K. and K.W.K) who were well experienced with CT findings interpreted the PET scans. The maximum standardized uptake value (SUV) that was obtained by selecting a small region of interest (ROI) was used in the analysis. Partial volume correction was not done. The SUVs were calculated based on the following equation: SUV = tissue concentration (MBq/g)/[injected dose (MBq)/body weight(g)] (9).
Thoracic CT Examination and Evaluation
The CT examinations were performed by using a four-channel multi-detector row CT scanner (MX8000; Philips Medical Systems, Cleveland, OH). CT scans were performed for the four patients with malignancy to evaluate for metastasis. Scanning was performed in a caudocrainal direction by using 10-mm nominal collimation (4 × 2.5 mm), with an effective section width of 3.2 mm, a gantry rotation speed of 0.5 seconds, a table speed of 20 mm/sec, a pitch of 1, a tube voltage of 120 kV and a tube current of 200-300 mAs. Each examination was reconstructed with a 3 mm interval. Iopromide, 100 mL (Ultravist 370; Schering, Berlin, Germany) was injected intravenously in all four patients. Low-dose screening CT scans were performed in the 10 healthy subjects who underwent voluntary cancer screening. The scanning was performed with the same protocols as that of conventional CT scans except for low mAs (25-30 mAs). No intravenous contrast material was used in the low-dose screening CT.
All the patients underwent initial CT and FDG PET within a maximum of four days of each other, and they had received no any medical treatment. Follow-up CT to confirm any spontaneous resolution of their pulmonary lesions was performed with intervals ranging from 7 days to 28 days (mean: 15.5 days ± 12.0). Two thoracic radiologists (T.J.K. and H.Y.K.) assessed all the CT images by working in consensus. The number, location, size and characteristics of each lesion were recorded. The pulmonary nodules were categorized into three groups according to the nodule characteristics: solid nodule, semisolid nodule and pure ground-glass opacity nodule.
Statistical Analysis
The SPSS software package version 10.0 (SPSS, Chicago, IL) was used for the statistical data analysis. The number of nodules and the maximum SUV in each patient were correlated with the total eosinophil counts by means of Spearman's rank correlation coefficient. The differences in the nodule size and the maximum SUV among the three groups, according to the nodule characteristics, were evaluated by the Kruskal-Wallis test. For all tests, a p value less than 0.05 was used to indicate significance.
RESULTS
The PET scans were performed in four patients who had different malignancies to evaluate for metastasis; rectal cancer (n = 1), esophageal cancer (n = 2) and synovial sarcoma (n = 1). All four patients receive no medical treatment while the CT or PET scans were performed. The ten healthy subjects who underwent voluntary cancer screening had no current associated diseases. All the subjects had no specific respiratory symptoms.
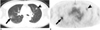
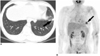
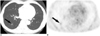
A total of 42 nodules were detected on the CT scans. There were single nodules in three patients and multiple nodules in 11 patients (mean number of nodules: 3.1, range of the number of nodules: 1-7). The nodules were categorized into three groups according to the nodule characteristics seen on CT; solid nodule (n = 6) (Fig. 1), semisolid nodule (n = 11) (Figs. 1, 2, 3) or pure ground-glass opacity nodule (n = 25). The means of the longest nodule diameter of each group were 10.7 mm ± 3.8 (standard deviation: SD) (range: 5-15 mm), 8.6 mm ± 4.4 (SD) (range: 3-20 mm) and 10.8 mm ± 5.8 (SD) (range: 3-20 mm), respectively. There was no significant difference in nodule size among each group (p = 0.357; Kruskal-Wallis test). On the follow-up CT scans, all the nodules showed complete resolution and new nodules were found in four patients.
Twelve of 42 (28.6%) nodules showed FDG uptake on the PET scans, and the mean maximum SUV was 2.5 ± 1.6 (SD) (range: 0.6-5.3). Five of the six (83.3%) solid nodules showed FDG uptake (2.2 ± 1.1, range: 0.9-3.6) (Fig. 1), six of the 11 semisolid nodules (54.5%) showed FDG uptake (3.1 ± 1.8, range: 0.6-5.3) (Figs. 1-3) and one of the 25 (4%) pure ground-glass opacity nodules showed a maximum SUV of 0.8. The maximum SUVs of seven nodules in five patients were greater than 2.5. The means of the maximum SUVs of each group were 1.9 ± 1.4, 1.7 ± 2.1 and 0.03 ± 0.1, respectively. When the maximum SUVs were compared among the three groups, there was a significant difference between the nodule types and maximum SUVs (p < 0.001; Kruskal-Wallis test).
The means of the percentages and the absolute values of the eosinophils of the patients were 12.1% (range: 6.6-22) and 884 cells/mm3 (range: 576-1,469), respectively. The maximum SUVs and the number of nodules had no significant positive correlation with the corresponding eosinophil counts (r = 0.206, p = 0.480; r = 0.226, p = 0.437, respectively).
DISCUSSION
Simple pulmonary eosinophilia is an acute pulmonary eosinophilia that shows characteristic clinical and radiologic changes (8). The patients typically have few or no symptoms, and the diagnosis is often initially suspected by the characteristic findings on the chest radiographs or the CT scans. The CT appearance of simple pulmonary eosinophilia consists of patchy unilateral or bilateral airspace consolidation with a predominantly peripheral distribution, areas of ground-glass opacity predominantly in the middle and upper lung zones and there can be multiple nodules (9, 11).
Numerous reports have demonstrated increased FDG uptake at the site of infection and inflammation. FDG is incorporated into acute inflammatory lesions that have both acute (polymorphoneuclear) and chronic cells such as macrophages or lymphocytes (12). The granulomatous diseases of chronic infections usually demonstrate significant levels of FDG uptake, and these levels can overlap with the levels noted for malignant diseases (2, 3). This overlap in the uptake levels can pose a difficulty to distinguish such low-grade lung malignancies as bronchioloalveolar carcinoma from the granulomatous infections. Several acute inflammatory or infectious conditions such as pneumonia or other bacterial infections have also been associated with a relatively mild degree of FDG uptake (13). However, to the best of our knowledge, the FDG uptake in simple pulmonary eosinophilia has not previously been described. The results of our study indicate that the FDG uptake in patients is quite different from each other according to their nodule types. A solid nodule with or without a ground-glass opacity halo showed a higher frequency and level of FDG uptake compared to the pure ground-glass opacity nodule. There was no significant difference in nodule size among each nodule group. These results indicate that the SUV is closely related with the density of the inflammatory cells that make up the nodules. However, it is interesting to note that the eosinophil count in the peripheral blood itself did not show positive correlation with the maximum SUVs or the number of nodules.
Patients with simple pulmonary eosinophilia do not need any treatment because this condition resolves spontaneously within one month. In most cases, only limited investigations are done because the clinical manifestations are minimal. With the development of such modern diagnostic technology as CT, we frequently encounter the incidental detection of simple pulmonary eosinophilia during the metastasis work-ups of cancer patients and during cancer screenings for healthy subjects. The clinical significance of the detection of simple pulmonary eosinophilia lies in the distinction from such malignancies as bronchioloalveolar carcinoma or well-differentiated adenocarcinoma and metastasis.
Bronchioloalveolar carcinoma and well-differentiated adenocarcinoma commonly appear as a solitary pulmonary nodule that is associated with ground-glass opacity. The area of ground-glass opacity reflects the histopathologically, that is, a unique lepidic growth pattern in which the tumor spreads into the distal air spaces by using the alveolar septa as a stroma (14). Pulmonary nodules with ground-glass opacity halos can also be frequently seen in patients with simple pulmonary eosinophilia; a halo of ground glass opacity results from pulmonary infiltrations of eosinophils and other inflammatory cells (8, 9, 11, 20). These two different conditions can show similar findings on both CT and FDG PET.
Nomori et al. showed that FDG PET had false positive or false negative findings more frequently for the ground-glass opacity nodules than for the solid ones (15). In their study, nine of 10 well-defined adenocarcinomas with ground-glass opacity halos were negative on FDG PET. However, four of five active inflammatory nodules with ground-glass opacity halos were positive on FDG PET. These false negative and positive results are due to the low glucose metabolism of well-differentiated adenocarcinoma and the high glucose metabolism of nodules with active inflammation, respectively (16-18). These results suggest that the FDG PET results should be interpreted in combination with the CT findings when differentiating benign from malignant pulmonary nodules with ground-glass opacity.
Multiple nodules, which are common in simple pulmonary eosinophilia, also lead to a diagnostic dilemma when differentiating them from metastasis. In our study, all four patients with malignancy had multiple pulmonary nodules that mimicked metastasis. The two nodules in a patient with rectal cancer showed high SUVs of 5.3 and 3.0, respectively, and this strongly suggests the possibility of metastasis (Fig. 1). Our results suggest that positive FDG PET results should be interpreted with caution when differentiating benign from malignant nodules, and especially in those patients with an underlying malignancy. CT findings such as ground-glass opacity halo around the nodule or peripheral eosinophilia may be helpful in differentiating metastasis from simple pulmonary eosinophilia.
It is well known that inflammatory cells have a high glucose metabolism when they are activated via infection or inflammation (19). Pathologically, eosinophils and histiocytes accumulate in the alveolar spaces and walls in simple pulmonary eosinophilia (20). It may be considered that the eosinophils and histiocytes in inflammatory tissue use glucose as an energy source for chemotaxis and phagocytosis.
Our study had several limitations. First, we included only a small number of patients. Second, because our study is a retrospective study, we could not suggest the incidence of FDG uptake of simple pulmonary eosinophilia in both cancer patients and healthy subjects. Another limitation is the lack of any pathologic correlation in our patients. However, because of its benign and transient nature, the diagnosis of simple pulmonary eosinophilia in daily clinical practice is exclusively based on the clinical course and imaging studies.
In conclusion, simple pulmonary eosinophilia commonly causes an increase in FDG uptake. Therefore, correlation of the PET findings with the CT findings or with the peripheral eosinophil counts may help physicians to arrive at the correct diagnosis of simple pulmonary eosinophilia.
 XML Download