

 PDF
PDF ePub
ePub Citation
 Print
Print


INTRODUCTION
Sinonasal sarcomas are rare malignant tumors that constitute less than 1% of head and neck malignancies (12) and 7% of all head and neck sarcomas (3). While a number of histological subtypes may occur in the sinonasal region, osteosarcoma and rhabdomyosarcoma are the most frequent types in adults and children, respectively (4). Although they include various histological subtypes, the clinical presentation, diagnostic evaluation, and management are generally similar: the primary treatment is surgery, followed by adjuvant radiotherapy and chemotherapy. Outcomes are generally poor in this group, with advanced T-stage and low rates of local control (3), but slightly better than those in the squamous cell carcinoma (SCC) group (5). Among head and neck sarcomas, those arising from the sinonasal tract are affected by the worst prognosis, probably due to delayed diagnosis and proximity to the skull base and orbit (6).
Only a few case reports and small cases series, using various imaging modalities, including computed tomography (CT), magnetic resonance imaging (MRI), and 18F-fluorodeoxyglucose (FDG) positron emission tomography (PET), have described the imaging features of sinonasal sarcoma. However, to the best of our knowledge, comprehensive analysis of the imaging features of sinonasal sarcoma with the use of multiple imaging modalities has not been described in the literature.
Therefore, the purpose of our study was to evaluate CT, MRI, and FDG PET/CT findings of sinonasal sarcoma, and to identify the features that differentiate sarcoma from SCC.
MATERIALS AND METHODS
Study Population
The Institutional Review Board approved the protocol for this study, and the requirement for obtaining informed consent was waived because routine diagnostic data were analyzed retrospectively.
By performing a medical record search in a single institution, we identified 7 patients (all men; mean age, 37.6 ± 13.9 years; age range, 18–58 years) with surgically confirmed sinonasal sarcoma who underwent CT, MRI, and FDG PET/CT between January 2003 and August 2014. For the purpose of comparison, we identified 13 patients (12 men, 1 woman; mean age, 61.8 ± 9.9 years; age range, 46–79 years) with surgically confirmed sinonasal SCC who also underwent CT, MRI, and FDG PET/CT during the same period. All imaging studies were performed in individual patients within 4 weeks.
The classification of the tumor stage was based on the American Joint Cancer Committee/Union Internationale Contre le Cancer staging 7th edition (7).
Imaging Techniques
There was a slight variation in the imaging technique because several patients were referred to our tertiary cancer center from other hospitals after imaging was already performed using a variety of equipment and different protocols. Four CT, 3 MRI, and 2 PET/CT images from referring hospitals were accepted, provided that they were obtained within the appropriate time interval and were judged to be of sufficient quality by a head and neck radiologist or a nuclear medicine physician. At our institution, the imaging protocol for a head and neck mass is as follows.
CT
CT scans were conducted with a 16-MDCT scanner (MX8000 IDT; Philips Medical Systems, Best, the Netherlands) (n = 9) or a 256-MDCT scanner (Brilliance iCT; Philips Medical Systems, Cleveland, OH, USA) (n = 7). The technical parameters were as follows: pitch, 0.61–1.5; gantry rotation time, 50–270 ms; collimation, 4 × 1.5–6.4 × 0.625 mm; 120 kV; 132–200 mAs; and matrix, 512 × 512. Image acquisition was started 60 seconds after intravenous injection of 100-mL of non-ionic contrast materials (Omnipaque 300; GE Healthcare, Princeton, NJ, USA). The longitudinal field of view was typically from the level of the maxillary sinus to the tracheal bifurcation (mean coverage, 250 mm). Axial, coronal, and sagittal images were reconstructed.
MRI
MRI scans were conducted with a 1.5-T MRI system (Gyroscan Intera; Philips Medical Systems, Best, the Netherlands) (n = 12) or a 3-T MRI system (Intera Achieva; Philips Medical Systems, Best, the Netherlands) (n = 5) using a head and neck coil. The technical parameters were as follows: slice thickness, 3.5–6.0 mm; interslice gap, 1.0–1.8 mm; flip angle, 90°; matrix, 256 × 256–512 × 512; number of excitations, 2; repetition time (TR)/echo time (TE) for T1-weighted images, 500–600 ms/10 ms; and TR/TE for T2-weighted images, 4000–6000 ms/80–100 ms. The longitudinal field of view was typically from the mastoid processes to the clavicle. All patients underwent axial, sagittal, and coronal T1-weighted images and axial and coronal T2-weighted images. In addition, axial and coronal T1-weighted fat-saturated images were obtained after the intravenous injection of 0.1 mmol/kg of gadodiamide (Omniscan; GE Healthcare, Princeton, NJ, USA).
PET/CT
PET/CT scans were conducted using the Discovery STE Whole Body PET/CT System (Discovery STE; GE Healthcare, Milwaukee, WI, USA) (n = 18). PET images were obtained using 370–555 MBq (10–15 mCi) 18F-FDG, applying three-dimensional mode with 2.5 min acquisition per bed position and 5.1 mm full-width at half maximum. CT images were obtained after injection of 2 mL/kg of non-ionic contrast material (Omnipaque 300; GE Healthcare, Princeton, NJ, USA) with the following parameters: pitch, 1.7; detector configuration, 8 × 1.25 mm; slice thickness, 3.75 mm; image interval, 3.27 mm; 120 kVp; and 50 mAs. The longitudinal field of view was typically from the base of the skull to the upper thigh. Fusion images of the PET and CT were obtained using in-built software in the axial and coronal planes, with slice thickness of 6.5–7.8 mm.
Image Analysis
All image interpretations were performed by reviewers who were unaware of the results of the other imaging examinations and the final diagnosis.
The CT and MRI images were evaluated by a board-certified radiologist (D.Y.Y.) with more than 15 years of experience in head and neck imaging. The CT and MR features were reviewed with respect to the following characteristics: the location, shape (oval/lobular, or irregular), maximum dimension (< 5 cm or ≥ 5 cm), margin (well-defined or ill-defined), signal intensity on T1-weighted MRI (low or iso with respect to the adjacent muscles) and T2-weighted MRI (iso or high with respect to the adjacent muscles), pattern of contrast enhancement on MRI (homogeneous or heterogeneous/large necrotic), and local tumor invasion. A well-defined margin was defined as a smooth or lobulating margin without spiculation or infiltration into > 75% of the tumor perimeter. Homogeneous enhancement was defined as an even signal intensity in > 90% of the tumor on the contrast-enhanced image. Local tumor invasion was defined as direct infiltration of the tumor into adjacent tissue with loss of bone or fat plane. Lymph node metastasis was defined by the size on CT and MRI; nodes were considered metastatic if their maximum transverse diameter was greater than 15 mm for levels I–II or 10 mm for levels III–VI (8). In addition, a necrotic node irrespective of the nodal size was also classified as metastatic.
PET/CT scans were reviewed by a board-certified nuclear medicine physician (S.B.) with more than 5 years of experience in PET/CT imaging. FDG uptake was considered abnormal when uptake in the primary tumor was greater than the background activity. For the semi-quantitative analysis of FDG uptake, the maximum standardized uptake value (SUVmax) was calculated by generating a manual region of interest over the most FDG avid portion of the lesion. Associated findings, such as cervical lymph node metastasis and distant metastasis were also documented.
Statistical Analysis
Patient demographics (age and sex) and imaging (CT, MRI, PET/CT) features of sarcoma were compared with those of SCC. Statistical analysis was performed with Student's t-test for continuous variables and the Fisher's exact test for categorical variables. p-values < 0.05 were considered to indicate statistically significant differences. All statistical analyses were performed with commercially available software (SPSS 19.0 for Windows; SPSS Inc., Chicago, IL, USA).
RESULTS
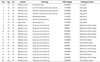
Clinical findings (age, sex, and pathologic tumor-node-metastasis stage) in patients with sarcoma and SCC are summarized in Table 1.
The mean age of patients in the sarcoma group (37.6 ± 13.9 years) was significantly lower than that of patients with SCCs (61.8 ± 9.9 years) (p < 0.0005). No significant difference in the female-to-male ratio was observed between the two groups. Among seven sinonasal sarcomas, five tumors were located in the maxillary sinus. Histopathological diagnoses were undifferentiated pleomorphic sarcoma (n = 3), chondrosarcoma (n = 2), rhabdomyosarcoma (n = 1), and chondroid osteosarcoma (n = 1).
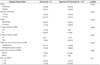
The CT, MR, and PET/CT imaging features of cases of sarcoma and SCC included in this study are summarized in Table 2.
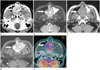
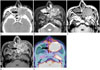
The most common CT and MRI features of sarcomas were an irregular shape (4/7, 57.1%), > 5 cm in the maximum dimension (4/7, 57.1%), a well-defined margin (6/7, 85.7%), iso-signal intensity on T1-weighted MRI (6/7, 85.7%), high signal intensity on T2-weighted MRI (7/7, 100%), homogeneous enhancement (4/7, 57.1%), and local tumor invasion (7/7, 100%). There were no significant differences in all CT and MRI characteristics between the sarcoma and SCC groups.
On FDG PET/CT, all of the tumors demonstrated FDG uptake. The SUVmax of the sarcoma group ranged from 5.1 to 11.5 with a mean value of 7.4 ± 2.1, which was significantly lower than the SUVmax of the SCC group (range, 7.1–20.6; mean, 14.3 ± 4.5) (p = 0.0013).
In a patient with rhabdomyosarcoma, metastatic tumors were found in the ipsilateral cervical lymph nodes and bone at the time of diagnosis. A patient with SCC had ipsilateral cervical lymph node metastasis. All these cases with local invasion or lymph node metastasis were confirmed by surgical and pathologic examinations.
DISCUSSION
Sinonasal sarcomas are frequently misdiagnosed as carcinomas because the clinical symptoms are not quite different. Malignant head and neck tumors may have various imaging features according to their different histopathologic types (9). Therefore, it is useful to assess the imaging features of this rare tumor that can help distinguish it from other common malignant tumors in the sinonasal region. SCC is the most common histological type of malignancy in the sinonasal region, accounting for 60% to 75% of all cases (1011). Therefore, this study aimed at identifying the imaging features of sinonasal sarcoma using CT, MRI, and PET/CT based on our single-center experience.
The demographics of our patients with sinonasal sarcoma and SCC, including age and sex, were similar to those reported in previous studies (412). A large cohort study (12) reported that sinonasal SCC was twice as common in men than in women, and approximately 80% of the tumors occur in patients over the age of 55 years. In our series, the mean age of patients with sarcomas was significantly less than that of patients with SCCs. When the age of 50 years was used as the cut-off value, the sensitivity and specificity for differentiating sarcoma from SCC were 71.4% and 84.6%, respectively. No significant difference in gender of patients was observed between the two groups because of extreme male predominance in both sarcoma and SCC.
Imaging studies are useful in the diagnosis and staging of sinonasal tumors. Anatomic imaging modalities, such as CT and MRI, remain the mainstay of both preoperative imaging and postoperative follow-up evaluation. MRI is the dominant imaging modality in the evaluation of sinonasal tumors because of its superior soft tissue contrast resolution. CT is less accurate than MRI in the evaluation of small tumors, but it is superior in the detection of small calcifications within a mass and the evaluation of subtle bony structure involvement. PET has recently been introduced in the diagnosis, staging, and assessment of response to therapy in various kinds of tumors that show increased glucose utilization compared with normal tissues (13). PET/CT is considered as a potentially major advance in clinical practice and is widely used for the evaluation of head and neck malignancies.
Our findings demonstrate that sinonasal sarcomas have variable CT and MRI appearances. These results are in concordance with earlier observations in studies of soft tissue sarcomas in the sinonasal region. Only a few previous studies (141516) have investigated the CT and MRI findings of sinonasal sarcomas and they have reported non-specific imaging features. Rhabdomyosarcomas usually presented as a homogeneous mass with intermediate signal intensity on all MRI sequences and moderate to marked contrast enhancement (14). Chondrosarcomas revealed low signal intensity on T1-weighted MRI and high signal intensity on T2-weighted MRI with homogeneous or heterogeneous contrast enhancement. Well-differentiated tumors may exhibit stippled chondroid calcification on CT images (15). Sinonasal malignant fibrous histiocytomas revealed iso- or mixed density on CT, iso- or mixed intensity on T1-weighted MRI, mixed intensity on T2-weighted MRI, and heterogeneous enhancement (16). Various types of contrast enhancement may be explained by the different histological subtypes and different grades of tumors. In our study, sarcoma and SCC showed nearly identical MRI features with iso-signal intensity on T1-weighted images and high signal intensity on T2-weighted images. Therefore, there was a significant overlap in the CT and MRI appearances of sarcomas and SCCs in our series.
In general, sarcomas tend to be FDG avid, although there is significant variability. Previous studies (17181920) have reported that there is a relationship between the SUV level and the histological grade of soft tissue sarcomas. High-grade sarcomas tend to accumulate FDG at a higher rate than low-grade tumors because of the greater energy needs of tumors and upregulation of glucose transporters.
In our study, all 7 patients showed FDG uptake in the sinonasal sarcoma group with a SUVmax of 5.1 or greater. Our mean SUVmax value of 7.4 was lower than the values reported in the literature (1718). On comparison between sarcomas and SCCs, the SUVmax value was the only parameter that was significantly different between the two malignant tumors. With the use of a cut-off value, a SUVmax value < 10.0 had a sensitivity and specificity of 85.7% and 76.9%, respectively, for sinonasal sarcoma.
This study has several limitations. First, an important limitation was the small sample size, given the rarity of this tumor. We could not evaluate the correlation between imaging findings obtained using three different diagnostic modalities due to low statistical power. Furthermore, because our sample consisted of various histological subtypes of sarcomas, the results cannot be generally applied to sinonasal sarcoma. Second, all patients included in this study were recruited from a head and neck cancer center at a single tertiary hospital. All sarcomas and SCCs in our series showed local tumor invasion at the time of diagnosis. These findings suggest that our patients seemed to have more aggressive tumors compared to those that have been reported by other researchers.
In conclusion, CT and MRI parameters were not useful in differentiating between sinonasal sarcomas and SCCs. Only the SUVmax value < 10.0 was a significant imaging feature of sarcoma for differentiation from SCC.
 XML Download