

 PDF
PDF ePub
ePub Citation
 Print
Print


INTRODUCTION
Coronary heart disease (CHD) is a leading cause of death. Monitoring of coronary atherosclerotic plaque and the effective method for early detection of subclinical CHD have been emphasized (1, 2). Serial assessment of coronary atherosclerotic plaque has contributed to the understanding of the natural history and pathophysiology of CHD (3). Traditionally a coronary angiography has been considered the gold standard method when measuring the extent of atherosclerotic plaque (4). However, this method only depicts the luminal image and is limited in determining plaque composition and explaining the broad spectrum of compensatory coronary arterial remodeling.
Intravascular ultrasound (IVUS) is invasive and therefore not suitable for monitoring progression/regression of coronary plaque (5, 6). On the contrary, coronary CT angiography (CTA) is a non-invasive technique which enables the detection of non-calcified plaque when compared to a non-contrast CT, which detects only calcification (7-9). Thus, the non-invasive repeated CTA could play a role in assessing the changes in coronary atherosclerotic plaque. Defining the relationship between cardiovascular risk factors and changes in plaque burden by a serial CTA would facilitate risk modification in patients with coronary plaque detected by multidetector computed tomography (MDCT). The purpose of this study was to assess the serial changes in coronary plaque volume and stenosis severity during follow-up, and its association with cardiovascular risk factors.
MATERIALS AND METHODS
Patients
We conducted a retrospective review of the contrast-enhanced coronary CTA patient dataset between April 2007 and March 2011, and identified 168 patients who underwent more than one MDCT examination. Patients had been examined by MDCT due to either a suspected coronary artery disease or a general health examination. With the exception of patients who underwent percutaneous coronary angioplasty (n = 11) and coronary artery bypass graft (n = 5), the MDCT data of the remaining 152 patients were reviewed. The presence of plaque in either of the initial or follow-up CT scans were criteria for inclusion into this study. A total of 56 patients were enrolled in the study. These patients were invited for a follow-up MDCT for clinical indication, which consisted of non angina (10.7%), atypical (25.0%), typical (1.7%) chest pain, or a periodic health examination (62.5%). There was no major cardiovascular event during the follow-up period. This study was approved by the institutional review board of our institute, which waived the need for informed consent due to its retrospective nature.
Clinical Covariates
The pretest probability of CHD in patients based on presenting age, sex, and symptoms was estimated (10). Cardiovascular risk factors for all study participants were obtained through review of medical charts at the time of baseline and follow-up MDCT examinations. Body mass index (BMI) was calculated from measured weight and height, and obesity was defined as BMI > 25 kg/m2. Hypertension was defined by a systolic blood pressure of ≥ 140 mm Hg, diastolic pressure of ≥ 90 mm Hg, or current antihypertensive treatment. Smoking was defined by current or previous daily cigarette use. Diabetes mellitus was defined as a confirmed diagnosis, or by the use of any anti-diabetic medication at entry into the study. Hypercholesterolemia was defined by a total cholesterol ≥ 200 mg/dL or treatment with a lipid-lowering medication- which were defined as on-going statin treatment at entry into the study. A family history of CHD was defined as previous symptomatic CHD treated with medication, or coronary revascularization therapy in a first-degree relative (< 55 years of age for males and < 65 years of age for females). Finally, the 10-year CHD risk based on the Framingham risk score and the modified National Cholesterol Education Program (NCEP) risk category were calculated for each patient (11, 12).
Cardiac MDCT Acquisition
Baseline and follow-up MDCT data were acquired using the Brilliance 64 (Philips Medical Systems, Best, The Netherlands). Non-enhanced imaging was performed to calculate calcium score and volume using 120 kV and 55 mAs with prospective gating. Contrast medium (Iomeron 400, Bracco SPA, Milan, Italy) was injected intravenously at a rate of 4.5 mL/sec for all CTA examinations, followed by a 40 mL saline flush at 4 mL/sec. Scanning was automatically initiated 6 seconds after a threshold of 150 Hounsfield units (HU) was achieved in the region of interest in the descending aorta. CTA was performed with a detector collimation of 64 × 0.625 mm, a 0.4 sec gantry rotation, a pitch of 0.2, an effective tube current of 600-900 mAs with electrocardiography (ECG) modulation, and a tube voltage of 120 kV. Patients received an oral beta-blocker (50-100 mg metoprolol) 1 hour before the examination if they had a rapid heart beat (≥ 70 bpm), assuming no contraindications. Additionally, sublingual nitroglycerin (Nitroglycerin Sublingual Tab. 0.6 mg, Hana, Seoul, Korea) was administered 1 min before image acquisition to dilate the coronary arteries. Reconstructions were performed routinely at the 75% phase of the R-R interval period. Additional cardiac cycles were explored if an adequate image for analysis could not be reconstructed.
Cardiac MDCT Analysis
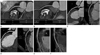
MDCT data were transferred to a workstation (Extended Brilliance workspace; Philips Medical Systems, Best, The Netherlands) for post-processing. Oblique multi-planar reformations (MPRs), maximum intensity projection, curved MPRs along the axis of each vessel, two-dimensional map images, and the volume-rendered technique were reconstructed. To calculate the Agatston calcium scores and calcified plaque volume, a semi-automated software identified and defined at least three contiguous pixels (area, 1.03 mm2) with a density of > 130 HU as calcified plaque. Datasets were transferred to an image processing work station (Aquarius, TeraRecon, San Mateo, CA, USA) to evaluate the non-calcified plaque volume on both the baseline and follow-up CTA. After the lesion was identified by two observers by consensus, the analysis was performed by an experienced observer blinded to the patient name and study date (Fig. 1). After automatic contour detection of coronary vessels of ≥ 2 mm in diameter, manual correction was done to trace the leading edges of the luminal and outer border.
In the first step, stenosis diameter was measured using the ratio of the average diameter between the site of maximal luminal narrowing and reference sites. The reference sites were defined as segments without detectable plaque, proximal and distal to, and as close as possible to the respective coronary lesion. In cases in which it was difficult to set both proximal and distal references, the best side of the segment was used as the reference site. In the second step, lesion length was measured from the proximal to the distal shoulder of the plaque. Lastly, the plaque was characterized by color coding based on CT value (HU). Referring to published studies (13-15), the software color codes of the non-calcified coronary plaque were classified into low attenuation plaque (0-50 HU), lipid-rich plaque, intermediate attenuation plaque (51-120 HU), fibrous plaque; and the volume of each component was measured.
The color coding area was manually adjusted to include the full thickness of the vessel wall and to exclude surrounding tissue, such as myocardium, atrium, and the coronary veins. To match the lesions at baseline and follow-up, two curved MPR images of the baseline and follow-up CT were displayed at parallel using workstation, and then were compared side by side to confirm the identical segment based on the adjacent anatomical landmark. The contrast-enhanced coronary artery lumen CT values of the lesion segments at baseline and follow-up CTA were recorded. Non-evaluable segments due to motion artifacts were excluded from analysis. A re-analysis was performed three months after the original analysis to assess the intra-observer agreement.
Statistical Analysis
Microsoft Excel 2007 (Microsoft Corp., Redmond, WA, USA) software package was used for data collection. Continuous measures were presented as means ± standard deviation or medians with 95% confidence interval (CI). A comparison between baseline and follow-up was performed using the paired t-test for continuous variables and the chi-square test for categorical data. Non-normally distributed continuous variables were compared by the Wilcoxon signed-rank test or Mann-Whitney test. Intra-observer agreement for each measurement was estimated using the intra-class correlation coefficient (ICC). The absolute annual changes in stenosis diameter, lesion length, and plaque volume were assessed by subtracting the values measured at the baseline CT from those measured at the follow-up CT for each plaque, and dividing the difference by the elapsed time between the two measurements. Relative (percentage) annual change was obtained by dividing the absolute annual change by the amount at the baseline scan. At that time, the cases without detectable plaque on both baseline and follow-up CT were considered no change (0%), whereas cases without visible plaque on only baseline CT were excluded from the annual relative change data. Logistic regression analysis was used to determine whether baseline clinical and laboratory variables were predictive of rapid plaque progression. Variables that achieved significance in a univariate analysis were then selected for testing in a stepwise multiple logistic regression analysis. For dichotomous dependent variables, median annual change values for each plaque volume were selected as a cut-off for rapid plaque progression. MedCalc (version 12.2.1; MedCalc Software, Mariakerke, Belgium) was used for all statistical analyses. A p value < 0.05 was considered to indicate statistical significance.
RESULTS
Clinical Characteristics and Change in Cardiovascular Risk Profile over Time
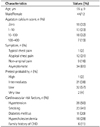
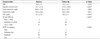
Of the 56 patients included, 44 were male and 12 were female. The mean age was 55 ± 9 years. Clinical characteristics of the 56 patients at baseline are summarized in Table 1. A follow-up CT with a cardiovascular risk profile reacquisition was undertaken a mean of 25 ± 10 months (range, 8-45 months) after the baseline examination. During the follow-up period, only 12 patients were treated with a statin drug. The remaining patients were managed by usual cardiovascular risk factor control, including maintenance of desirable body weight, eating a healthy diet, exercising regularly and not smoking. The changes in cardiovascular risk profiles between baseline and follow-up are listed in Table 2. The Agatston calcium score increased significantly at follow-up. High density lipoprotein (HDL) and low density lipoprotein (LDL) levels decreased significantly at follow-up. Additionally, the Framingham 10 year CHD risk and the NCEP risk categories were significantly upgraded at the follow-up. No significant differences were observed for BMI or total cholesterol and triglyceride levels.
Changes in Coronary Artery Lesions over Time
Heart rates during the scan were 62 ± 9 beats/min and 58 ± 8 beats/min in baseline and follow-up. Radiation dose for a single MDCT examination was -12 mSv. Coronary artery lesions were detected in 54 patients on baseline CT. Lesions progressed in two of these patients on follow-up CT. One patient had a coronary artery lesion on only baseline CT. A total of 111 segments with coronary plaques detected on baseline or follow-up CT were included in this analysis, excluding 9 segments (7.5%) with any artifact that might impair plaque assessment. While only one segment was detected on baseline CT, coronary artery lesions were detected in 109 segments, and then developed into two segments on follow-up CT.
The 111 segments consisted of a proximal left anterior descending (LAD, n = 34), mid-LAD (n = 19), proximal right coronary artery (RCA, n = 16), left main (n = 12) and mid-RCA (n = 11), proximal left circumflex (LCX, n = 11), distal LAD (n = 2), distal RCA (n = 2), obtuse marginal branch (n = 2), first diagonal branch (n = 1), and the distal LCX (n = 1). Stenosis severity in all segments evaluated was < 50% on baseline CTA, however 20 segments in 15 patients showed significant stenosis on the follow-up CTA. Eight of the 15 patients underwent invasive coronary angiography, and five underwent revascularization therapy with a coronary stent.
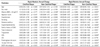
Stenosis diameter, lesion length, and calcified and non-calcified plaque volumes of the coronary lesions increased significantly during the follow-up period (Table 3). Absolute and relative annual changes in diameter stenosis, lesion length, and calcified and non-calcified plaque volumes were 3.3% (95% CI, 2.7-5.3%) and 13.2% (95% CI, 9.7-21.6%), 0.9 mm (95% CI, 0.7-1.3 mm) and 6.0% (95% CI, 4.4-9.0%), 0.7 mm3 (95% CI, 0-2.8 mm3) and 0.0% (95% CI, 0.0-13.0%), and 22.7 mm3 (95% CI, 16.7-32.7 mm3) and 90.4% (95% CI, 34.1-233.0%), respectively. The relative annual change in plaque volume was significantly greater (90.4% vs. 0.0%, p < 0.001) in non-calcified plaque than that in calcified plaque. However, no difference in the relative annual change between lipid-rich and fibrous plaque volumes was observed (120.0% vs. 79.7%, p = 0.487). Twenty one (34%) of 76 segments in 13 patients with non-calcified plaque developed calcification on follow-up CT. Those were excluded from relative annual change analysis, because of zero denominator.
ICC for stenosis diameter, lesion length, and non-calcified plaque volumes between measurements by the same observer were 0.798, 0.837, and 0.875 at the baseline CTA, respectively, and 0.779, 0.839, and 0.846 for the follow-up CTA, respectively. CT values of the coronary artery lumen in the same lesion segments between the baseline and follow-up CT were not significantly different (p = 0.812) on a paired t-test, and almost perfectly concordant (ICC = 0.846) in the intra-class correlation analysis.
Association between Plaque Volume Changes and Cardiovascular Risk Factors
The univariate logistic regression analysis of annual plaque change versus cardiovascular risk factors is presented in Table 4. The absolute annual change in non-calcified plaque was significantly associated with obesity, smoking, hypercholesterolemia, triglycerides, HDL, Framingham risk score, and 10-year CHD risk. The relative annual change in non-calcified plaque was significantly associated with obesity, hypertension, smoking, hypercholesterolemia, family history of CHD, HDL, Framingham risk score, 10-year CHD risk, and NCEP risk category. In contrast, absolute and relative annual changes in calcified plaque were not associated with any cardiovascular risk factors.
The cardiovascular risk factors found to be significant in the univariate analysis were included in a multiple logistic regression model (Table 5). The absolute annual change in non-calcified plaque was independently related to obesity, smoking, and HDL. The relative annual change in non-calcified plaque was independently related to obesity, hypertension, smoking, hypercholesterolemia, and HDL.
DISCUSSION
The major findings of the present study were as follows: First, the coronary atherosclerotic plaques showed progression in plaque volume, luminal stenosis, and lesions length over time. Second, differences were observed in the rate of plaque progression according to plaque composition. The progression of plaque volume was significantly greater in non-calcified plaque compared with that of calcified plaque. Third, the progression of non-calcified plaque was significantly associated with cardiovascular risk factors.
The main challenge for plaque volume measurements is the exact separation between the lumen, plaque, and vessel wall. In particular, delineation of the outer vessel boundary remains problematic, leading to high inter-observer and inter-scan variability (9, 16). However, the reproducibility of plaque volume measurements in recent studies has improved with the introduction of automatic software to quantify plaque. Blackmon et al. (17) reported Pearson's correlation coefficients of 0.781-0.920 according to observer experience. Lee et al. (18) reported that the concordance correlation coefficients for both the intra-observer and inter-observer agreement were 0.90. In the present study, the ICCs for intra-observer agreement were almost perfect (ICC, 0.846-0.875). Another major limitation of plaque quantification is that no standard values of attenuation-based color coding are available for plaque characterization. It is difficult to further classify the non-calcified plaque because of the overlap in CT values of different non-calcified plaque composition (6-8). Moreover, results from a phantom study indicated that intraluminal coronary arterial enhancement has a significant impact on accurate CT densitometry of coronary plaque (19, 20). To overcome this limitation, we compared the intravascular attenuation values of the lesion segments between baseline and follow-up CTA. These results were not significantly different (p = 0.812) on a paired t-test. In addition, non-enhanced images had been used for calcified plaque volume measurement, so we excluded the possible obscuring of the calcium affected by contrast agents.
Several researchers have reported that the rate of serial progression of plaque volume varies. In the present study, the absolute (median, 0.7 mm2) and relative (median, 0.0%) annual changes in calcified plaque were much lower compared with those of previous results (21, 22). Callister et al. (21) reported a 44% median relative annual change in the volumetric score in asymptomatic high-risk individuals. Schmermund et al. (22) reported 32% and 27% of the median relative annual progression of calcium score and area in symptomatic patients, respectively. However, the progression rate depended on the baseline plaque burden. In the present study, which included mainly low-to-intermediate risk patients, 18 (32%) patients on baseline and eight (14%) patients on follow-up had a zero calcium score. In the lesion-based analysis, 53 diseased segments (48%) on baseline CT, and 40 diseased segments (36%) on follow-up CT showed zero calcium. When segments that converted from normal to abnormal calcium were excluded from the analysis, the relative annual change (median, 28.2%; 95% CI, 14.3-36.7%) was similar to previous reports.
In contrast, the progression of non-calcified plaque volume (median, 90.4%; 95% CI, 34.1-233.0%) at follow-up was higher than that reported previously (23, 24). Schmid et al. (23) reported a mean annual progression of 22% (95% CI, 14.7-29.7%) for the volume of non-calcified plaque in the left main and proximal LAD. Inoue et al. (24) reported a non-significant volumetric change (2.1 ± 3.0 vs. 2.3 ± 3.6 mm3, p = 0.2) of low attenuation plaque (< 30 HU) confined to only a 10-mm vascular segment in the non-treated control group. However, we evaluated all segments that showed plaque on CT. Furthermore, since our study population comprised mainly low-to-intermediate risk patients, several baseline volume data approached zero, which resulted in a greater relative annual change.
Although there were limited reports, it seems that non-calcified plaque could progress or regress more rapidly than calcified plaque components (25). We also found more rapid progression (median, 90.4 vs. 0.0%, p < 0.001) of non-calcified than calcified plaque at follow-up. One study found a significant progression in the mean number of cross sections containing non-calcified (p = 0.04) but not calcified (p = 0.2) plaque (26). Non-calcified plaque reflects a feature of early atherosclerotic CHD and is more associated with acute coronary syndrome than calcified plaque (27, 28). Therefore, quantifying the volume change in non-calcified plaque using serial CTA may be a promising shield for acute coronary syndrome. Moreover, this would be most significant if serial assessments were systematically combined with the efficacy of lipid-lowering therapy.
In this present study, the progression of non-calcified plaque was significantly associated with baseline cardiovascular risk factors. In particular, obesity (BMI > 25 kg/m2), smoking history, and HDL level were independent predictors of both absolute and relative annual changes in non-calcified plaque, but calcified plaque was not associated with any risk factors (Table 4). The risk factors correlated with the extent of atherosclerotic plaque are uncertain compared with the relatively well-established relationship between a number of cardiovascular risk factors and clinical event rates (29). Lehman et al. (26) observed that a number of cardiovascular risk factors and smoking were independently associated with plaque progression. Uehara et al. (30) reported that LDL cholesterol level may be an important factor in decreasing non-calcified plaque area. In contrast, Hoffmann et al. (31) found that cardiac risk factors have no significant effect on the plaque growth rate, unlike statin dosage which has a direct effect on the growth rate of non-calcified plaque.
Our findings support a study that found that the rate of change in plaque volume did not differ significantly according to LDL cholesterol level (23). Current guidelines do not recommend CTA screening due to it's radiation hazard, or use of contrast agents due to the expense. Thus, the clinical applications of CTA as a way to monitor for coronary plaque progression remains questionable. Nevertheless our results suggest the importance of risk modification in patients with subclinical CHD.
Some limitations of our study should be addressed. First, this study was retrospective, so the set time period between CT examinations were not explicitly settled. Second, some reports suggest that intensive statin therapy in patients with preexisting coronary disease might induce regression in coronary atheroma burden (32). In our study, only 12 patients were treated with lipid lowering medications during the follow-up and there was no statistically significant relationship between statin therapy and plaque progression. Moreover, most of patients (62.5%) required a follow-up CT scan for periodic health examinations without any optimal medical treatment or risk factor control. Thus these small sample sizes of statin treated or risk controlled groups have limited meaningful analysis of plaque regression.
Third, 2 patients in our study showed an interval increase of calcified plaque volume but a decrease of non-calcified plaque volume. Extensively calcified lesions most likely represent atherosclerosis at later stages of remodeling and may reflect more stable lesions. Our study compared only each quantitative volumetric change and did not consider the effect of calcification of plaque stability. Fourth, the presence of plaque was identified only visually by CT, and MDCT results were not compared to a reference standard such as IVUS. Additionally, the radiation exposure from the repeated MDCT examinations was a major limitation. In our study, the radiation dose for a single MDCT examination was -12 mSv. However recent technical improvements have markedly reduced the radiation dose applied by -45%. This has been accomplished through multiple strategies including usage of low tube voltage in non-obese patients (BMI < 30 or body weight < 90 kg), ECG controlled tube current modulation, prospective ECG triggered scan technique in patients with low heart rates, and a stable sinus rhythm and optimization of scan length (33). These dose reduction technique may increase the acceptability of CT for monitoring the progression/regression of coronary atherosclerotic plaques.
In conclusion, coronary plaque volume increased significantly on follow-up CT, but the rate of progression is greater for non-calcified than for calcified plaque. Additionally, cardiovascular risk factors (obesity, smoking history, and HDL level) were independent predictors of both rapid absolute and relative annual progression of non-calcified plaque volume as assessed by MDCT. No cardiovascular risk factors are associated with the progression of calcified plaque.


 XML Download