

 PDF
PDF ePub
ePub Citation
 Print
Print


INTRODUCTION
The atlas of the International Diabetes Federation (IDF) shows that the estimated number of subjects worldwide who will develop diabetes by 2013 is 382 million, increasing to 592 million by 2035 (1). The prevalence of diabetes has increased worldwide as life expectancy has become prolonged, the incidence of obesity has increased, and lifestyles have changed. Cardiovascular disease (CVD), the principal complication of diabetes, is attributable to all of these risk factors. The incidence and prevalence of, and mortality from, CVD are 2-to 8-fold higher in subjects with diabetes than in those without diabetes (2). Therefore, individual cardiovascular risk assessment of diabetes patients is critical in terms of patient management.
In 1979, the Framingham Risk Score (FRS) equation, based on data from the Framingham Heart Study, was developed. The FRS evaluates age, systolic blood pressure, need for hypertension treatment, smoking status, present diabetes, and levels of high-density lipoprotein cholesterol (HDL-C) and total cholesterol (TC) (3). More recently (in 2013), the New Pooled Cohort Equation, which predicts the risk of atherosclerotic cardiovascular disease (ASCVD), was developed by the American College of Cardiology (ACC) and the American Heart Association (AHA) (4). Both cardiovascular risk scoring systems are commonly used worldwide to evaluate the 10-year risk of cardiovascular disease and to establish management plans. However, the systems are of limited utility when used to score patients with diabetes; diabetes-specific equations must be employed. Therefore, new biomarkers of cardiovascular risk in patients with diabetes are required.
Growth differentiation factor 15 (GDF15), also termed macrophage-inhibiting cytokine 1 (MIC-1), is a member of the transforming growth factor-ß (TGF-ß) superfamily (5). GDF15 is a cytokine released from various cells (including macrophages, cardiomyocytes, and adipocytes) under stressful conditions (67). Circulating GDF15 is present in the blood of all individuals at levels ranging from 150 to 1,150 pg/mL; the level rises dramatically when disease develops (8). The overall and serum GDF15 expression levels increase with age, body mass index (BMI), development of insulin resistance, and development of type 2 diabetes (T2D) (91011). Higher GDF15 levels are associated with the development of various CVDs, including heart failure, atrial fibrillation, and acute coronary syndrome (121314).
Some studies have shown that GDF15 levels are related to the development of obesity and diabetes, and a well-known connection exists between metabolic disorders and CVD levels. However, few reports have explored the relationship between GDF15 levels and CVD in T2D patients. We focused on GDF15 as a marker of whole-body inflammation and, therefore, a possible biomarker of cardiovascular risk in patients with T2D. We explored the associations between serum GDF15 level and conventional cardiovascular risk scores in patients with newly diagnosed T2D. We suggest that the GDF15 level reliably predicts the future development of cardiovascular disease in patients with T2D.
MATERIALS AND METHODS
Subjects
A total of 113 participants were recruited from the outpatient clinic of the Division of Endocrinology and Metabolism of Chungnam National University Hospital from January 2014 to July 2015. The inclusion criteria were as follows: age > 18 years, a BMI > 18.0 kg/m2, and no previous history of diabetes mellitus. Six participants were excluded because of malignancies (one case each of stomach and breast cancer), a fatty liver (one case), and prior CVDs (three cases). Finally, 107 participants were assessed in terms of diabetes mellitus status using the diagnostic criteria of the American Diabetes Association (15). The participants were divided into two groups: those with newly diagnosed T2D (n = 65) and those who were not diabetic (n = 42).
Clinical and biochemical parameters
On the day on which the study commenced, all participants underwent physical examinations. Height, body weight, waist circumference (WC), systemic blood pressure (SBP), and diastolic blood pressure (DBP) were recorded. BMI was calculated as the body weight (kg) divided by the square of the height (m2). All blood samples were collected in the morning after an overnight fast of more than 8 hours into tubes containing ethylenediaminetetraacetic acid (EDTA). We measured the levels of fasting glucose, C-peptide, insulin, triglycerides, total cholesterol (TC), low-density lipoprotein cholesterol (LDL-C), high-density lipoprotein cholesterol (HDL-C), apolipoprotein B, aspartate aminotransferase (AST), alanine aminotransferase (ALT), blood urea nitrogen (BUN), creatinine, high sensitivity C-reactive protein (hsCRP), and glycosylated hemoglobin (HbA1c). We also performed the 75-g oral glucose tolerance test (OGTT). The homeostasis model assessment of insulin resistance (HOMA-IR) was calculated as follows: fasting insulin level (μU/mL) × fasting glucose level (in mmol/L)/22.5. The HOMA-beta index was calculated as follows: fasting insulin level (μU/mL) × 20/fasting glucose level (in mmol/L) − 3.5.
Definition of metabolic syndrome
We defined metabolic syndrome (MS) and components thereof using the USA Adult Treatment Panel III classification of the National Cholesterol Education Program guidelines (16).
GDF15 measurements
Fasting serum GDF15 levels were measured using a quantitative sandwich enzyme-linked immunosorbent assay (ELISA) kit (R&D Systems, Minneapolis, MN, USA; Quantikine ELISA kit for human GDF15, catalog No. DGD150). The ELISA quantitatively immunoassayed human GDF15 levels; the intra-assay coefficient of variation (CV) was < 3% and the inter-assay CV was < 6%.
Statistical analysis
Continuous variables are expressed as the means ± standard deviations (SDs), and the significance of between-group differences was evaluated using Student’s t test or the Mann-Whitney U-test. Categorical variables are expressed as percentages, and between-group differences were compared with the chi-squared test. To evaluate associations between GDF15 level and other variables, we subjected the data to Pearson and partial correlation analyses. A two-tailed P value < 0.05 was regarded as statistically significant. All statistical analyses were performed with SPSS version 21.0 (SPSS Inc., Chicago, IL, USA).
RESULTS
Clinical and biochemical characteristics of study subjects
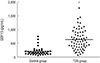
Baseline characteristics of the subjects are shown in Table 1. The T2D group had a higher BMI and WC; higher levels of SBP, DBP, TC, LDL-C, apolipoprotein B, fasting glucose, and fasting C-peptide; and a greater HOMA-IR than did those without diabetes. The proportion of patients diagnosed with metabolic syndrome was higher in the T2D group than in the group without diabetes. The prevalence of both hypertension (under medical treatment) and a history of smoking were higher in the T2D group. Both the FRS and the New Pooled Cohort Equation scores, reflecting the 10-year risk for ASCVD development, were significantly higher in the T2D group. The serum GDF15 level was significantly higher in the T2D group (643.29 ± 361.39 vs. 210.12 ± 142.97 pg/mL) (Fig. 1).
Table 1
Clinical and biochemical characteristics of patients with the newly diagnosed T2D and the control without diabetes
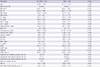
Non-DM, control without diabetes; DM, type 2 diabetes group; GDF15, growth differentiation factor-15; BMI, body mass index; WC, waist circumference; TG, triglyceride; TC, total cholesterol; HDL-C, high density lipoprotein cholesterol; LDL-C, low density lipoprotein cholesterol; HbA1c, glycosylated hemoglobin; AST, aspartate transaminase; ALT, alanine transaminase; BUN, blood urea nitrogen; Cr, creatinine; eGFR, estimated glomerular filtration rate; hsCRP, high sensitivity C-reactive protein; HOMA-IR, homeostatic model assessment-insulin resistance; HOMA-beta, homeostatic model assessment ß-cell function; CVD, cardiovascular disease; CVA, cerebrovascular disease; FRS, Framingham risk score.
Associations between serum GDF15 level and various variables including ASCVD risk
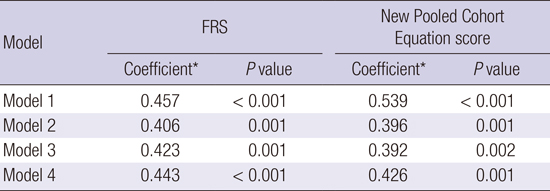
Correlation analyses were performed to determine associations between GDF15 level and other clinical parameters, including the FRS and the New Pooled Cohort Equation score (Table 2). Positive correlations were evident between GDF15 level and age (r = 0.277, P = 0.004), WC (r = 0.262, P = 0.03), the HOMA-IR (r = 0.225, P = 0.02), HbA1c level (r = 0.305, P = 0.001), fasting plasma glucose level (FPG; r = 0.359, P < 0.001), number of metabolic syndrome components (r = 0.354, P < 0.001), the FRS (r = 0.828, P < 0.001), and the New Pooled Cohort Equation score (r = 0.617, P < 0.001). However, GDF15 level was not correlated with hsCRP level or the estimated glomerular filtration rate. In the T2D group, a positive correlation was evident between serum GDF15 level and age (r = 0.418, P = 0.001), the FRS (r = 0.457, P < 0.001), and the New Pooled Cohort Equation score (r = 0.539, P < 0.001). In contrast, the serum GDF15 level did not correlate with the FRS or the New Pooled Cohort Equation score in the group without diabetes. After adjusting for age, LDL-C level, and BMI, partial correlation analyses showed that the serum GDF15 level was significantly (positively) correlated with both the FRS and the New Pooled Cohort Equation score (Table 3). In the T2D group except for seven patients who taking drugs for dyslipidemia, partial correlation analyses also showed that the serum GDF15 level was significantly correlated with both the FRS and the New Pooled Cohort Equation score (data not shown).
Table 2
Pearson’s correlation coefficient between the differences in GDF-15 levels and the differences in various variables
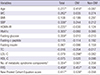
DM, type 2 diabetes group; Non-DM, control without diabetes; GDF15, growth differentiation factor-15; WC, waist circumference; BMI, body mass index; SBP, systolic blood pressure; HOMA-IR, homeostatic model assessment-insulin resistance; HbA1c, glycosylated hemoglobin; TC, total cholesterol; LDL-C, low density lipoprotein cholesterol; HDL-C, high density lipoprotein cholesterol; FRS, Framingham risk score.
*P < 0.05; †Zero to five factors are defined by NCEP-ATP III clinical identification of metabolic syndrome; waist circumference, blood pressure, triglycerides, HDL cholesterol, and fasting glucose level.
Table 3
Association of serum GDF15 with FRS and New Pooled Cohort Equation score in type 2 diabetes group
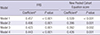
Model 2, adjustment for age; Model 3, adjustment for age and LDL-C; Model 4, adjustment for age, LDL-C and BMI.
GDF15, growth differentiation factor-15; LDL-C, low density lipoprotein cholesterol; FRS, Framingham risk score.
*Pearson correlation coefficients were used to assess the relationship between variables.
DISCUSSION
We found that the serum GDF15 level correlated with representative indices of the future risk of CVD in newly diagnosed T2D patients. The mean GDF15 level was higher in the T2D group than in the group without diabetes (Fig. 1). Serum GDF15 levels were correlated with HOMA-IR, HbA1c level, and fasting glucose level. These associations were statistically significant and consistent with the results of previous studies (1117). However, there was negative correlation between LDL-C and GDF15. Previous studies have found the same result and suggest that GDF15 is associated with different LDL-C subtypes (18). In the T2D group, we found that the serum GDF15 level was correlated with both the FRS and the New Pooled Cohort Equation score, which measures the 10-year risk of CVD. Apart from these scores, age was the single most important variable that correlated with serum GDF15 level in the T2D group. We found consistent correlations between the serum GDF15 level and cardiovascular risk scores after adjusting for age in the T2D group, but not in the control (without diabetes) group. However, we found no positive correlation between serum GDF15 and high-sensitivity C-reactive protein (hsCRP) levels; the latter reflects the extent of inflammation in both atherosclerosis and diabetes (1920).
Some reports have found that the serum GDF15 level was highest in T2D patients, lowest in patients without diabetes, and intermediate in individuals with prediabetes (1120). Moreover, serum GDF15 levels were inversely correlated with insulin sensitivity and positively correlated with dyslipidemia (1121). Associations between GDF15 levels and various types of CVD have been reported in general populations (121422). The GDF15 level was prognostic of heart failure (12), associated with recurrent adverse events after the development of acute coronary syndrome (14), and was suggested to serve as a useful novel biomarker of mortality in patients with non-ST-elevation myocardial infarction (22). More recently, the level of GDF15 has been suggested to be a useful predictive biomarker of diabetic cardiomyopathy in T2D patients (23). Therefore, the GDF15 level may usefully predict both insulin resistance and metabolic dysfunction.
Although the details on how GDF15 expression is controlled remain largely unknown, we offer a speculative explanation of our present results. The components of the FRS and the New Pooled Cohort Equation score are similar: age, total cholesterol and HDL-C levels, systemic blood pressure, hypertension, the presence or absence of diabetes, and smoking history. All of these components are well-known risk factors for CVD in patients with diabetes. In the present study, each component was significantly correlated with serum GDF15 level in the T2D group. However, we found no correlation between the serum GDF15 level and components of the cardiovascular risk scores in patients without diabetes. Together, these data suggest that the serum GDF15 level may be a useful biomarker for the estimation of CVD risk in T2D patients.
To the best of our knowledge, this is the first study to investigate an association between serum GDF15 level and cardiovascular risk in T2D patients. We examined newly diagnosed T2D patients who were drug-naïve to exclude any possible bias caused by underestimating hyperglycemia in patients who were medicated. In addition, we excluded participants with any prior history of CVD. Thus, no patient had any CVD, which is a long-term macrovascular complication of T2D.
Our study had some limitations. First, the precise mechanism of GDF15 expression and the signaling pathways involved remain unclear. Second, we did not perform a long-term follow-up analysis. A large-scale prospective study is needed to confirm that serum GDF15 level predicts cardiovascular risk of T2D patients.
In conclusion, we observed independent associations between the serum GDF15 level and conventional cardiovascular risk prediction scores in newly diagnosed T2D patients. This suggests that the serum GDF15 level may be a more useful clinical biomarker than the present conventional scoring systems, estimating later cardiovascular risk in early-stage T2D patients without any long-term complications of CVD.
 XML Download