Journal List > J Korean Med Sci > v.31(6) > 1023317

Lee, Jang, Kang, Lee, Choi, Shim, Lim, Bae, and Chung: Percentile Distributions of Birth Weight according to Gestational Ages in Korea (2010-2012)

Abstract

The Pediatric Growth Chart (2007) is used as a standard reference to evaluate weight and height percentiles of Korean children and adolescents. Although several previous studies provided a useful reference range of newborn birth weight (BW) by gestational age (GA), the BW reference analyzed by sex and plurality is not currently available. Therefore, we aimed to establish a national reference range of neonatal BW percentiles considering GA, sex, and plurality of newborns in Korea. The raw data of all newborns (470,171 in 2010, 471,265 in 2011, and 484,550 in 2012) were analyzed. Using the Korean Statistical Information Service data (2010–2012), smoothed percentile curves (3rd–97th) by GA were created using the lambda-mu-sigma method after exclusion and the data were distinguished by all live births, singleton births, and multiple births. In the entire cohort, male newborns were heavier than female newborns and singletons were heavier than twins. As GA increased, the difference in BW between singleton and multiples increased. Compared to the previous data published 10 years ago in Korea, the BW of newborns 22–23 gestational weeks old was increased, whereas that of others was smaller. Other countries' data were also compared and showed differences in BW of both singleton and multiple newborns. We expect this updated data to be utilized as a reference to improve clinical assessments of newborn growth.

Graphical Abstract

jkms-31-939-ab001

INTRODUCTION

Worldwide data of the significance of newborn birth weight (BW) have been studied since the 1970s (1). By analyzing newborn BW by gestational age (GA), we can evaluate fetal growth, intrauterine growth restriction (which has high perinatal mortality), and epidemiologic data comparing fetal growth and chronic adulthood disease. The newborn's condition immediately after birth can be predicted accordingly. From the long-term perspective, a nation's public health system could be established (23). Since 2000, several studies have provided a reference range of newborn BW by GA in Korea. However, some have limitations, including: an insufficient sample size based on 18,427 newborns in 2003; the Korean Statistical Information Service data (2001-2003, 1,509,763 persons; 2000–2004, 2,585,516 persons) were based on the previous 10 years; and recent data based on Korean Statistical Information Service data (2008-2012) did not exclude the common error showing the double humped curve that appears most frequently in the big data analysis and made only singleton references (4567).
It has recently become popular in Korea to marry at a later age, which could increase the number of elderly gravida and high-risk pregnancies, eventually increasing premature birth rates. In addition, in vitro fertilization is associated with an increase in multiple pregnancies. There has been a recent increase in inter-racial infants in Korea (8910). These changes have a strong influence on BW. Therefore, in this study, we aimed to establish a new national reference range of neonatal BW percentiles considering the GA, sex, and plurality of newborns in Korea.

MATERIALS AND METHODS

For this study, we used the Korean Statistical Information Service data (2010.01–2012.12) of a total of 1,425,986 newborns. The raw data of all newborns (470,171 in 2010, 471,265 in 2011, and 484,550 in 2012) were analyzed. Our results were based on 1,422,890 births after exclusions. Newborns with unknown BW (n = 2,100), unknown GA (n = 2,514), or a GA < 22 weeks (n = 73) or > 42 weeks (n = 297) were excluded. Some of the exclusions (n = 1,888) are duplicated. The GA referred to the interval, in completed weeks, between the first day of the mother's last menstrual period and the delivery date. Therefore, the GA of 40 weeks means 40 weeks plus 0–6 days. BW was measured to the nearest 10 g.
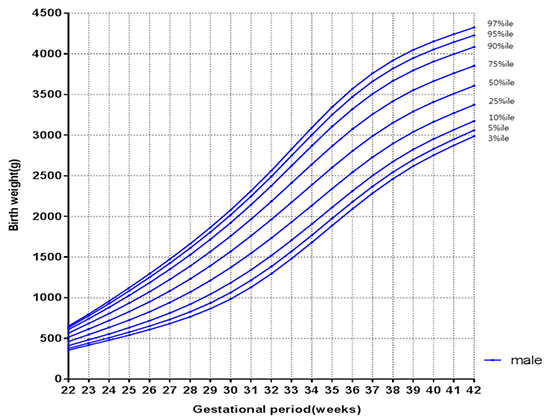
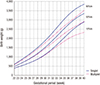
Fig. 1 represented the percentile curves of BW for GA based on the Korean Statistical Information Service's raw data after exclusions. It included the estimated error data of 28–32 weeks' gestation. The histogram of BW of 28–32 weeks' gestation before smoothing showed a double humped curve as reported by Lee (6). Both humps are normal distributions with the estimated truth (left) and error values (right).
Fig. 1
Percentile curves [3rd, 5th, 10th, 25th, 50th, 75th, 90th, 95th, and 97th] of birth weight for gestational age based on the raw data. %, percentile.
jkms-31-939-g001
This report used the Finite Gaussian mixture model, which is a convex combination of two or more probability density functions that was enabled to correct the error and represent the normal distribution curve (1112). The lambda-mu-sigma (LMS) method, a way of obtaining normalized growth curves, was developed by Cole and Green (13), and it was expected that the data could be normalized using a powerful transformation that changes raw data into a standard deviation Z-score. The LMS method calculates asymmetrical parameters by the Box-Cox transformation to be normal. Here it estimated the three parameters of the Box-Cox transformation of the measurement distribution (14). The three parameters are constrained to change smoothly as the covariate changes.
The LMS methods were analyzed by Stata version 12.0 (StataCorp, College Station, TX, USA). Moreover, all graphs were made using GraphPad Prism software (ver. 6.05, GraphPad Software Inc., La Jolla, CA, USA). The SPSS for Windows (version 18.0; SPSS, Chicago, IL, USA) was used for the data input, processing, and analysis. The smoothed data were represented by the BW percentile curves. The curves appeared at intervals of one week by gestation and separated into all live births, singlet births, and multiple births. We also constructed separate curves and tables for male and female newborns for the 3rd, 5th, 10th, 25th, 50th, 75th, 90th, 95th, and 97th percentiles from 22 to 42 completed weeks based on smoothed estimated curves.
Classification according to BW are as follows: extremely low birth weight (ELBW, BWs < 1,000 g) infants, very low birth weight (VLBW, BWs < 1,500 g) infants, low birth weight (LBW, BWs < 2,500 g) infants, normal birth weight (NBW, 2,500 ≤ BWs ≤ 3,999 g) infants, high birth weight (HBW, BWs > 4,000 g) infants.

RESULTS

Of all infants born between 2010 and 2012, there were 733,980 and 692,006 boys and girls, respectively, showing a gender ratio of 1.06, and there were 1,381,088 and 42,314 singleton and multiple births, respectively (Table 1). After assessing BW and GA for the 3-year period, extremely low BW infants and very low BW infants accounted for 0.24% and 0.62%, respectively, while premature birth infants born at < 37 weeks' gestation accounted for 6% of the total infant population (Table 2). Initially, data on 2,726 infants whose BW and GAs were unclear as well as those of 370 infants whose GA was ≤ 21 weeks or ≥ 43 weeks were excluded from the raw data of the National Statistical Office of South Korea. Subsequently, error data of 28–32 weeks' gestation were removed, followed by smoothing with the LMS method.
Table 1

Number of infants divided by infant sex and multiplicity before exclusions, 2010–2012

jkms-31-939-i001
Demography parameters Year
2010 2011 2012 Total
Sex
 Male 242,901 242,121 248,958 733,980
 Female 227,270 229,144 235,592 692,006
 Male/female ratio 1.07 1.06 1.06 1.06
Multiplicity*
 Singlet 455,309 457,171 468,608 1,381,088
 Multiple 12,841 13,852 15,621 42,314
 Multiple birth rate 27.3 29.4 32.2 29.7
*Except unknown multiplicity.
Per 1,000 live births.
Table 2

Distribution of births by birth weight and gestational period before exclusions, 2010-2012

jkms-31-939-i002
Birth parameters No. (%) of birth
By birth weight
 ELBW infants 3,394 (0.24)
 VLBW infants 8,789 (0.62)
 LBW infants 74,054 (5.19)
 NBW infants 1,300,902 (91.23)
 HBW infants 48,930 (3.43)
 Unknown 2,100 (0.15)
 Total 1,425,986 (100)
By gestational period
 Preterm infants 86,365 (6.06)
 Term infants 1,333,242 (93.5)
 Post-term infants 3,865 (0.27)
 Unknown 2,514 (0.18)
 Total 1,425,986 (100)
ELBW, extremely low birth weight; VLBW, very low birth weight; LBW, low birth weight; NBW, normal birth weight; HBW, high birth weight.
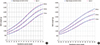
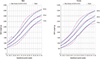
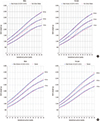
All infants were classified according to gestation regardless of singleton or multiple birth, and data on the 3rd, 5th, 10th, 25th, 50th, 75th, 90th, 95th, and 97th percentiles are presented in Tables 3 (male) and 4 (female). Data on boys and girls born by singleton and multiple births are presented in Tables 5678. The BW percentile curves after smoothing singleton births are presented in Fig. 2A and 2B, while the BW percentile curves of multiple births are presented in Fig. 3A and 3B. In the 10th, 50th, and 90th percentile graphs of singleton births, boys showed higher BW than those of girls in the total infant graphs at each GA (Fig. 2C). Multiple-birth infants also showed a pattern similar to that of singleton-birth infants. However, BW of boys and girls close to 40 weeks' gestation in the 10th percentile graph tended to be similar (Fig. 3C). When graphs of singleton- and multiple-birth male and female infants overlapped by GA, more differences in BW were seen between multiple- and singleton-birth infants as GA increased (Fig. 4).
Table 3

Smoothed 3rd, 5th, 10th, 25th, 50th (median), 75th, 90th, 95th, and 97th percentiles of birth weight (g) for 22–42 weeks' gestational age for all male infants
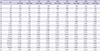
jkms-31-939-i003
GP No. 3rd
Percentile
5th
Percentile
10th
Percentile
25th
Percentile
50th
Percentile
75th
Percentile
90th
Percentile
95th
Percentile
97th
Percentile
22 65 356 374 402 448 499 550 596 623 641
23 157 418 441 476 535 602 669 730 767 791
24 285 479 507 550 624 707 793 871 918 949
25 325 541 575 628 717 819 923 1,017 1,074 1,112
26 434 606 647 712 819 940 1,061 1,171 1,236 1,279
27 547 677 728 805 932 1,072 1,210 1,334 1,407 1,454
28 744 758 819 909 1,057 1,216 1,371 1,507 1,587 1,638
29 793 857 926 1,030 1,197 1,374 1,544 1,692 1,779 1,835
30 1,032 974 1,052 1,167 1,351 1,545 1,730 1,891 1,985 2,045
31 1,325 1,114 1,197 1,321 1,518 1,728 1,929 2,103 2,205 2,271
32 1,944 1,273 1,359 1,488 1,697 1,922 2,139 2,330 2,442 2,514
33 2,728 1,448 1,535 1,668 1,888 2,127 2,362 2,571 2,695 2,775
34 5,236 1,637 1,725 1,861 2,087 2,339 2,591 2,817 2,952 3,040
35 9,516 1,836 1,924 2,060 2,292 2,552 2,816 3,057 3,202 3,297
36 22,408 2,038 2,126 2,262 2,494 2,759 3,030 3,280 3,431 3,530
37 67,989 2,237 2,323 2,458 2,688 2,953 3,226 3,479 3,633 3,735
38 188,256 2,422 2,506 2,638 2,864 3,125 3,395 3,647 3,801 3,902
39 210,907 2,588 2,670 2,798 3,018 3,273 3,538 3,785 3,937 4,038
40 174,916 2,735 2,814 2,938 3,152 3,400 3,659 3,901 4,051 4,150
41 40,834 2,867 2,943 3,063 3,270 3,511 3,763 4,001 4,147 4,244
42 1,677 2,992 3,066 3,181 3,381 3,614 3,859 4,091 4,234 4,329
GP, gestational period.
Table 4

Smoothed 3rd, 5th, 10th, 25th, 50th (median), 75th, 90th, 95th, and 97th percentile birth weight (g) for 22–42 weeks' gestation for all female infants
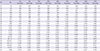
jkms-31-939-i004
GP No. 3rdPercentile 5thPercentile 10thPercentile 25thPercentile 50thPercentile 75thPercentile 90thPercentile 95thPercentile 97thPercentile
22 62 349 361 381 419 467 523 582 622 650
23 123 409 425 452 500 563 635 710 760 795
24 240 467 488 521 583 661 750 841 901 943
25 328 523 549 592 668 764 871 978 1,047 1,095
26 379 582 614 667 761 875 1,000 1,122 1,200 1,252
27 493 646 686 751 864 998 1,140 1,275 1,359 1,415
28 674 720 770 848 981 1,134 1,291 1,437 1,525 1,583
29 643 810 869 961 1,114 1,285 1,457 1,612 1,705 1,766
30 892 919 987 1,090 1,261 1,449 1,635 1,801 1,900 1,964
31 1,013 1,051 1,125 1,238 1,423 1,627 1,828 2,008 2,114 2,183
32 1,561 1,204 1,281 1,400 1,598 1,817 2,035 2,231 2,348 2,423
33 2,198 1,371 1,451 1,575 1,784 2,018 2,254 2,469 2,598 2,682
34 4,213 1,553 1,635 1,762 1,979 2,226 2,479 2,711 2,851 2,943
35 7,659 1,746 1,828 1,958 2,181 2,437 2,702 2,948 3,098 3,197
36 18,226 1,943 2,026 2,156 2,381 2,642 2,914 3,167 3,323 3,426
37 56,714 2,137 2,220 2,350 2,574 2,835 3,108 3,363 3,520 3,624
38 163,877 2,319 2,400 2,528 2,749 3,006 3,274 3,526 3,681 3,784
39 197,141 2,484 2,563 2,688 2,904 3,155 3,417 3,662 3,813 3,913
40 184,907 2,627 2,705 2,827 3,038 3,282 3,536 3,774 3,921 4,017
41 47,541 2,756 2,832 2,951 3,157 3,394 3,641 3,871 4,012 4,106
42 1,888 2,878 2,952 3,068 3,269 3,499 3,738 3,961 4,097 4,188
GP, gestational period.
Table 5

Smoothed 3rd, 5th, 10th, 25th, 50th (median), 75th, 90th, 95th, and 97th percentile birth weight (g) for 22-42 weeks' gestation for singleton-birth male infants
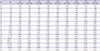
jkms-31-939-i005
GP No. 3rd
Percentile
5th
Percentile
10th
Percentile
25th
Percentile
50th
Percentile
75th
Percentile
90th
Percentile
95th
Percentile
97th
Percentile
22 27 356 378 411 462 516 566 610 635 652
23 82 417 443 483 547 616 684 743 777 800
24 162 478 508 555 634 720 806 882 928 958
25 205 541 577 633 726 830 935 1,030 1,087 1,124
26 278 609 652 718 828 951 1,074 1,186 1,252 1,296
27 375 683 734 812 942 1,084 1,225 1,351 1,426 1,475
28 538 766 827 920 1,070 1,232 1,390 1,529 1,611 1,664
29 604 865 936 1,043 1,213 1,394 1,568 1,719 1,808 1,865
30 793 985 1,065 1,184 1,372 1,571 1,760 1,924 2,020 2,081
31 1,003 1,128 1,215 1,342 1,546 1,761 1,966 2,143 2,247 2,313
32 1,338 1,295 1,384 1,518 1,733 1,963 2,184 2,377 2,491 2,563
33 1,974 1,482 1,571 1,708 1,931 2,174 2,412 2,623 2,748 2,828
34 3,830 1,681 1,770 1,907 2,136 2,389 2,642 2,869 3,005 3,093
35 7,105 1,888 1,976 2,112 2,342 2,602 2,865 3,106 3,251 3,345
36 17,178 2,093 2,179 2,313 2,543 2,805 3,074 3,321 3,472 3,571
37 60,877 2,287 2,371 2,503 2,730 2,990 3,259 3,509 3,662 3,762
38 186,011 2,464 2,546 2,675 2,897 3,153 3,419 3,667 3,820 3,920
39 210,574 2,619 2,698 2,824 3,040 3,291 3,553 3,797 3,948 4,048
40 174,769 2,753 2,830 2,952 3,163 3,408 3,664 3,905 4,053 4,152
41 40,813 2,873 2,948 3,066 3,271 3,510 3,761 3,997 4,144 4,241
42 1,674 2,987 3,060 3,174 3,373 3,606 3,851 4,084 4,228 4,324
GP, gestational period.
Table 6

Smoothed 3rd, 5th, 10th, 25th, 50th (median), 75th, 90th, 95th, and 97th percentile birth weight (g) for 22-42 weeks' gestation for singleton-birth female infants
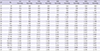
jkms-31-939-i006
GP No. 3rd
Percentile
5th
Percentile
10th
Percentile
25th
Percentile
50th
Percentile
75th
Percentile
90th
Percentile
95th
Percentile
97th
Percentile
22 28 354 366 387 426 477 540 609 658 694
23 69 412 428 455 506 572 652 738 798 841
24 139 467 488 522 586 669 766 869 938 987
25 230 520 546 590 670 771 886 1,003 1,080 1,133
26 270 575 609 664 762 883 1,015 1,145 1,228 1,284
27 329 636 679 747 866 1,007 1,156 1,297 1,385 1,443
28 505 710 763 846 987 1,147 1,311 1,461 1,553 1,612
29 496 802 865 962 1,124 1,303 1,481 1,641 1,736 1,798
30 661 916 988 1,098 1,278 1,474 1,666 1,837 1,938 2,003
31 743 1,056 1,135 1,254 1,449 1,661 1,869 2,052 2,161 2,231
32 1,069 1,220 1,302 1,427 1,634 1,861 2,085 2,286 2,405 2,482
33 1,466 1,401 1,485 1,614 1,830 2,071 2,313 2,531 2,662 2,748
34 2,888 1,595 1,680 1,810 2,033 2,285 2,542 2,777 2,920 3,013
35 5,316 1,797 1,881 2,013 2,238 2,497 2,764 3,012 3,163 3,262
36 13,186 1,999 2,082 2,212 2,437 2,698 2,969 3,223 3,379 3,481
37 49,484 2,191 2,272 2,401 2,623 2,881 3,151 3,405 3,561 3,664
38 161,640 2,365 2,444 2,570 2,788 3,041 3,306 3,555 3,709 3,811
39 196,832 2,516 2,594 2,717 2,930 3,177 3,436 3,678 3,828 3,927
40 184,778 2,646 2,723 2,843 3,051 3,292 3,544 3,779 3,924 4,020
41 47,525 2,762 2,837 2,955 3,159 3,394 3,639 3,868 4,009 4,102
42 1,882 2,871 2,945 3,061 3,260 3,490 3,729 3,951 4,088 4,178
GP, gestational period.
Table 7

Smoothed 3rd, 5th, 10th, 25th, 50th (median), 75th, 90th, 95th, and 97th percentile birth weight (g) for 22-40 weeks' gestation for multiple-birth male infants

jkms-31-939-i007
GP No. 3rd
Percentile
5th
Percentile
10th
Percentile
25th
Percentile
50th
Percentile
75th
Percentile
90th
Percentile
95th
Percentile
97th
Percentile
22 19 368 386 413 457 506 554 597 622 638
23 41 426 449 485 544 608 670 725 758 779
24 76 478 509 556 632 713 791 859 899 925
25 77 531 570 629 723 822 916 998 1,045 1,076
26 111 588 637 708 821 938 1,049 1,144 1,199 1,234
27 147 657 714 797 928 1,063 1,190 1,299 1,362 1,402
28 185 742 806 900 1,047 1,198 1,340 1,462 1,533 1,578
29 173 848 918 1,020 1,180 1,345 1,500 1,634 1,711 1,760
30 228 973 1,046 1,155 1,325 1,501 1,667 1,809 1,892 1,944
31 316 1,114 1,190 1,303 1,480 1,665 1,840 1,991 2,078 2,134
32 545 1,264 1,341 1,456 1,640 1,833 2,017 2,176 2,269 2,328
33 743 1,415 1,493 1,611 1,801 2,003 2,197 2,366 2,465 2,529
34 1,396 1,564 1,643 1,764 1,960 2,171 2,376 2,555 2,661 2,729
35 2,401 1,705 1,786 1,910 2,112 2,332 2,547 2,737 2,850 2,922
36 5,206 1,828 1,912 2,039 2,249 2,479 2,706 2,908 3,028 3,106
37 7,081 1,925 2,012 2,145 2,367 2,612 2,855 3,073 3,203 3,287
38 2,197 1,989 2,082 2,226 2,465 2,731 2,997 3,236 3,379 3,472
39 301 2,026 2,127 2,284 2,547 2,841 3,136 3,402 3,562 3,666
40 120 2,048 2,159 2,331 2,620 2,946 3,275 3,573 3,753 3,870
GP, gestational period.
Table 8

Smoothed 3rd, 5th, 10th, 25th, 50th (median), 75th, 90th, 95th, and 97th percentile birth weight (g) for 22-40 weeks' gestation for multiple-birth female infants

jkms-31-939-i008
GP No. 3rd
Percentile
5th
Percentile
10th
Percentile
25th
Percentile
50th
Percentile
75th
Percentile
90th
Percentile
95th
Percentile
97th
Percentile
22 15 350 365 389 429 472 515 554 577 591
23 34 410 430 461 512 567 621 670 698 717
24 65 467 493 532 595 664 732 792 827 850
25 80 525 556 603 681 766 850 924 968 996
26 79 587 623 680 773 875 977 1,068 1,122 1,157
27 144 657 700 765 874 994 1,113 1,221 1,285 1,326
28 149 737 787 862 987 1,124 1,259 1,380 1,451 1,498
29 135 830 887 973 1,113 1,265 1,413 1,544 1,622 1,672
30 216 938 1,001 1,097 1,251 1,416 1,576 1,716 1,799 1,851
31 260 1,063 1,131 1,233 1,399 1,575 1,745 1,894 1,982 2,038
32 479 1,201 1,272 1,379 1,552 1,739 1,920 2,079 2,172 2,232
33 725 1,343 1,416 1,527 1,709 1,905 2,097 2,266 2,366 2,430
34 1,317 1,489 1,564 1,678 1,866 2,071 2,273 2,451 2,557 2,626
35 2,332 1,630 1,707 1,824 2,018 2,231 2,441 2,629 2,740 2,812
36 5,028 1,760 1,839 1,960 2,161 2,382 2,601 2,798 2,914 2,990
37 7,217 1,869 1,951 2,077 2,287 2,519 2,750 2,957 3,080 3,160
38 2,213 1,955 2,042 2,176 2,399 2,646 2,893 3,115 3,248 3,334
39 287 2,021 2,114 2,258 2,498 2,765 3,032 3,273 3,418 3,511
40 100 2,076 2,176 2,331 2,590 2,880 3,171 3,433 3,591 3,694
GP, gestational period.
Fig. 2
Smoothed percentile curves of birth weight distribution by gestational age for singlet (A) male, (B) female, and (C) male + female populations. %ile, percentile.
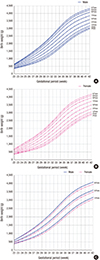
jkms-31-939-g002
Fig. 3
Smoothed percentile curves of birth weight distribution by gestational age for twin (A) male, (B) female, and (C) male + female populations. %ile, percentile.
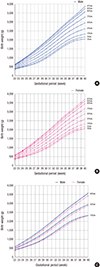
jkms-31-939-g003
Fig. 4
Comparison of singleton and multiple percentile curves of birth weight by gestational age for male and female infants. %ile, percentile.
jkms-31-939-g004
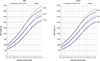
When BW of singleton-birth male and female infants were compared with other data in South Korea from 2000–2004 for the 10th, 50th, and 90th percentile graphs (6), the patterns were similar for 30–32 weeks, whereas the 10th percentile graph of the present study showed a lower mean BW before 30 weeks' gestation (Fig. 5A). In contrast, when twin male and female infants were compared in the 10th, 50th, and 90th percentiles, BW increased after 37 weeks' gestation compared to the data of 2000–2004 (Fig. 5B).
Fig. 5
Comparison of (A) singleton, (B) twin birth weight percentile curves for male and female infants among different study of Korean populations. %ile, percentile.
jkms-31-939-g005
Graphs of data from 7,993,166 singleton-birth infants born in Brazil between 2003 and 2005 were compared with the 10th, 50th, and 90th percentile graphs; both boys and girls were heavier than singleton-birth infants in Brazil in the 10th percentile but lighter in the 90th percentile (Fig. 6) (15). Compared with data of 676,605 singleton births in Canada between 1994 and 1996 (16), Canadian infants were lighter or similar in BW until 36 weeks' gestation, but BW of Korean infants were much lower than those of Canadian infants after 36 weeks' gestation (Fig. 7). While BW of twins were higher than those of American and Taiwanese boys and girls, the gap decreased after 38 weeks' gestation (Fig. 8) (1718). In the American study, the fetal growth of each twin was estimated from regression curves fit to ultrasonographic fetal weight measurements, and the estimated data could have a bias.
Fig. 6
Comparison of singleton birth weight percentile curves of Brazil. %ile, percentile.
jkms-31-939-g006
Fig. 7
Comparison of singleton birth weight percentile curves of Canada. %ile, percentile.
jkms-31-939-g007
Fig. 8
Comparison of twin birth weight percentile curves of the United States (A) and Taiwan (B). %ile, percentile.
jkms-31-939-g008

DISCUSSION

The most basic characteristic of babyhood is growth, and since abnormal growth may be a critical signal of disease, its evaluation is essential (19). Growth begins in the uterus, and BW, the starting point after birth, is an important index for quantifying uterine and later growth and related to complications including perinatal mortality and perinatal distress (20). BW is also related to the development of cardiovascular disease, diabetes, and hypertension in adulthood (21). However, since infant BW is affected by both environmental and genetic factors, it is important to identify the percentile distribution of BW during pregnancy using recent data to evaluate infants (22). In fact, the reference BW of the 90th percentile, which was the reference for 30 weeks' gestation singleton births in the present study, was 1,924 g for boys and 1,837 g for girls. These weights were higher than those reported in Korea approximately 10 years previously (boys, 1,855 g; girls, 1,758 g). In addition, the reference BW were higher than those reported in the United States for 257,855 singleton births between 1998 and 2006 (boys, 1,761 g; girls, 1,693 g), and in Canada for 676,605 singleton births between 1994 and 1996 (boys, 1,837 g; girls 1,783 g). The reference BW for the 10th percentile at 40 weeks' gestation were 3,000 g for boys and 2,890 g for girls. These weights were higher than those in Korea 10 years previously (boys, 2,898 g; girls, 2,790 g) and those reported in the US (boys, 2,950 g; girls, 2,855 g) but were lower than those in a Canadian report (boys, 3,079 g; girls, 2,955 g) (61623).
In this study, male singleton and multiple infants had higher BW than female infants at each GA. These findings are consistent with those of other studies. According to the report by Kramer et al. (16), the mean BW of male singletons is approximately 50 g heavier than that of female singletons at the 90th percentile at 30 weeks' gestation, increasing to 120 g heavier at the 10th percentile at 42 weeks' gestation. Roberts et al reported that the mean BW of male twins is approximately 100 g heavier than that of female twins at 27–29 weeks' gestation, increasing to 150 g heavier at 40 weeks' GA (24). Fetal growth is generally influenced by placental properties and the fetus's inherent growth potential. This observed gender-specific difference may be caused by gender-dependent differences in “sensitivity” to the placental and fetal tissue to fasting plasma glucose or weight gain–associated factors (25). The differences in BW between males and females reportedly differed less in multiples than in singletons (26). However, our study showed that this gender difference was almost the same within singleton and multiple births.
Compared to singleton-birth infants, multiple-birth infants have limited growth within the uterus; therefore, the evaluation criteria for infant BW need to be changed depending on singleton or multiple births (17). The growth of twins and triplets is reportedly similar to that of singleton-birth infants until 32 and 29 weeks' gestation, respectively, after which point it differs from that of singleton-birth infants. In contrast, it has been reported that a difference in growth between singleton- and multiple-birth infants began to appear after 28 weeks since multiple-birth infants showed growth limitations after 28 weeks' gestation (2327). According to the report by Bleker et al. (26), the difference in BW between singletons twins at 39–40 weeks' gestation was 600 g. Our study showed a similar difference in BW between singletons and multiples until about 30 weeks' gestation, but as GA increased after 30 weeks, the difference was greater. As such, the mean BW of male singletons is approximately 460 g heavier than that of female singletons, while that of male multiples is 410 g heavier than that of female multiples at the 50th percentile at 40 weeks' gestation.
We compared our new curve with previously published data on singleton (both sexes) and twin BW percentiles by GA in 2000–2004 in Korea. When the validation samples were categorized as small for GA (SGA; < 10th percentile of a standard BW curve for GA)/appropriate for GA (10th percentile ≤ appropriate for GA ≤ 90th percentile of a standard BW curve for GA)/large for GA (> 90th percentile of a standard BW curve for GA), the new curves had lower average weights at younger GA until 30–31 weeks and higher or similar average weights after 31 weeks on the SGA curve. The differences found between our new curves and previous curves may be explained in part by differences in the infants who were born in 2010–2012 versus those born in 2000–2004. These differences in BW distribution may be explained by multiple factors that influence BW in developed countries, such as smoking, low weight gain during pregnancy, low pre-pregnancy body mass index or demographic changes by increasing numbers of multicultural families in Korea (2829). On the contrary, the new curves had higher average weights at younger GA until 32–33 weeks and lower average weights after 33 weeks on the large for GA curve. Data from Statistics Korea reported that the percentages of HBW infants among total live births decreased over the years as follows: 6.7% (1993), 6.3% (1995), 5.1% (1997), 4.5% (2000), and 3.5% (2010). Between 1993 and 2010, the average BW of Korea was reduced from 3.31 kg in 1993 to 3.22 kg in 2010 by approximately 0.1 kg (30). Recent changes in percentages of HBW infants and average BW could help to explain why the new curves are shifted down in the older GA on the appropriate GA and large for GA curves. Compared with twin curves, our twin curve had similar average weights at < 37 weeks but higher weights at > 37 weeks. The reason for these differences is currently unknown and should be confirmed in further studies that include fetal outcome.
Despite the fact that the total number of newborns in 2010 was lower than that in 2000, the number of multiple gestations increased from 10,723 in 2000 to 12,841 in 2010, while the multiple birth rate increased 1.6 times from 16.9 in 2000 to 27.3 in 2010 as results of the ovulation inducing agent related to artificial insemination and the increased use of in vitro fertilization (313233). Although multiples compared with singletons have higher mortality and morbidity rates, few studies have examined the BW of multiples in Korea (3435). In this study, we tried to establish the distribution of BW percentiles considering newborn plurality. However, the overall data of newborns by the Korean Statistical Information (2010–2012) have estimated errors at 28–32 weeks' gestation. The distribution curves represent the double humped curve. The estimated error data were located on the right, which means heavier newborns for GA. This is the limitation of the large data analysis, but this report removed errors using the Finite Gaussian mixture model.
In this study, we established the new reference range of the neonatal BW percentiles considering GA, sex, and plurality of newborns in Korea. We expect the updated data to be utilized as a new Korean reference to improve clinical growth assessments in newborns.

Notes

DISCLOSURE The authors have no potential conflicts of interest to disclose.

AUTHOR CONTRIBUTION Study conception and design: Lee JK, Jang HL, Kang BH, Shim KS, Choi YS, Bae CW, Chung SH. Data acquisition: Lee KS. Statistical analysis: Lim JW. First draft of the manuscript: Lee JK, Chung SH. Manuscript approval: all authors.

References

1. Babson SG, Behrman RE, Lessel R. Fetal growth. Liveborn birth weights for gestational age of white middle class infants. Pediatrics. 1970; 45:937–944.
2. Thomas P, Peabody J, Turnier V, Clark RH. A new look at intrauterine growth and the impact of race, altitude, and gender. Pediatrics. 2000; 106:E21.
3. Ananth CV, Wen SW. Trends in fetal growth among singleton gestations in the United States and Canada, 1985 through 1998. Semin Perinatol. 2002; 26:260–267.
4. Lee JJ, Kim MH, Ko KO, Kim KA, Kim SM, Kim ER, Kim CS, Son DW, Shim JW. The study of growth measurements at different gestatioal ages of Korean newborn the survey and statistics. J Korean Soc Neonatol. 2006; 13:47–57.
5. Lee JJ, Park CG, Lee KS. Birth weight distribution by gestational age in Korean population: using finite mixture model. Korean J Pediatr. 2005; 48:1179–1186.
6. Lee JJ. Birth weight for gestational age patterns by sex, plurality, and parity in Korean population. Korean J Pediatr. 2007; 50:732–739.
7. Lim JS, Lim SW, Ahn JH, Song BS, Shim KS, Hwang IT. New Korean reference for birth weight by gestational age and sex: data from the Korean Statistical Information Service (2008-2012). Ann Pediatr Endocrinol Metab. 2014; 19:146–153.
8. Chung SH, Choi YS, Bae CW. Changes in neonatal epidemiology during the last 3 decades in Korea. Neonatal Med. 2013; 20:249–257.
9. Statistics Korea. Cause of death statistics, maternal death rate. Infant, Maternal and Perinatal mortality Statistics 2010~2012. Daejeon: Statistics Korea;2012. p. 21–27.
10. Organisation for Economic Co-operation and Development. OECD Family Database [Internet]. 2012. accessed on 1 October 2015. Available at http://stats.oecd.org/Index.aspx?DataSetCode=FAMILY.
11. Platt RW, Abrahamowicz M, Kramer MS, Joseph KS, Mery L, Blondel B, Bréart G, Wen SW. Detecting and eliminating erroneous gestational ages: a normal mixture model. Stat Med. 2001; 20:3491–3503.
12. Oja H, Koiranen M, Rantakallio P. Fitting mixture models to birth weight data: a case study. Biometrics. 1991; 47:883–897.
13. Cole TJ, Green PJ. Smoothing reference centile curves: the LMS method and penalized likelihood. Stat Med. 1992; 11:1305–1319.
14. Flegal KM. Curve smoothing and transformations in the development of growth curves. Am J Clin Nutr. 1999; 70:163S–5S.
15. Pedreira CE, Pinto FA, Pereira SP, Costa ES. Birth weight patterns by gestational age in Brazil. An Acad Bras Cienc. 2011; 83:619–625.
16. Kramer MS, Platt RW, Wen SW, Joseph KS, Allen A, Abrahamowicz M, Blondel B, Bréart G; Fetal/Infant Health Study Group of the Canadian Perinatal Surveillance System. A new and improved population-based Canadian reference for birth weight for gestational age. Pediatrics. 2001; 108:E35.
17. Min SJ, Luke B, Gillespie B, Min L, Newman RB, Mauldin JG, Witter FR, Salman FA, O'sullivan MJ. Birth weight references for twins. Am J Obstet Gynecol. 2000; 182:1250–1257.
18. Hu IJ, Hsieh CJ, Jeng SF, Wu HC, Chen CY, Chou HC, Tsao PN, Lin SJ, Chen PC, Hsieh WS. Nationwide twin birth weight percentiles by gestational age in Taiwan. Pediatr Neonatol. 2015; 56:294–300.
19. Lee KH. Growth assessment and diagnosis of growth disorders in childhood. J Korean Pediatr Soc. 2003; 46:1171–1177.
20. Lee AC, Mullany LC, Tielsch JM, Katz J, Khatry SK, LeClerq SC, Adhikari RK, Shrestha SR, Darmstadt GL. Risk factors for neonatal mortality due to birth asphyxia in southern Nepal: a prospective, community-based cohort study. Pediatrics. 2008; 121:e1381–90.
21. Osmond C, Barker DJ. Fetal, infant, and childhood growth are predictors of coronary heart disease, diabetes, and hypertension in adult men and women. Environ Health Perspect. 2000; 108:Suppl 3. 545–553.
22. Goldstein H. Factors related to birth weight and perinatal mortality. Br Med Bull. 1981; 37:259–264.
23. Olsen IE, Groveman SA, Lawson ML, Clark RH, Zemel BS. New intrauterine growth curves based on United States data. Pediatrics. 2010; 125:e214–24.
24. Roberts CL, Lancaster PA. National birthweight percentiles by gestational age for twins born in Australia. J Paediatr Child Health. 1999; 35:278–282.
25. Voldner N, Frøslie KF, Godang K, Bollerslev J, Henriksen T. Determinants of birth weight in boys and girls. Hum Ontogenet. 2009; 3:7–12.
26. Bleker OP, Breur W, Huidekoper BL. A study of birth weight, placental weight and mortality of twins as compared to singletons. Br J Obstet Gynaecol. 1979; 86:111–118.
27. Garite TJ, Clark RH, Elliott JP, Thorp JA. Twins and triplets: the effect of plurality and growth on neonatal outcome compared with singleton infants. Am J Obstet Gynecol. 2004; 191:700–707.
28. Kramer MS. Socioeconomic determinants of intrauterine growth retardation. Eur J Clin Nutr. 1998; 52:Suppl 1. S29–32.
29. Lee JH, Hahn MH, Chung SH, Choi YS, Chang JY, Bae CW, Kim YK, Kim HR. Statistic observation of marriages, births, and children in multi-cultural families and policy perspectives in Korea. Korean J Perinatol. 2012; 23:76–86.
30. Kang BH, Moon JY, Chung SH, Choi YS, Lee KS, Chang JY, Bae CW. Birth statistics of high birth weight infants (macrosomia) in Korea. Korean J Pediatr. 2012; 55:280–285.
31. Lim JW. The changing trends in live birth statistics in Korea, 1970 to 2010. Korean J Pediatr. 2011; 54:429–435.
32. Blickstein I. Normal and abnormal growth of multiples. Semin Neonatol. 2002; 7:177–185.
33. Ozturk O, Templeton A. In-vitro fertilisation and risk of multiple pregnancy. Lancet. 2002; 359:232.
34. Imaizumi Y. A comparative study of zygotic twinning and triplet rates in eight countries, 1972-1999. J Biosoc Sci. 2003; 35:287–302.
35. Ananth CV, Chauhan SP. Epidemiology of twinning in developed countries. Semin Perinatol. 2012; 36:156–161.
TOOLS
ORCID iDs

Jin Kyoung Lee
https://orcid.org/http://orcid.org/0000-0001-9552-8446

Hye Lim Jang
https://orcid.org/http://orcid.org/0000-0003-2113-8052

Byung Ho Kang
https://orcid.org/http://orcid.org/0000-0002-1690-7753

Kyung-Suk Lee
https://orcid.org/http://orcid.org/0000-0002-6300-1348

Yong-Sung Choi
https://orcid.org/http://orcid.org/0000-0001-9181-7849

Kye Shik Shim
https://orcid.org/http://orcid.org/0000-0003-4958-9840

Jae Woo Lim
https://orcid.org/http://orcid.org/0000-0003-2001-0727

Chong-Woo Bae
https://orcid.org/http://orcid.org/0000-0002-0965-5674

Sung-Hoon Chung
https://orcid.org/http://orcid.org/0000-0002-0352-9722

Similar articles