

 PDF
PDF ePub
ePub Citation
 Print
Print


INTRODUCTION
Alcohol (ethanol) is one of the oldest and most sought after substances in human history. Alcohol is used for various purposes including medical uses, such as in analgesics, antiseptics, and disinfectants; it also can serve as a relationship buffer in social situations, and as a relaxant to reduce stress and decrease tension. Chemically, alcohol is a single compound, ethyl alcohol, which functions as a central nervous system (CNS) depressant or a psycho-stimulant, depending on the amount of alcohol consumed (12). Acute intake of high doses of alcohol has a depressive effect on the CNS and a conduction delay effect on both central and peripheral nerves that is mediated by gamma aminobutyric acid A (GABA) receptors, glycine receptors and the adenosine system (12345). Low doses of alcohol have a stimulant effect on the CNS via the dopamine pathway (6).
Visual evoked potential (VEP) and electroretinography (ERG) are clinically versatile electro-physiologic measurement techniques. VEP measures the response to visual stimulation that begins at the retina and ends at the visual cortex, whereas ERG reflects the gross retinal condition (78). Multifocal ERG (mfERG) provides an indication of cone photoreceptor-derived central retinal function under light-adapted conditions (89). The acute effects of alcohol on the visual system have previously been evaluated with VEP and ERG (31011121314). However, our study is the first to use multifocal electroretinography (mfERG) to determine the acute effects of ethanol on the retina. Moreover, because previous studies using VEP were performed decades ago (31013), their measurements of pattern-reversal VEP (VEP) were different from those that are currently recommended by the International Society for Clinical Electrophysiology of Vision (ISCEV) standards (7).
In the present study, we aimed to investigate the acute effects of ethanol administration on the retina and visual pathways using mfERG and ISCEV standard VEP (standard protocol except using only one check size).
MATERIALS AND METHODS
Subjects
This prospective study was performed in young, healthy adults older than 25 years between August 10, 2013 and September 11, 2013 at Korea University Ansan Hospital. Fifteen healthy subjects without any ocular or systemic disease were included in the study. Exclusion criteria included prior ocular surgery, ocular disease including cataracts or glaucoma, best corrected visual acuity (BCVA) less than 1.0 (decimal), past medical history of diabetes and hypertension, alcohol-associated liver disease including fatty liver or liver cirrhosis, recent hepatitis (within a few years), hepatitis B or C carrier status, and alcohol-dependent psychotic disorders. After VEP and mfERG were performed on both eyes, one eye from each participant was randomly selected for assessment by a random number generator.
During their first visit, all subjects underwent a comprehensive ocular examination, which included BCVA, intraocular pressure measurement with a pneumatic tonometer (CT-80A, Topcon, Tokyo, Japan), manifest refraction using the Auto Kerato-Refractometer (KR-8100, Topcon), keratometry, anterior chamber depth and axial length measurement with a biometer (IOL MASTER 500, Carl Zeiss Meditec Inc., Jena, Germany), and central retinal thickness measurement with a combination imaging system (OPKO Spectral SLO/OCT, Ophthalmic Technologies Inc., Miami, FL, USA). VEP was recorded before pupil dilation, whereas mfERG was recorded after pupil dilation. Dilated pupil size was measured with the KR-1W wavefront analyzer (Topcon).
During the second visit, subjects were given an alcoholic drink (Soju, 19.5 vol% ethanol; a popular traditional Korean drink) with a meal. The drinks were offered in a measured quantity (0.75 g/kg of body weight) over the course of 30 minutes. VEP was recorded one hour after alcohol consumption, followed by blood sampling. mfERG was recorded after pupil dilation. Blood samples (3 mL) were drawn from the antecubital vein into an EDTA tube for the detection of ethanol. To prevent any alcohol contamination in the blood sample via the disinfection procedure, skin was disinfected using povidone-iodine instead of alcohol wipes. Serum was isolated from the blood samples after centrifugation at 3000 rpm for five minutes. Next, the blood alcohol concentration (BAC) of each sample was determined using a Modular Analytics P analyzer (Roche, Berlin, Germany) and an accompanying diagnostic kit (Ethyl Alcohol; Roche).
Pattern reversal VEP recording
Pattern reversal VEP (VEP) recordings were performed with a Roland-Consult RetiScan® system (Roland-Consult, Brandenburg an der Havel, Germany) according to ISCEV standards (7). Monocular VEPs were recorded with gold-disc surface electrodes. Active electrodes were placed on the scalp over the visual cortex at Oz (mid-occipital position) with the reference electrode at Fz (mid-frontal position). The ground electrode was placed on the forehead. Refraction was corrected with trial lenses before the recordings. Each subject sat in a moderately lit room, 1 meter in front of a 21-inch CRT monitor. The luminance was < 1 cd/m2 for the black checks and 115 cd/m2 for the white checks (contrast: 99%). The responses to 0.25° check were recorded. The background light was dimmed (approximately 20 cd/m2). The reversal rate was one per second, and responses to 100 stimuli were averaged. Subjects were instructed to fixate on a red marker at the center of the screen. The recording was monitored in real-time under the supervision of a retinal specialist. If the cooperation of the subject or fixation stability was poor, the VEP recording was repeated after 5 minutes break. If the recorded signal was suboptimal, the VEP recording was repeated until a satisfactory recording was achieved.
Multifocal ERG recording
The Roland-Consult RetiSCAN System was also used for mfERG. The mfERGs were recorded as described in the ISCEV standard protocol for clinical mfERG, with the exception of the number of stimulus hexagons (19) that were used (8). The participants remained in dim light for at least 15 minutes before the recordings were taken, and pre-test light exposure was avoided. Briefly, pupils were fully dilated with 1% tropicamide and 2.5% phenylephrine, and pupil size was measured. A Burian-Allen contact lens electrode was used as the active electrode. Moderate myopia was fully corrected with glasses for optimal acuity at the viewing distance of 33 cm. Monocular stimulation and monocular recording were performed with the contralateral eye occluded.
The stimulus matrix, which consisted of 19 scaled hexagonal elements (three successive rings from center to periphery), was presented on a high-resolution 21-inch CRT monitor at a frame rate of 75 Hz. The stimulus hexagons were set to modulate between white and black according to a pseudorandom m-sequence (13.3 milli-seconds per frame). The Michelson contrast between white and black hexagons was set to 99%, i.e. the luminance was < 1 cd/m2 for the black hexagons and 115 cd/m2 for the white hexagons. The surrounding background light was dimmed, and a red fixation cross was used. The monitor subtended 38° horizontally and 31° vertically at a viewing distance of 25 cm. The recording was divided into two segments and monitored in real-time under the supervision of a retinal specialist throughout the entire testing period. If the recorded signal was not appropriate or fixation losses were detected, the recording was repeated.
Data analysis
For the VEP, the latency and amplitude of N75, P100, and N135 were measured. For mfERG, the P1 (first positive component) and N1 (first negative component) amplitudes of rings 1, 2, and 3 were measured. The P1 and N1 implicit times of rings 1, 2, and 3 were also measured. Statistical analyses were performed with SPSS software, version 20.0 (IBM, Inc., Armonk, NY, USA). The Wilcoxon signed-rank test (n = 15 eyes) was used to compare the changes in VEP and mfERG after randomized eye selection. Spearman correlation analysis was used to evaluate the correlations between BAC and the changes in VEP and mfERG (delta ratio; 1- [parameter after alcohol administration] / [parameter before alcohol administration]. P values of < 0.05 were considered statistically significant.
Ethics statement
The study protocol was reviewed and approved by the institutional review board of the Korea University Medical Center, Seoul, Korea (#AS13075). Informed consent was submitted by all participating subjects before the investigation. All research and data collection protocols complied with the Declaration of Helsinki.
RESULTS
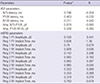
The clinical characteristics of the study subjects are presented in Table 1. A representative case is shown in Fig. 1.
Table 1
Clinical characteristics of participants in this study
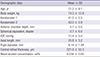
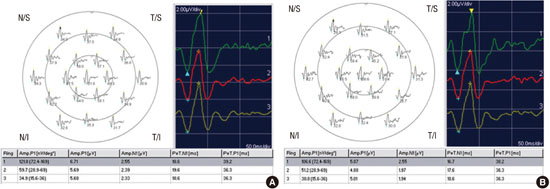
Fig. 1
Representative mfERG recordings before (A) and after (B) alcohol administration. mfERG first-order kernel trace array with 19 elements (left upper row), ring traces from ring 1 to ring 3 (right upper row), P1 and N1 amplitude (Amp.P1 and Amp. N1), and P1 and N1 implicit times (PeT.P1 and PeT.N1) (lower row).
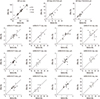
The P100 latency in the VEP increased significantly, from 109.4 ± 5.3 milliseconds (ms) to 113.1 ± 8.2 ms (P = 0.008). However, the P100 amplitude did not change significantly. The N135 amplitude and latency also did not show significant changes (Table 2). There was a trend of the shortening of P1 implicit time of ring 1 on the mfERG after alcohol administration, from 37.9 ± 1.0 ms to 37.2 ± 1.5 ms. However, the changes did not show statistically significance after Bonferroni correction. No significant changes were noted in the other parameters, including the P1 and N1 amplitudes and the N1 implicit time of the three concentric rings (Table 2). Correlation between BAC and the delta ratio of parameters also did not show significant changes (Table 3). Scatter plots of VEP and mfERG parameters before versus after alcohol administration are shown in Fig. 2.
Table 2
Pattern reversal visual evoked potential and multifocal electroretinogram parameters before and after alcohol administration
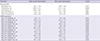
Table 3
Spearman correlation analysis between blood alcohol concentration and delta ratio of each parameter in pattern visual evoked potential and multifocal electroretinogram
R, Spearmann correlation coefficient; VEP, pattern reversal visual evoked potential; N, negative; P, positive; ms, milliseconds; µV, microvolt; mfERG, multifocal electroretinogram.
*Spearmann correlation test.
Delta ratio = 1 - [parameter after alcohol administration]/[parameter before alcohol administration].
Fig. 2
Scatter plot of parameters of VEP and mfERG before versus after alcohol administration. VEP N75, P100, N135 latency, VEP N75-P100, P100-N135 amplitude before versus after alcohol administration (first row). P1 amplitude, P1 implicit time, N1 amplitude and N1 implicit time of mfERG Ring 1 (R1: second row), Ring 2 (R2: third row) and Ring 3 (R3: fourth row).
Alc, alcohol; Lat, latency; Amp, amplitude; Imp, implicit time; R, ring; ms, mili-second; µV, micro-volt.
DISCUSSION
In this study, we analyzed changes in VEP and mfERG after alcohol administration. We found significant delays in the P100 latency of the VEP. In contrast, we found a trend of shortening of the P1 implicit time on mfERG for ring 1, although it was not significant after Bonferroni correction. No changes in amplitude were observed in either VEP or mfERG. Moreover, the changes in VEP and mfERG parameters did not correlate with blood alcohol concentration.
Several previous studies have shown a delay in latency on VEP after alcohol administration in normal participants (31013). Azcona et al. (3) reported decreased amplitude and increased latency in the VEP pattern (BAC, 0–20 mM/L; 0–0.09 vol%), and Rohrbaugh et al. (13) found dose-related delays in late components of VEP along with a decreased amplitude (BAC, 20–80 mg%; 0.02–0.08 vol%). In addition, Colrain et al. (10) reported increased latency of only the late VEP components with increased blood alcohol levels (BAC, 0.016–0.077 vol%). The results of these previous VEP studies are consistent with our finding of increased latency. The changes of VEP could be due to softening of focus after alcohol ingestion. Defocusing has been shown to reduce P1 amplitude, but not to delay the implicit time in mfERG (15). However, the changes by defocusing are different from those obtained in the present study; we propose that ethanol intake likely contributed to these differences.
The N75, P100, and N135 components are generated from the striate cortex (V1) or the extra-striate cortex (1617). Alcohol-induced CNS suppression and nerve conduction delay have been reported to be mediated by GABA, glycine and adenosine (4518). GABA and glycine are the main inhibitory neurotransmitters in the central nervous system (5). Alcohol also increases the level of adenosine, which contributes to the sedative actions of alcohol (5). Furthermore, interactions of alcohol with myelin or the Ca-ATPase pump at the synapses also may explain these changes (19). The increased implicit time of VEP after alcohol administration observed in this study is associated with these inhibitory mechanisms.
The waveform of mfERG is shaped largely by bipolar cell activity, together with a small contribution from photoreceptor cells and the inner (amacrine and ganglion) retinal cells (9). Both bipolar and amacrine cells have GABA receptors (types A, B, and C) and glycine receptors at their axonal endings (2021). Accordingly, the ERG response also could be suppressed directly by GABA (22). In this study, however, it was not determined that the retinal function was inhibited by a GABA-mediated alcohol effect. P1 implicit time of mfERG in this study, showed a trend of shortening. It seemed to be stimulated slightly in contrast to the VEP results, although statistically not significant. Sometimes it is difficult to conclude that shortening of implicit time might be associated with excitatory changes, consider, for instance, the Pattern-ERG (reduced implicit time in pathology): when the spiking activity is suppressed or lost to secondary atrophy, the implicit time reduces for the P50 (23). However, in general reduced implicit time was regarded in previous papers to be associated with stimulant effect (2425), and diminished amplitude or delayed implicit time was regarded to be associated with the pathologic retina (26–28).
We suspect that alcohol dehydrogenase in the retina might be responsible for the potential discrepancy between the mfERG and VEP responses after alcohol intake. The retina has the highest alcohol dehydrogenase activity of all organs, with the exception of the liver (29). The primary function of alcohol dehydrogenase in the retina is to metabolize retinol in the photoreceptors and in the retinal pigment epithelium (29). Additionally, retinal alcohol dehydrogenase also might competitively metabolize alcohol (29). Therefore, the retina is likely to be affected differently by alcohol than are other nerve tissues.
Our study had some limitations. First, the sample size was relatively small. Second, we used 19 hexagons with two recording segments for mfERG instead of 61 hexagons with eight recording segments, as suggested by the ISCEV standard protocol (8). We used the 19-hexagon protocol with the aim of minimizing examinee discomfort and thus avoiding negative effects on the results. Third, full-field ERG was not performed. Moreover, the dose–response relationship of mfERG and VEP were not evaluated in the present study. These data would be useful; however, it takes a long time to perform full-field ERG or dose–responses experiments in a single session, due to the additional adaptation time and multiple protocols that are required. Furthermore, it is difficult to maintain consistently, or to increase in stepwise fashion, blood alcohol concentration over a long period of time. Finally, the measured BAC levels of the participants were variable after alcohol administration. Individual variation in the amount of alcohol dehydrogenase might have contributed to the variable BAC levels (30). Although participants who could not tolerate alcohol were excluded through medical history interview before the study, some participants still could have had aldehyde dehydrogenase deficiency, resulting in a reduced rate of alcohol metabolism. In those people, increased blood acetaldehyde concentration as well as BAC after alcohol ingestion also might have possible neurological effects. Additionally, although participants fasted in the alcohol-EOG response study by Arden and Wolf (31), the food (spicy soup with noodle) was offered in the present study to facilitate alcohol ingestion. The rate of food consumption, and the quantity of food consumed also might affect the BAC levels.
In conclusion, ethanol administration appears to suppress the visual pathway of CNS, however, it is not determined whether alcohol intake affects the retina. Thus, further investigation will be necessary to confirm the results presented in this study. Also, full-field ERG with morphologic testing (e.g., optical coherence tomography) after alcohol ingestion represents another area of scientific and clinical interest that might warrant future investigation.
 XML Download