

 PDF
PDF ePub
ePub Citation
 Print
Print


INTRODUCTION
The main pathophysiology of type 2 diabetes is decreased insulin sensitivity and impaired pancreatic β-cell function (12), which leads to both fasting and postprandial hyperglycemia, contributing to the development of diabetic complications. The importance of postprandial glucose has emerged based on several epidemiological studies reporting a strong association with cardiovascular disease (345). Mechanisms explaining postprandial hyperglycemia in type 2 diabetes include loss of first-phase insulin secretion, decreased insulin sensitivity in peripheral tissues, uninhibited postprandial hepatic glucose output, and lack of postprandial suppression of glucagon secretion (678). Postprandial hyperglycemia is associated with biomarkers of cardiovascular disease, such as oxidative stress (9), carotid intima-media thickness (10) and endothelial dysfunction (1112). Furthermore, postprandial hyperglycemia is also associated with diabetic microangiopathy (13) and cognitive dysfunction (14). Therefore, treatment targeting postprandial hyperglycemia would benefit patients with type 2 diabetes. To curb postprandial hyperglycemia, α-glucosidase inhibitors, short-acting non-sulfonylurea insulin secretagogues, dipeptidyl peptidase-4 (DPP-4) inhibitors, glucagon-like peptide-1 (GLP-1) receptor agonists and short/rapid acting insulin are used in clinical practice (1516).
In addition to medical therapy, diet therapy with dietary fiber-rich foods is also a good strategy to reduce postprandial hyperglycemia in patients with type 2 diabetes. Dietary fiber modulates energy intake by reducing the calorie density of foods, prolonging the chewing time, increasing satiety, and delaying gastric emptying (17). Higher intake of dietary fiber was associated with a reduced odds ratio for obesity in patients with type 2 diabetes (18). In a meta-analysis including 11 randomized-controlled studies examining the glucose-lowering effects of dietary fiber in patients with type 2 diabetes (19), increased intake of dietary fiber reduced HbA1c by -0.55% (95% CI, -0.96 to -0.13) and reduced fasting plasma glucose levels by -9.9 mg/dL (95% CI, -18.2 to -1.8). In addition to its physicochemical properties, dietary fiber may improve hyperglycemia and insulin sensitivity via the action of short-chain fatty acids (SCFAs) produced by bacterial fermentation in the colon (20), which are ligands of GPR41 and GPR43 (21). SCFAs increase GLP-1 secretion through the action of GPR43, which is located in enteroendocrine L-cells (22). GLP-1 is well-known to decrease postprandial glucose levels by enhancing glucose-stimulated insulin secretion, suppressing glucagon secretion, delaying gastric emptying, and increasing satiety (23). Supplementation of fermentable dietary fiber was reported to increase GLP-1 secretion in rodents (17), dogs (24), and humans (2526). In this study, we investigated the short-term effect of dietary fiber on postprandial glucose levels and hormone secretion in patients with type 2 diabetes mellitus by comparing dietary fiber-enriched cereal flakes (DC) and conventional cereal flakes (CC) using a crossover study design.
MATERIALS AND METHODS
Subjects
A total of 15 patients with type 2 diabetes aged between 20 to 65 years with a HbA1c of 6.0% to 8.5% who were treated with lifestyle modification, metformin monotherapy, or both, were recruited. We excluded subjects who were undergoing insulin therapy, had lactose intolerance, had an allergy to flour, grains, nuts or other cereals, and women who were pregnant or lactating. This study was registered at ClinicalTrials.gov (ClinicalTrials. gov identifier: NCT01997281).
Study design and procedure
This study used a randomized, open-labeled cross-over design. The participants were admitted to the Clinical Trials Center at the Seoul National University Hospital twice, with a one week interval. The study schedules in each admission are depicted in Fig. 1. At the screening visit, we performed baseline laboratory blood tests, including fasting plasma glucose, HbA1c, total cholesterol, triglyceride, high-density lipoprotein cholesterol, low-density lipoprotein cholesterol, aspartate aminotransferase, alanine aminotransferase, and creatinine. One week later, the patients who met the eligibility criteria were instructed to visit the research clinic at 4 p.m. without taking any antidiabetic drugs on the day of their visit and were admitted to the Clinical Trials Center (day 1). Blood pressure, pulse rate, height, body weight, waist circumference and hip circumference were checked. During admission, no food other than mineral water and the study meals was allowed, and the participants were asked to avoid physical activities other than for personal sanitation. Randomization was performed using a random number table to decide which cereal (DC or CC) would be served at the first admission. Meals based on cereal (described separately below) were served at 6 p.m. and 10 p.m. on day 1 and 8 a.m. on day 2. Participants were asked to eat each meal within 15 minutes. Before breakfast on day 2, a 22-gauge intravenous catheter was placed in the antecubital vein for blood sampling. Samples were obtained every 30 minutes from 8 a.m. (0 hour) to 4 p.m. (8 hours). At noon (4 hours), subjects were asked to eat a meal comprising a hamburger within 20 minutes. After all study procedures were finished, participants were discharged. After a week, the same procedures were repeated with the other cereal-based test meal.
Study meals
The nutrient details of the meals are shown in Table 1. DC contained 14.7 g of dietary fiber per serving (79 g), and CC, the isocaloric control meal, contained 2.9 g of dietary fiber per serving (80 g). DC was composed of brown rice (35%), whole wheat (15%), barley (10%), dietary fiber from oat (14%), chicory (10%), indigestible maltodextrin (6%), and black beans (10%) (SSial Food Inc., Jecheon, Korea). CC was composed of milled corn (SSial Food Inc.). For dinner on day 1 and breakfast on day 2, one serving of DC or CC was supplied with 300 mL of milk and a steamed egg. For a night snack on day 1, a half serving of DC or CC was provided with 200 mL of milk. A hamburger (Double Cheese Burger purchased from McDonald's) with 250 mL of Coke was served for lunch on day 2.
Laboratory analysis
Blood samples were collected in serum separation tubes (BD Vacutainer® SST™, Becton, Dickinson and Company, Franklin Lakes, NJ, USA) and EDTA tubes (BD Vacutainer®, Becton, Dickinson and Company) containing a DPP-4 inhibitor (10 µL/mL of blood; Millipore, St. Charles, MO, USA), and centrifuged for 10 minutes at 1,500 g for 20 minutes at 4℃. Plasma glucose levels were analyzed using a YSI 2300 STAT Plus analyzer (YSI Inc., Yellow Springs, OH, USA) immediately after centrifugation. The serum and plasma samples were stored at -70℃ until assayed. Non-esterified fatty acids (NEFA) were measured by a colorimetric assay using a Hitachi analyzer (Hitachi, Tokyo, Japan), and the glucagon concentrations were measured by a radioimmunoassay (Siemens, Los Angeles, CA, USA). The concentrations of insulin (Alpco Diagnostics, Salem, NH, USA), total GLP-1 (Alpco Diagnostics), and total GIP (Millipore, Billerica, MA, USA) were measured by enzyme-linked immunosorbent assay (ELISA) according to the manufacturer's instructions. We did not use the ethanol extraction method, and the amount of plasma used was 100 µL each.
Study end-points and sample size calculation
The primary endpoint was the difference between the DC and CC meals in the incremental area under the curve (iAUC) of plasma total GLP-1 levels during the 4 hours after breakfast on day 2 (0 to 4 hours). The secondary endpoints were the differences in the iAUC of plasma GIP, glucose, insulin, and glucagon levels and serum NEFA levels during the 4 hours after breakfast on day 2 (0 to 4 hours). The iAUCs of these parameters during the 4 hours after lunch on day 2 (4 to 8 hours) were also included as secondary endpoints.
The sample size was calculated based on the previously reported iAUC for total GLP-1 levels (27), assuming a difference of 70 mM·min/L between the two groups and a standard deviation (SD) of 82 mM·min/L, with a power of 80% and an alpha of 0.05. Accordingly, the number of required participants was 13.
Statistical analysis
The baseline characteristics are shown as the mean±SD. Serially measured continuous variables are presented as the mean ±SEM. Data were separately analyzed according to the time period (0 to 4 hours and 4 to 8 hours). Postprandial time course data were analyzed by repeated measures two-way ANOVA. The iAUCs were calculated by the trapezoid method and compared between the two groups by a non-parametric t-test. Spearman correlation analyses among the variables were performed within each cereal group. Statistical significance was assumed if P<0.05. All statistical analyses were performed using Prism GraphPad version 5.0 (GraphPad, San Diego, CA, USA).
RESULTS
Baseline characteristics
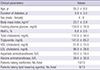
Among 15 screened subjects, 13 completed the study, one patient was excluded due to a low HbA1c value and one withdrew consent. The mean age of the 13 participants was 55.2±8.0 years, and the mean duration of diabetes was 5.8±3.4 years. Body mass index was 23.7±2.9 kg/m2, and HbA1c was 6.8±0.5%. Additional baseline fasting values of the laboratory tests are presented in Table 2. None had a history of gastrointestinal surgeries.
Plasma glucose and serum NEFA levels
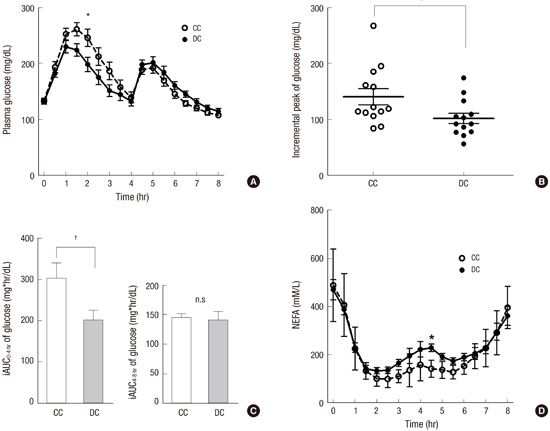
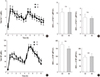
The plasma glucose concentrations at baseline (0 hour) were not different between the two visits. After breakfast, plasma glucose levels were lower with DC than with CC until lunch (Fig. 2A), and a significant difference was found at 2 hours by two-way repeated measures ANOVA (198.5±12.8 mg/dL vs. 245.9±15.2 mg/dL, P<0.05). The peak increment of the plasma glucose level was lower with DC than with CC (101.8±9.1 mg/dL vs. 140.3±14.3 mg/dL, P<0.001, Fig. 2B). The iAUC of 0 to 4 hours was also lower with DC than with CC (202.0±23.9 mg·hr/mL vs. 301.1±37.7 mg·hr/mL, P<0.001, Fig. 2C). Immediately before lunch at 4 hours, the plasma glucose levels in both groups showed no difference (P=0.13). After lunch, the plasma glucose levels increased, with a peak at 5 hours, but with no difference between the two groups. The iAUCs during 4-8 hours were not different between the DC and CC groups (141.0±14.4 mg·hr/mL vs. 143.7±8.4 mg·hr/mL, P=0.79, Fig. 2C).
Fasting serum NEFA levels were elevated in both groups and decreased after eating breakfast, reaching the lowest value at 2 hours (Fig. 2D). Thereafter, NEFA levels gradually increased until 4 hours. After lunch, the serum NEFA levels slightly decreased and then increased again until 8 hours. No difference in the serum NEFA levels was found between the DC and CC groups, except at 4.5 hours, with a higher level in the DC group (228.2±16.0 mM/L vs. 141.4±9.8 mM/L, P<0.05). The iAUCs of the serum NEFA levels during the study were not different between the two groups (data not shown).
Plasma hormone levels
In comparing the DC group to the CC group, the insulin levels at each time point (Fig. 3A) and iAUCs of both 0-4 hours and 4-8 hours were not different (Fig. 3B). The levels of glucagon with DC tended to be higher than those with CC during the 5 hours after breakfast, but the difference was not significant (Fig. 3C). The iAUCs of glucagon were not different between the DC and CC groups (Fig. 3D).
Plasma total GLP-1 increased to the peak level (2.0±0.5 to 6.0±0.8 pM/L with DC and 1.7±0.6 to 5.5±0.5 pM/L with CC) at 0.5 hours after breakfast (Fig. 4A). The levels during the time-course and iAUCs of GLP-1 with DC did not show significant differences compared to those with CC (Fig. 4A, B). Neither the plasma GIP levels, which showed a peak at 5.5 hours (1.5 hours after high-fat meal for lunch, Fig. 4C), nor iAUC of GIP (Fig. 4D) demonstrated significant differences between the DC and CC groups.
DISCUSSION
This study aimed to evaluate the acute effects of two isocaloric test meals (DC and CC) based on cereal flakes with different dietary fiber contents on GLP-1 secretion in patients with type 2 diabetes. The intake of DC did not change the postprandial plasma levels of GLP-1 or GIP, although it decreased the postprandial plasma glucose levels compared to CC. This glucose-lowering effect of DC was not accompanied by changes in the postprandial plasma levels of insulin and glucagon and did not persist in the next meal, which had a high fat content.
The post-breakfast plasma glucose levels were lower with DC than with CC, which indicates that DC has a lower glycemic index than CC. The glycemic index of a food is determined primarily by the nature of the carbohydrate (28). In previous studies, acute administration of dietary fiber to healthy subjects showed inconsistent results on glycemia. Waxy maize starch drink (29), resistant starch-enriched rice (30), rye product (31), and other viscous dietary fibers (32) improved post-challenge hyperglycemia, whereas psyllium-enriched pasta (33) and resistant starch-enriched mousse with a standard meal (34) failed to decrease the postprandial plasma glucose levels. All of the previous studies cited above did not provide a study meal in the evening before the study procedures. With dietary fiber remaining in the intestine overnight, bacterial fermentation may have led to the production of SCFAs, which are known to enhance GLP-1 secretion from enteroendocrine L-cells (3536). In this study, however, the GLP-1 levels were not different between the DC and CC groups. Various types of dietary fiber and various study populations might affect the divergent glycemic responses to dietary fiber-enriched study meals.
In contrast to the post-breakfast glucose levels, the plasma glucose levels after eating a high-fat lunch were similar between the DC and CC groups. In a study (35), however, prior consumption of resistant starch (total 60 g) reduced the plasma glucose and insulin levels after a mixed meal. Additionally, in another study examining the effect of indigestible carbohydrate in barley kernels, participants ate boiled barley kernels (22.3 g of dietary fiber) or white wheat bread (4.12 g of dietary fiber) for dinner and had ad libitum standardized breakfast and lunch meals on the next day (36). Although there was no difference in energy intake between the two groups, the post-breakfast glucose levels were lower with boiled barley kernels than with white wheat bread (36). Increased bacterial fermentation of dietary fiber was shown by breath H2 analysis in the two studies (3536). The discrepancy between the current study and the two previous studies (3536) might be explained by the amount of dietary fiber (with much higher amount in the previous studies) and the study populations (healthy people in the previous studies and patients with type 2 diabetes in the present study). Further studies are necessary to examine the effect of various amounts of dietary fiber and varying metabolic status on postmeal glucose levels.
Increased circulating NEFA levels are causally linked to insulin resistance (37). High and low glycemic index diets may have differential effects on late postprandial (i.e., 4-6 hours after a meal) circulating NEFA levels with a higher level after a high glycemic index meal (38). Therefore, the divergent NEFA responses after DC and CC intake in the morning may affect the postprandial glucose metabolism after lunch. However, there was no significant difference in post-breakfast serum NEFA levels in this study, which might be due to lack of remarkable difference in glycemic index between DC and CC.
In this study, lower post-breakfast plasma glucose levels were not accompanied by a change in the plasma insulin or glucagon levels. In a previous study, intake of boiled barley kernels in the evening before the study day did not change the postprandial plasma insulin levels compared to white wheat bread, although the plasma glucose levels decreased with boiled barley kernels (36). Consumption of a large amount of resistant starch decreased both the postprandial plasma glucose and insulin levels (35), which may indicate insulin sensitivity was improved after intake of resistant starch. Indeed, the daily intake of 30 g of resistant starch for 4 weeks improved insulin sensitivity as measured by a euglycemic-hyperinsulinemic clamp in healthy adults (39). In contrast, a study in overweight subjects reported that 4 weeks of resistant starch consumption improved beta-cell function assessed by the first-phase insulin secretion but did not improve insulin sensitivity (40). Taken together, reduced postprandial glucose levels after the intake of dietary fiber-rich meals were not necessarily accompanied by increased insulin secretion, and the mechanism involved appears to be complex.
Previous studies on the acute effect of dietary fiber-enriched meals on GLP-1 secretion have also shown inconsistent results. When a diet with high fermentable dietary fiber was provided to healthy dogs for 14 days, the AUC of the plasma GLP-1 levels during OGTTs was increased and the AUC of the plasma glucose levels during OGTTs was decreased compared to that with low fermentable fiber (24). Rats fed with a resistant starch diet for 10 days showed significantly increased plasma GLP-1 levels, which were measured every 4 hours over 1 day (17). In human studies, the time of intake, composition of meals, and metabolic condition of the subjects may affect the plasma GLP-1 responses. After eating a dietary fiber-enriched meal, the subjects exhibited a lower peak concentration of GLP-1 (33) or a lower iAUC of GLP-1 (34). In a study with resistant starch-containing jelly in the evening prior to the study day, the level of GLP-1 during a mixed meal tolerance test was not changed despite positive breath H2 tests (35). However, intake of boiled barley kernels in the evening before the study day presented significantly increased plasma GLP-1 levels at fasting and after a study meal (36). Adding psyllium to pasta did not increase the plasma GLP-1 or glucose levels, whereas adding oil and propionate to psyllium-containing pasta significantly increased the GLP-1 levels and improved postprandial hyperglycemia (33), which indicates that nutrients, such as lipids, may be involved in stimulating GLP-1 secretion.
There are some limitations in this study. This study examined only the acute effect of DC intake on glycemia and hormone secretion. Whether DC improves long-term glycemia in patients with type 2 diabetes needs to be tested in a future study. The lower postprandial glucose levels with DC compared to CC could be ascribed to delayed gastric emptying. However, we did not measure the gastric emptying rate in this study. Additionally, food-microbiota interactions may affect the host's response related to glycemia and hormone secretion after DC or CC intake, which needs to be determined in future studies.
In conclusion, postprandial glucose levels after consuming DC was lower than after consuming CC in patients with type 2 diabetes with tolerable adverse events, which was not associated with changes in the plasma insulin, glucagon, GLP-1, and GIP levels. Randomized controlled trials are necessary to examine the long-term effect of DC in patients with type 2 diabetes.

 XML Download