

 PDF
PDF ePub
ePub Citation
 Print
Print


INTRODUCTION
The elderly population is rapidly growing, and traumatic injury of geriatric individuals is a significant problem for the health care systems of most advanced countries (1). Elderly patients experience traumatic injuries as drivers or passengers in motor vehicles, as pedestrians being struck by motor vehicles, by falling from a height, and from crushing (234). Elderly trauma patients usually have co-morbidities so the complications and the long-term mortality of traumatic injury is greater for elderly individuals than for young individuals (5).
Previous studies have used several methodologies to assess the severity and predict the mortality of patients with traumatic injuries. However, many of these scoring tools are inconvenient for initial use in an emergency department (ED) because the calculations are complex or because detailed clinical and laboratory information is required (67). The shock index (SI), calculated as heart rate (HR) divided by systolic blood pressure (SBP), is a measure of hemodynamic stability that is useful in predicting mortality and injury severity in trauma patients (89101112). The SI is superior to heart rate and systolic blood pressure alone in predicting mortality in geriatric trauma patients (1314).
The SI is easy to calculate, but its accuracy for geriatric populations is controversial. Previous research suggested that SI multiplied by age (Age SI) is a better predictor of mortality following traumatic injury of an elderly patient (15). Another investigator proposed use of the modified shock index (MSI), the ratio of heart rate to mean blood pressure, as a more accurate predictor than systolic blood pressure, heart rate, and SI (1617). However SI, MSI, and Age SI were developed and validated for different populations (111213). In the present study, we assessed the predictive power of the SI, MSI, and Age SI in geriatric patients using a single large nationwide trauma database.
The aim of this study was to validate the power of the SI, MSI, and Age SI in prediction of mortality in geriatric trauma patients.
MATERIALS AND METHODS
Study design
This study is a retrospective analysis that used the Emergency Department-based Injury In-depth Surveillance (EDIIS) database of Korea. The EDIIS is a nationwide injury database that includes all injured patients admitted to EDs across Korea. The Korea Centers for Disease Control and Prevention (KCDC) developed and operates the EDIIS.
Study setting
Twenty tertiary academic hospital EDs provide data to the EDIIS database of all injured patients who were admitted to their EDs. The EDIIS database has demographic information, injury prevention and epidemiologic information, prehospital procedures, initial clinical findings at the ED, diagnosis (coded by ICD-10), treatment in the ED, ED disposition, and patient outcome after admission (18). Primary information was acquired by physicians of each institution during their clinical practice and by trained coordinators of the EDIIS project who were assigned to each hospital. The coordinators collected the data from the standardized registry. The data of each ED were entered into a web-based database of the KCDC and a quality improvement program was conducted regularly.
Selection of participants
We included injured patients aged 65 years or older among all cases registered in the EDIIS database from January 2008 to December 2013. We excluded patients who were dead upon arrival at the ED, who had isolated traumatic brain injury, and who had non-traumatic injuries such as a burn, drowning, or drug intoxication. We also excluded patients if the injury occurred more than 6 hours before arrival at the ED. Patients without data on vital parameters (HR, SBP, or DBP) and time parameters were also excluded.
Variables and measurements
We calculated the SI, MSI, and Age SI using vital signs initially measured at the ED. For each indicator, we defined the different cut-off values of hemodynamic instability according to previous research (131517). Hemodynamic instability was defined as an SI equal to or greater than 1, an MSI equal to or greater than 1.3, and an Age SI equal to or greater than 50.
We abstracted the following data from the EDIIS database for analysis: demographics, insurance, initial vital signs measured at the ED, use of an emergency medical service (EMS), intention of injury, mechanisms of injury, mentality according to the Alert-Voice-Pain-Unresponsive (AVPU) classification, operative intervention, in-hospital mortality and ED mortality.
Outcome measures
The primary outcome was the percentage of hemodynamically unstable geriatric trauma patients, categorized by cut-off values for the 3 indexes, among survivors and non-survivors. The secondary outcome was the statistical power of the SI, MSI, and Age SI for predicting mortality of geriatric patients. We measured the area under the receiver operating characteristic curve (AUROC) for the SI, MSI, and Age SI by a binary model and a continuous model.
Statistical analysis
We performed descriptive analysis using medians and interquartile ranges for parameters with non-normal distributions. We compared variables using the Wilcoxon rank sum test for continuous variables and the χ2 test for categorical variables. P values were based on a two-sided significance level of 0.05. We calculated AUROC curves to assess the predictive power of the 3 scoring systems by use of a binary model (using cut-off values for each system) and by a continuous model using numerical values for each system. We also conducted sensitivity analyses to calculate the values of each system that provided the best cut-off (SI and MSI by 0.1 unit, Age SI by 1 unit). SAS version 9.4 (SAS Institute Inc., Cary, NC, USA) was used for statistical analysis.
RESULTS
Fig. 1 shows the procedure used to select geriatric trauma patients. During the study period, 1,179,175 trauma cases were registered in the EDIIS database and 111,431 (9.4%) of these cases were geriatric patients. Based on our inclusion criteria, we ultimately enrolled 45,880 cases for analysis (Fig. 1).
Fig. 1
Criteria used to select the study population of geriatric patients with traumatic injuries.
ER = emergency room.
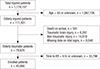
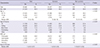
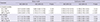
Table 1 compares the demographics and injury epidemiology of survivors and non-survivors. Segregation of patients into 3 age groups (> 85, 75–84, and 65–74 years-old) indicated significantly greater mortality in patients who were older. Cases who had traffic accidents and who used an EMS were more likely to have died, and the time from injury to ER arrival was longer in cases who died.
Table 1
Demographics and injury epidemiology of survivors and non-survivors
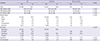
We also assessed the clinical characteristics of survivors and non-survivors (Table 2). The results show the non-survivors had lower SBP, lower DBP, higher heart rate, poorer mental status, and were more likely to be admitted to the ED, given an operation, and admitted to the ICU.
Table 2
Clinical parameters and ED disposition of survivors and non-survivors
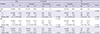
We determined the median values of each index for survivors and non-survivors (Table 3). The results of in-hospital group indicate the non-survivors had a greater median SI (0.84 vs. 0.57, P < 0.001), MSI (1.14 vs. 0.79, P < 0.001), and Age SI (64.0 vs. 41.5, P < 0.001), which of ED group indicate the non-survivors had a greater SI (1.05 vs. 0.57, P < 0.001), MSI (1.40 vs. 0.79, P < 0.001), and Age SI (80.0 vs. 41.5, P < 0.001). We also compared percentage of hemodynamically unstable cases defined by each system among survivors and non-survivors. The percentage of cases classified as unstable were significantly more likely to be non-survivors according to the SI (36.6% vs. 1.8% of in-hospital group, 56.1% vs. 0.9% of ED group), the MSI (38.6% vs. 2.2% of in-hospital group, 58.2% vs. 1.2% of ED group) and the Age SI (69.4% vs. 21.3% of in-hospital group, 83.1% vs. 18.8% of ED group) (Table 3).
Table 3
Percentage of survivors and non-survivors who were classified as stable and unstable according to the SI, MSI, and Age SI
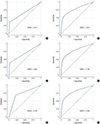
Finally, we compared the AUROC of each index for prediction of in-hospital and ED mortality (Table 4, Fig. 2). Age SI showed higher predictive power for in-hospital mortality than SI (Binary model: 0.740 vs. 0.674, P < 0.001, Continuous model: 0.808 vs. 0.786, P < 0.001). Age SI also showed higher power than MSI (Binary model: 0.740 vs. 0.682, P < 0.001, Continuous model: 0.808 vs. 0.786, P < 0.001). For ED mortality, Age SI showed better prediction than SI (Binary model: 0.807 vs. 0.771, P = 0.024, Continuous model: 0.890 vs. 0.880, P = 0.039).
Table 4
Predictive power of the SI, MSI, and Age SI for in-hospital mortality and ED mortality based on a binary model and a continuous model
DISCUSSION
In the present study, we validated the SI, MSI and Age SI in predicting the mortality of geriatric trauma patients using a single nationwide injury surveillance system from 20 tertiary EDs across Korea. All of the indexes had higher values for non-survivors than survivors. The percentage of unstable patients who died was 36.6% based on the SI, 38.6% based on the MSI, and 69.4% based on the Age SI. The AUROC curve for in-hospital mortality was 0.674 for the SI, 0.682 for the MSI, and 0.740 for the Age SI. Predictive power for in-hospital mortality of Age SI in both models was higher than SI or MSI. Previous studies developed or validated these indexes for different study populations and used different definitions of “elderly” or “geriatric” (1315192021). Our investigation validated each parameter using a single trauma database and we defined “geriatric” as being older than 65 years.
To analyze the prediction of early mortality, we analyzed the ED patients except for hospitalized patients. The AUROC curve for ED mortality was 0.771 for the SI, 0.779 for the MSI, and 0.807 for the Age SI in binary model, which were higher than the AUROC curve for in-hospital patients (Table 4). We estimated that the SI, MSI, Age SI were more effective in the early mortality prediction.
We determined the percentage of hemodynamically unstable patients among survivors and non-survivors based on cut-off values for each index that were used in previous studies (13151722). Among the 45,880 enrolled cases, 2.2% of cases were unstable defined by an SI of 1 or more and 2.7% of cases were unstable defined by an MSI of 1.3; but 21.9% of cases were unstable defined by an Age SI of 50 or more. Thus, for patients older than 65 years, use of the Age SI cut-off value of 50 overestimated severity of the trauma. In other words, in very elderly geriatric patients, the age component in the Age SI formula led to a large increase in the number of patients classified as hemodynamically unstable. We calculated the AUROC of the Age SI according to the age group. The AUROC of Age SI predicting ED mortality was 0.816 (95% CI, 0.773–0.860) for age from 65 to 74, and 0.779 (95% CI, 0.738–0.821) for age from 75 to 84, and 0.744 (95% CI, 0.707–0.782) for age over 85 in binary model. In continuous model, the AUROC of Age SI for each 65–74, 85–84 and 85– aged group was 0.876 (0.824–0.927), 0.882 (0.828–0.926) and 0.909 (0.857–0.962), respectively.
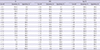
We also performed sensitivity analyses in predicting mortality for each index. In these analyses, the SI ranged from 0.1 to 2.0 (by 0.1 unit), the MSI ranged from 0.4 to 2.3 (by 0.1 unit), and the Age SI ranged from 41 to 60 (by 1.0 unit) (Table 5). If we consider the sum of sensitivity and specificity to indicate the best model, then the SI was maximized with a cut-off at 0.7 (sensitivity, 70.0%; specificity, 73.6%), the MSI with a cut-off at 0.8 (sensitivity, 55.9%; specificity, 90.9%), and the Age SI with a cut-off at 49 (sensitivity, 73.0%; specificity, 74.9%). If we consider mean sensitivity and specificity, then the cut-off values are 0.8 for the SI, 0.9 for the MSI, and 55 for the Age SI. Comparing the cut-off value of each index using the same methodology of previous research such as sum or mean value of sensitivity and specificity, there was a difference of the value between our study and previous research (13141517). The difference could be observed due to the difference of study population or different inclusion criteria of the database used for each study.
Table 5
Sensitivity analysis of SI, MSI, and Age SI for predicting in-hospital mortality
This study had several limitations. First, this was a retrospective analysis. Second, we did not measure exact time profile from injury occurrence to mortality. Shock index is effective to predict short term mortality. But predictive power of shock index for long term mortality is controversial. To conduct robust assessment of predictive power of shock index, measuring time from injury to mortality is required. But the database used in the study did not collect time profile of mortality. Instead of exact time profile, we assessed predictive power of shock index for mortality during ED stay and total in-hospital period, respectively. Third, we could not assess the effect of anti-hypertensive drug medication (such as beta blockers) on the validity of the SI because the EDIIS did have this information. To overcome this limitation, collection of information about drug use was required, but in the emergency clinical settings where geriatric trauma patients are managed, the SI was used regardless of whether information about medication use was available.
In conclusion, we assessed the statistical power of the SI, MSI, and Age SI for predicting the mortality of geriatric trauma patients using a large nationwide database. As expected, each index classified more non-survivors than survivors as hemodynamically unstable. The AUROC curve for predicting mortality was 0.674 for the SI, 0.682 for the MSI, and 0.740 for the Age SI in binary models. The Age SI showed better predictive power of in-hospital mortality than SI or MSI in geriatric trauma patients visited emergency departments.
 XML Download