

 PDF
PDF ePub
ePub Citation
 Print
Print


INTRODUCTION
Vitamin D insufficiency is emerging as a global health problem (1), and a high proportion of Koreans are suffering from this condition. According to the Korea National Health and Nutrition Examination Survey 2008, the prevalence of vitamin D insufficiency, defined as a serum 25-hydroxyvitamin D [25(OH) D] level below 20 ng/mL, was 47.3% in men and 64.5% in women (2). Contrary to the common belief that vitamin D insufficiency is more prevalent in the elderly population, young adults in their 20s had both the lowest 25(OH)D levels and the highest prevalence of 25(OH)D insufficiency (65.0% in men and 79.9% in women) among all age groups in Korea (23). National surveys conducted in Canada (4) and the United Kingdom (UK) (5) revealed similar patterns of a high prevalence of vitamin D insufficiency in young adults. In Canada, young adults aged 20 to 39 yr had the lowest mean serum 25(OH)D levels (65 nM/L) and the highest prevalence of vitamin D deficiency (< 27.5 nM/L) among all age groups (4). Likewise, the prevalence of low vitamin D status in the UK during 1992-2001 was the highest in young adults aged 19 to 24 yr among the non-Asian community dwelling population, with a range of 20%-40% (5). These data imply that vitamin D insufficiency is an important health concern among young adults in many countries (2).
Vitamin D is critical to bone mineral metabolism. Severe vitamin D deficiency is associated with rickets in children and osteomalacia in adults (1). Recent studies reveal that mild vitamin D deficiency increases parathyroid hormone levels and may also deteriorate bone health (16). Furthermore, accumulating evidence suggests that vitamin D plays beneficial roles in cancer, cardiovascular diseases, diabetes, pregnancy complications, infections, and mortality (78910). Even when we take only bone health into consideration, among many aspects of vitamin D-related health outcomes, a sufficient level of vitamin D is crucial in young adulthood. Peak bone mass is achieved between the ages of 18 and 25 (11), and individuals who have higher peak bone mass at these ages are less likely to develop osteoporosis later in life (11).
Nonetheless, the causes of high prevalence of vitamin D insufficiency among young adults are not clear. The established risk factors for low vitamin D status include limited sun exposure, low intake of vitamin D-rich foods, and obesity (1213). Presumably, behavioral factors such as indoor lifestyle, sunscreen use, or unfavorable dietary habits in young adulthood may partly contribute to low vitamin D status (14). In fact, high education levels and indoor occupations were associated with low vitamin D status in the Korean population as well as in a pooled cohort of multiple countries (231315). Few studies, however, have been undertaken on the correlates of vitamin D levels in young adults. Information on potentially modifiable determinants of vitamin D status in this age group may help the effort to develop promising interventions to achieve optimal vitamin D status. We aimed to: (i) evaluate vitamin D status in a large group of university students aged 18-29 yr in Seoul, South Korea; and (ii) investigate the associations between serum 25(OH)D levels and broad-ranges of sociodemographic, lifestyle, and dietary factors.
MATERIALS AND METHODS
Study population
The present cross-sectional study was based on health check-up data from healthy male and female students of a university in Seoul (latitude 37°N), South Korea during 3 weeks in April and May 2013. The health check-up consisted of a comprehensive health examination and self-administered questionnaires. Health examination data were obtained with standardized methods using the same equipment for all measurements in a single medical center on a campus.
A total of 4,390 students participated in the health check-up. For our purposes, we excluded students aged less than 18 or more than 30 yr (n=195), those who did not have a valid serum 25(OH)D measurement (n=17), those who did not complete questionnaires (n=319), and individuals who did not give consent to participate in the study (n=231). We also excluded non-Korean students (n=178) because of the differences in race. After this exclusion, 3,450 participants remained for the current analysis.
Data collection
Anthropometry
All anthropometric measurements were performed by trained staff. Weight and height were measured in light clothing without shoes. Body mass index (BMI) was calculated as weight in kilograms divided by the square of height in meters (kg/m2). Standard BMI cut-points for the Korean population (16) were used to categorize weight status: underweight (<18.5 kg/m2), normal (18.5-22.9 kg/m2), overweight (23-24.9 kg/m2), and obese (≥25.0 kg/m2). Waist circumference was measured in centimeters using an un-stretched measuring tape placed around the midpoints between the lowest rib margin and the uppermost borders of the iliac crest at the end of a normal expiration. According to the Korean abdominal obesity cut-points (90 cm in men, 85 cm in women), waist circumference was dichotomized into normal and abdominal obesity (17).
Covariates
Participants completed a web-based self-administered questionnaire on sociodemographic, lifestyle, and dietary factors. Sociodemographic factors included age, sex, academic status (undergraduate, master's course, or doctoral course), hometown (Seoul, urban, rural, or foreign country), residence and marital status (living with parents, boarding oneself, dormitory, married and living with a partner, or others), parents' education levels, and household income.
Lifestyle factors included physical activity (low/moderate/high), sedentary time, duration of sunlight exposure, use of sun-blocking products or protective long sleeved clothing (yes/no), alcohol consumption (none/moderate/heavy), and smoking status (none/past/current). Physical activity [metabolic equivalent (MET)-minutes/week] was assessed using the Short Version of the International Physical Activity Questionnaire (18). Highly active individuals were those who practiced a) vigorous activity on at least 3 days/week and a total physical activity at least 1,500 MET-minutes/week or b) total physical activity at least 3,000 MET-minutes/week. Moderately active individuals were those who practiced a) vigorous activities at least 20 min/day on at least 3 days/week or b) moderate activities or walking at least 30 min/day at least 5 days/week and whose total activity levels were lower than highly active individuals. Sedentary time included time spent sitting at a desk, chatting in a cafe, reading, traveling on a bus, and watching television on weekdays, and was categorized into quartiles. To assess sunlight exposure, the following question was asked: "How much exposure to sunlight did you have outdoors on average in a day (e.g., outdoor walking or exercise, moving around classrooms during daytime)?" and duration of sunlight exposure was dichotomized into <30 min/day and ≥30 min/day. To assess sun-avoidance habits, participants were asked "Do you wear sunscreen, a brimmed hat, or long sleeves to avoid sunlight exposure? (yes/no)" Heavy drinking was defined as consuming ≥14 drinks/week in men and ≥7 drinks/week in women, and moderate drinking was defined as less than these amounts.
Participants provided information on dietary habits, including breakfast eating (days/week), average meal frequencies per day, and use of vitamin D-containing supplements (vitamin D as single-ingredient or combined with calcium) or multivitamin. A brief qualitative food frequency questionnaire (FFQ) with 8 food items was used to assess usual dietary intake over the preceding year. Although there is no valid vitamin D database in Korea, consumption frequencies of fatty fish (mackerel, saury, tuna, or salmon) and dairy (milk, yogurt) were asked because both are major food sources of vitamin D in the Korean population (19). In addition, fruit and vegetable intake frequencies were asked as proxies for an overall healthy diet; high-fat or processed meat, instant noodle, refined carbohydrates, and sugar-sweetened beverage (SSB) intake frequencies were asked as proxies for unhealthy diet. Consumption frequency was classified into 9 categories ranging from less than once a month to 3 or more times per day.
Measurement of serum 25(OH)D levels
Serum 25(OH)D is considered the best indicator of vitamin D status in the body because it has a relatively long half-life (approximately 3 weeks), is unregulated by a homeostatic system in the body, and accounts for multiple determinants (e.g., sun exposure, skin pigmentation, and dietary intake) (20). Participants were asked to fast for at least 12 hr, whereupon venous blood samples were drawn for 25(OH)D analyses. Blood samples were immediately centrifuged, and then sent to Green Cross Reference Laboratory, Inc. (Yongin, Korea) within 6 hr of blood draw. Serum 25(OH)D levels were measured using chemiluminescent immunoassay (CLIA, LIASON 25-OH Vitamin D Total Assay; DiaSorin Inc., Stillwater, MN, USA). Intra-assay coefficient of variation (CV) was 2.8%, and interassay CV ranged from 3.0% to 3.6%. The lower limit of detection was 4 ng/mL. The quality of the method was evaluated using the Vitamin D External Quality Assessment Scheme and the National Institute of Standards and Technology vitamin D metabolites quality assurance program.
Statistical analysis
The distribution of serum 25(OH)D levels was demonstrated as a histogram. Descriptive statistics (frequencies, means, and standard deviations) were used to estimate serum 25(OH)D levels by subgroups.
To identify independent determinants of circulating 25(OH)D levels, backward linear regression by the maximum likelihood method was used allowing only variables with a P value <0.05 for at least 1 category to remain in the model. In the final model, all significant (P<0.05) variables from earlier models remained to simultaneously adjust for other variables. As the distribution of serum 25(OH) was skewed, it was log-transformed prior to linear regression. The log-transformed and untransformed model results were similar; therefore, to ease interpretation, only the untransformed 25(OH)D results are presented.
We calculated multivariable-adjusted mean serum 25(OH)D levels by categories of the independent variables via PROC GLM after adjustment for all covariates in the final linear model. Tests for trend were conducted by assigning an ordinal variable to each category of independent variables and modeling this value as a continuous variable in regression models. All P values were two-sided, and P<0.05 was considered statistically significant. Statistical tests were performed using SAS software, version 9.4 (SAS Institute, Cary, NC, USA). Figures were created using STATA version 12.0 (Stata Corp., College Station, TX, USA).
RESULTS
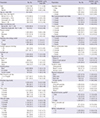
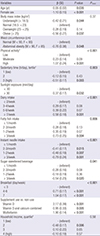
Table 1 presents participants' characteristics and unadjusted mean serum 25(OH)D levels by subgroups. A total of 3,450 participants (1,768 men and 1,682 women) were included in analyses, and their mean age was 22.5 yr. The mean serum 25 (OH)D levels were higher in men (11.6±4.2 ng/mL) than in women (10.7±4.0 ng/mL). Participants who reported using vitamin D supplements was 3.6%, and those who reported using combined vitamin D and calcium supplements was 4.9%.
Vitamin D status among study participants
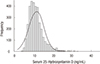
Fig. 1 illustrates the distribution of serum 25(OH)D concentrations among participants. Serum 25(OH)D levels showed a relatively skewed distribution (median 10.4 ng/mL, mean 11.1 ng/mL). With respect to the vitamin D status, 44.7% of students (39.5% in men, 50.2% in women) had serum 25(OH)D levels <10 ng/mL, while only 3.8% had serum 25(OH)D levels ≥20 ng/mL (Table 2).
Correlates of serum 25(OH)D levels
In the final multivariable linear model, variables positively associated with serum 25(OH)D levels were older age, male sex, increased physical activity, sunlight exposure ≥30 min/day, dairy and fatty fish consumption, eating breakfast regularly, and use of vitamin D-containing supplements. In contrast, variables inversely associated with serum 25(OH)D were female sex, underweight (BMI <18.5 kg/m2) or obesity (BMI ≥25 kg/m2), abdominal obesity, long sedentary time, and frequent consumption of instant noodles and SSBs (Table 3). We found no interactions by sex for any significant correlates. The final linear model explained 17% of the overall variance in serum 25(OH)D levels.
The multivariable-adjusted mean serum 25(OH)D levels were higher in men than in women by 1.1 ng/mL (P<0.001; Fig. 2). Compared with normal-weight individuals, those who were underweight (mean difference -0.42 ng/mL, P=0.044) or obese (mean difference -0.56 ng/mL, P=0.037) had significantly lower serum 25(OH)D levels. Likewise, individuals who were centrally obese had significantly lower 25(OH)D levels (mean difference -0.76 ng/mL, P=0.048). Students in the high level of physical activity had higher mean serum 25(OH)D levels than those in the low level by 1.07 ng/mL (P<0.001), and the positive linear trend was significant (Ptrend<0.001). When we entered total physical activity as a continuous variable, a similar positive association was observed (beta coefficient: 0.2 per 1,000 MET-minutes/week, P<0.001). Individuals who spent more time in sedentary activities tended to have lower serum 25(OH)D levels (Ptrend=0.003), and this inverse association was independent of physical activity level, duration of sunlight exposure, and other covariables.
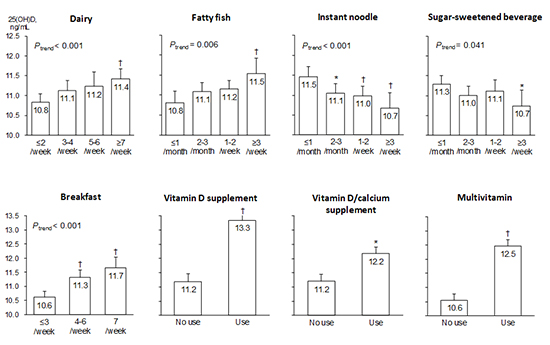
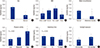
Among dietary factors, frequent consumption of dairy and fatty fish-major dietary sources of vitamin D-were associated with higher serum 25(OH)D levels (Ptrend<0.001, 0.006, respectively; Fig. 3). Interestingly, frequent consumption of instant noodles and SSBs were significantly associated with lower serum 25(OH)D levels (Ptrend<0.001, 0.041, respectively). Participants who consumed instant noodles ≥3 times/week had 0.79 ng/mL lower serum 25(OH)D levels than those who consumed noodles≤1 time/month (P=0.001). The inverse relationship between instant noodle intake and serum 25(OH)D levels was similar in magnitude to the positive association between fatty fish intake and serum 25(OH)D levels. Similarly, students who consumed SSBs ≥3 times/week had 0.54 ng/mL lower serum 25(OH)D levels than those with an intake of ≤1 time/month (P=0.041). These inverse associations were independent of other dietary habits and consistent after further adjustment for fruit and vegetables intake-proxies for a healthy diet. Participants who consumed SSBs frequently tended to consume milk more frequently. Among students who consumed SSBs ≥3/week, a multivariable-adjusted OR of dairy intake ≥7/week was 1.81 (95% CI 1.29-2.54; Ptrend<0.001) compared with those consumed SSBs≤1 time/month. Eating breakfast was positively associated with serum 25(OH)D levels. Compared with students who ate breakfast less than 4 days/week, students who ate breakfast daily had 1.04 ng/mL higher levels of serum 25(OH)D (Ptrend<0.001). Supplemental vitamin D intake was also a significant correlate with the largest difference (2.17 ng/mL) in serum 25(OH)D levels between categories.
Household income was associated with low serum 25(OH)D levels only in the second lowest quartile, and no significant linear trend across quartiles was observed. Students who had grown up in foreign countries before university admission (n=93) had higher vitamin D levels than those who had grown up in Korea, but this association was statistically marginal (P=0.054). Among the initial covariables, parents' education levels, residence, smoking, alcohol consumption, use of sunblock, meal frequency, and consumption of vegetables, fruits, and high-fat meat were not significantly associated with serum 25(OH)D levels.
Using the significant correlates, we postulated two extreme groups based on lifestyle: i) people with the healthiest lifestyle-normal body weight, no central obesity, high physical activity, short sedentary time, sunlight exposure ≥30 min/day, frequent consumption of dairy (≥7 times/week) and fish (≥3 times/week), low intake of instant noodles and SSBs (≤1 time/week), daily breakfast eating, and vitamin D supplementation and ii) people with the unhealthiest lifestyle-general and central obesity, low physical activity, long sedentary time, sunlight exposure <30 min/day, breakfast eating≤1 days/week, no vitamin D supplementation, low intake of dairy (≤2 times/week) and fish (≤1 time/month), and frequent consumption of instant noodles and SSBs (≥3 times/week). The calculated difference in serum 25(OH)D levels between these two extreme groups was 11.0 ng/mL (healthiest:17.9 ng/mL±SE 0.50 vs. unhealthiest: 6.9 ng/mL±SE 0.47), which was considerably large given the distribution of 25(OH)D in the participants of this study.
DISCUSSION
This study suggests that vitamin D deficiency is highly prevalent among Korean university students living at latitude 37° north. Over 95% of students had serum 25(OH)D levels less than 20 ng/mL and about 45% had less than 10 ng/mL in spring. Many potentially modifiable lifestyle and dietary factors were independently associated with serum 25(OH)D levels. Significant positive correlates were older age, male sex, increased physical activity, sunlight exposure, eating breakfast regularly, consumption of dairy and fatty fish, and use of vitamin D-containing supplements. In contrast, significant inverse correlates were general and abdominal obesity, underweight, long sedentary time, and frequent consumption of instant noodles and SSBs. The postulated difference in serum 25(OH)D levels between groups with all healthy correlates and those with all unhealthy ones was substantially higher than the differences observed for any single component of correlates.
The low vitamin D status in our participants was similar to that found in nationally representative data, although comparison between studies is rather difficult due to the lack of standardization of vitamin D measurement and the different seasons when blood samples were collected. Among Korean adolescents, the prevalence of vitamin D deficiency (<10 ng/mL) reached about 90% during winter and spring in the fourth Korea National Health and Nutrition Examination Survey 2008-2009 (15). As in other northern countries, substantial seasonal changes in serum 25(OH)D levels exist in Korea. The mean serum 25(OH)D levels were the lowest in March and April and the highest in August and September (1519), and the prevalence of 25(OH)D deficiency was 4 to 5 times higher in winter and spring than in summer and fall (3).
Male students had significantly higher serum 25(OH)D levels than female students, which is consistent with previous results (3152122). The sex difference in vitamin D status may be due to women's higher percentage of body fat, differences in amount of time spent outdoors, or sun protection behaviors such as use of sunscreen (13).
In our study, both general and abdominal obesity was independently associated with low serum 25(OH)D levels. Many previous studies found inverse associations between BMI and serum 25(OH)D levels (12132223), while a few studies indicated that abdominal obesity was more strongly related to low 25(OH)D status than overall obesity (21). Plausible mechanisms supporting these associations may include a dilutional effect, sequestration of vitamin D in fat tissue, lack of outdoor activity in obese individuals, or the direct effects of vitamin D on increasing fat oxidation rates, diet-induced thermogenesis, and anti-lipogenesis in adipocytes (132223).
Furthermore, we found that being underweight (BMI <18.5 kg/m2) was also associated with low vitamin D status, while most prior studies investigated obesity only. Although we are unaware of any previous studies using a BMI cut-off of 18.5 kg/m2, an association between BMI<23 kg/m2 and vitamin D insufficiency among Korean women (2) and a possible inverted U-shaped relationship between BMI and serum 25(OH)D levels among German adults (24) were suggested. The mechanisms remain to be elucidated, but it is plausible that underweight persons may be prone to vitamin D deficiency due to inadequate food consumption or lower exposure to sunlight as they are less often outdoors or perhaps wear more covering clothing (24).
Consistent with the previous results (3121522), we found that increased physical activity was positively associated with serum 25(OH)D levels, and sedentary time was inversely associated. Both physical activity and sedentary time were significant even after mutual adjustment and further adjustment for sunlight exposure time. Although the present study did not distinguish outdoor physical activity from indoor, the independent associations imply that physical activity may have an independent biological role in modulating serum 25(OH)D beyond the role as a surrogate for sunlight exposure during outdoor activity (1323).
The duration of sunlight exposure was only moderately associated with serum 25(OH)D levels in our study, which can mainly be explained by low ultraviolet-B (UVB) levels, wearing long-sleeved clothing, and a tendency to stay indoors in winter and spring when this study was conducted (3). Also, the duration of sunlight exposure was assessed by questionnaire, and may not be precisely reported. Even in summer, many people in Asian countries avoid direct sun exposure and use sunscreen due to cultural practices and concerns about aging and skin cancer (1314). Indeed, about 60% of our study participants reported regular use of sunscreen or long sleeved clothing. As many individuals now practice sun avoidance behaviors, sunlight exposure may no longer correlate well with vitamin D status.
We found that frequent consumption of fatty fish and dairy was positively associated with serum 25(OH)D levels as in prior studies (13152122). Because few foods are fortified with vitamin D in Korea, dietary sources of vitamin D are not common. Fatty fish and milk are some of the few food sources of vitamin D in Korea (19). Although most dairy products in Korea are not fortified with vitamin D (15), calcium in dairy may also play a role in vitamin D utilization. Low dietary calcium intake may induce mild hyperparathyroidism which may enhance conversion of 25(OH)D into 1,25(OH)2D, consequently lowering 25(OH)D levels (25). Dietary vitamin D in general contributes to vitamin D status only in small part compared with cutaneous vitamin D synthesis via UVB radiation, but the influence of dietary intake may increase during winter when levels of effective UVB radiation decrease (24).
The consumption of instant noodles is high among Asian populations, and South Koreans are the highest consumers per capita in the world (26). Of note, young adults who consumed instant noodles more frequently had significantly lower levels of serum 25(OH)D in our results. The magnitude of difference in serum 25(OH)D between extreme categories of instant noodle intake was similar to that of extreme categories of fatty fish intake (an established major dietary source of vitamin D), but the association was in the opposite direction. We are yet unaware of any previous studies that investigated the association between instant noodle consumption and serum vitamin D levels. An association between instant noodle consumption and metabolic syndrome was suggested in Korean women, and the combined effect of high energy density, glycemic loads, saturated fat, and sodium in instant noodles was hypothesized to contribute to the association (26). Since the observed association in our study does not provide any particular mechanisms, further studies are warranted to find direct mechanisms. It is also likely that instant noodle intake serves as a proxy for differences in health behavior not captured by the constructs of healthy diet.
SSB consumption has increased since the 1960s in most western populations (27), but a recent study in the US showed decreasing trends in SSB consumption between 1999 and 2010 (28). In contrast, SSB consumption in Korea has almost quadrupled in a recent five-year period (from 45 g/d in 1998 to 158 g/d in 2013), and males in their 20s were the highest consumers (310 g/d) among subgroups. In our study, young adults who consumed SSBs more frequently had significantly lower levels of serum 25(OH)D. Although studies reporting a direct relationship between SSB consumption and serum 25(OH)D are scarce, several studies found that SSB consumption was associated with reduced bone mass (2729), decreased serum calcium level (30), and increased fracture risk (31). Mechanisms responsible for these associations may be the displacement of milk consumption from the diet (32) or the direct effects of components in SSBs, including phosphoric acid (31), fructose (33), or caffeine (29). For most of these components, the effects are usually attributed to increased urinary calcium loss (2730). Earlier studies suggested that increased SSB intake might decrease milk consumption concomitantly (2729), but displacement of milk does not fully explain our findings. The relationship between SSB consumption and low serum 25(OH)D remained significant after adjustment for dairy consumption. In addition, frequent SSB consumers in our study tended to consume dairy more frequently, and prior studies reported mixed results in the relationship between SSB intake and milk or dietary vitamin D intake (1134). A link between phosphoric acid, an acidulant in SSBs, and serum 25(OH)D level is plausible. Both the low calcium-to-phosphorus ratio and the high net acid loads of SSBs can cause increased calcium excretion and reduced serum calcium (2730), which may stimulate parathyroid hormone (27) and thus decrease serum 25(OH)D levels. More recently, fructose in SSBs was implicated as a possible cause of reduced calcium balance (33). In animal studies, excessive fructose consumption inhibited intestinal and renal calcium transport and decreased circulating vitamin D levels (35).
We found that young adults who ate breakfast regularly had significantly higher serum 25(OH)D levels. In previous studies, breakfast consumption was associated with greater vitamin D intake in countries where foods are fortified with vitamin D as well as where foods are not fortified (113436), although those studies did not measure serum 25(OH)D levels but only dietary vitamin D intake. As the most frequently consumed breakfast food was milk in those countries, greater milk intake likely explains the association between breakfast consumption and vitamin D intake (36). Similarly, many Korean young adults had a dairy-cereal pattern for breakfast (37). Breakfast eating is known to be associated with reduced risks of weight gain and metabolic syndrome (37). Despite the beneficial effects of breakfast eating, only 42.5% of Korean in their 20s eat breakfast regularly (5-7 days/week), which is the lowest level across all age groups, and the number of young adults who eat breakfast has been decreasing in recent years (38). These findings are of great concern given the potential negative future health consequences.
Vitamin D-containing supplement users in our study had significantly higher 25(OH)D levels than non-users, as found in other studies (31521). A meta-analysis suggested that vitamin D supplementation of deficient children and adolescents could result in clinically useful improvements in bone mineral density and content (39). However, the observed association in our study requires a cautious interpretation in its role in preventing vitamin D deficiency in the general population because our study was performed only in spring months, and we did not measure any health outcomes such as fracture, cancer, or mortality.
Previous studies found inconsistent results for the association between socioeconomic status and vitamin D status (1140). We found no significant linear trends between sociodemographic factors and serum 25(OH)D levels. This finding is plausible given the relatively narrow ranges of age and similar academic attainment of our participants. Another explanation may be that potential associations between sociodemographics and vitamin D status were mediated by lifestyle factors which were adjusted for in our analyses.
This study had several limitations. First, our study population consisted mainly of Korean students at one university, which may limit the generalizability of our results, but may also reduce the possibility of confounding by age, race, or other demographics. Second, blood samples were collected in spring; thus, it must be taken into account that the serum 25(OH)D levels in the present study is an underestimate of the full-year average. However, given that the season was the strongest correlate of serum 25(OH)D levels among the Korean population (3), we were able to minimize the possibility of confounding by season. Third, serum 25(OH)D was measured using the CLIA. Compared to the liquid chromatography-tandem mass spectrometry (LC/MS-MS) method, the CLIA has been reported to underestimate absolute values of 25(OH)D, despite a high degree of relative concordance between the two methods (21). In addition, our FFQ was limited by the lack of data on portion size, although previous reports showed that portion size contributes a relatively small amount of information on variation in dietary intake (26). Lastly, the cross-sectional nature of this study limits a causal inference. Nonetheless, an effect of serum 25(OH)D on lifestyles does not seem plausible, because most individuals were unlikely to be aware of their blood vitamin D levels.
Our study had several strengths. This study used a large population of young adults for investigating factors associated with serum vitamin D levels. Serum 25(OH)D levels were directly measured, which is considered the best indicator of vitamin D status in the body. In addition, blood samples were collected during a short period of time (3 weeks) and all assays were performed in a single laboratory using the same analytic method, which might reduce possible variability due to seasons and laboratories. We obtained information on a broad range of demographic, anthropometric, lifestyle, and dietary variables, thereby providing the opportunity to better adjust for important potential confounders in analyses. We found some novel correlates of serum 25(OH)D such as underweight, breakfast eating, and consumption of instant noodles or SSBs. Although these findings need to be replicated by prospective studies in other populations, our results imply that widespread unhealthy lifestyle choices in young adults could have substantial deleterious consequences for health outcomes.
In conclusion, low vitamin D status is highly prevalent in Korean young adults and many potentially modifiable lifestyle and dietary factors are significantly associated with low vitamin D status. Given the importance of vitamin D for optimal bone health and possible extra-skeletal health outcomes, our results indicate low vitamin D status in Korean young adults to be a public health issue. Further studies are warranted on potential mechanisms of the correlates and optimal strategies to improve vitamin D status in this vulnerable subpopulation.

 XML Download