Journal List > J Korean Med Sci > v.30(8) > 1022690

Park, Choi, and Hong: Utilizing Genetic Predisposition Score in Predicting Risk of Type 2 Diabetes Mellitus Incidence: A Community-based Cohort Study on Middle-aged Koreans

Abstract

Contribution of genetic predisposition to risk prediction of type 2 diabetes mellitus (T2DM) was investigated using a prospective study in middle-aged adults in Korea. From a community cohort of 6,257 subjects with 8 yr' follow-up, genetic predisposition score with subsets of 3, 18, 36 selected single nucleotide polymorphisms (SNPs) (genetic predisposition score; GPS-3, GPS-18, GPS-36) in association with T2DM were determined, and their effect was evaluated using risk prediction models. Rs5215, rs10811661, and rs2237892 were in significant association with T2DM, and hazard ratios per risk allele score increase were 1.11 (95% confidence intervals: 1.06-1.17), 1.09 (1.01-1.05), 1.04 (1.02-1.07) with GPS-3, GPS-18, GPS-36, respectively. Changes in AUC upon addition of GPS were significant in simple and clinical models, but the significance disappeared in full clinical models with glycated hemoglobin (HbA1c). For net reclassification index (NRI), significant improvement observed in simple (range 5.1%-8.6%) and clinical (3.1%-4.4%) models were no longer significant in the full models. Influence of genetic predisposition in prediction ability of T2DM incidence was no longer significant when HbA1c was added in the models, confirming HbA1c as a strong predictor for T2DM risk. Also, the significant SNPs verified in our subjects warrant further research, e.g. gene-environmental interaction and epigenetic studies.

Graphical Abstract

jkms-30-1101-ab001

INTRODUCTION

Although type 2 diabetes mellitus (T2DM), a prevalent and complex disease, is known to be caused by combinations of genes and environmental factors, the genetic contribution is not clearly evaluated. Dozens of single nucleotide polymorphisms (SNPs) in association with T2DM were identified by genome-wide association studies (GWAS), such as PPAR, KCNJ11, TCF7L2, CDKAL1, CDKN2A/B, and FTO (12). However, contribution of SNPs to development of T2DM was found to be limited, with reported estimates of genetic contribution to heritability for T2DM unveiled by GWAS as 6%-15% (34).
Genetic predisposition, expressed in scores of combined risk alleles of SNPs discovered from GWAS, has been used in researches on utilizing genotype information for practical use. One of them is constructing risk prediction models (567), which so far have shown limited improvement in prediction ability on T2DM risk, compared to common risk factors (38).
While limited explanation ability by SNPs on T2DM still remains as a challenge, possibility of disparity in predictive performance by study design and population characteristics has been pointed out (9). As most of the polygenic T2DM prediction studies are based on Caucasian populations, extending the research to non-European subjects has been strongly recommended (10).
Therefore, we aimed to explore the contribution of genetic variants on T2DM in a different ethnicity using a well-designed prospective data from a community-based cohort study in Korea. With SNPs found to be in association with T2DM from previously reported studies, we made a genetic predisposition score (GPS) in constructing the prediction models in a cohort study of 8-yr follow-up.

MATERIALS AND METHODS

The Anseong-Ansan Cohort Study, one of the 3 prospective community- based cohort studies from the Korean Genome and Epidemiology Study (KoGES), begun with 10,038 subjects aged 40 to 69 yr at baseline (2001-2003). Whole-genome sequencing using Affymetrix 500K Array (Affymetrix, Santa Clara, CA, USA) was performed in 8,842 randomly selected subjects during the baseline investigation period, and unphased genotypes were imputed with Japanese+Chineses HapMap phase 2 haplotype panel using IMPUTE version 2 (http://mathgen.stats.ox.ac.uk/impute). Follow-up studies are carried out in 2-yr intervals, at 2003-2005, 2005-2007, and so on. In this study, we used 8-yr follow-up data, collected biennially until the 4th follow-up (2009-2011). Details regarding the KoGES, including methods and quality control for the genotyping, have been described in previous reports (1112).
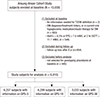
At baseline, we excluded 2 subjects without any information needed for T2DM definition, 683 subjects with history of DM diagnosis/treatment or in current oral hypoglycemic medication/insulin therapy for DM, and 544 subjects with glycated hemoglobin (HbA1c) ≥6.5% or fasting plasma glucose (FPG)≥7.0 mM/L or plasma glucose level 2-hr after ingestion of 75 g oral glucose load (2 hr-OGTT) ≥11.1 mM/L. From 8,809 subjects at baseline, 954 (10.8%) subjects were eliminated due to follow-up loss after fourth follow-up in 2009-2011. Of the remaining 7,855 subjects, we excluded another 945 (12.0%) subjects who had not been selected for genotyping procedures at baseline. Thus 6,910 subjects remained for analysis (Fig. 1). Incident T2DM cases at each follow-up was identified as corresponding to at least one of the following definitions: HbA1c ≥6.5%, FPG ≥7.0 mM/L, 2 hr-OGTT ≥11.1 mM/L, or in treatment state for T2DM with insulin or oral hypoglycemic medication since the last follow-up or two years' period.
In our study, we tested 38 SNPs reported to be in association with T2DM in Korean or East Asian population, from GWAS meta-analysis or candidate gene analysis that partly or entirely used KoGES baseline data (111314). We investigated frequency of risk alleles of each SNP, and calculated hazard ratios (HR) and 95% confidence intervals (CI) by the risk allele on the incident T2DM in our study subjects by Cox's proportional hazard functions. For GPS, numbers of risk alleles of selected SNPs were combined to a continuous variable, ranging from 0 to number of selected SNPs multiplied by 2. We also calculated weighted GPSs to adjust for different effect estimates of each SNP in association with T2DM, using relative effect sizes from the association analysis. Thus, higher GPS indicate a higher genetic predisposition to T2DM (15).

Statistical analysis

Cox's proportional hazard functions were used to estimate HR and their 95% CIs. Stepwise procedures were used for variable selection in the prediction model. First, we tested all a priori covariates in a univariate Cox regression model at significant level of P value≤0.2, then fitted all significant and non-significant covariates in multivariate Cox regression models with P value≤0.15 required for inclusion in backward and forward selection procedures, respectively. Finally, we used stepwise selection with the selected covariates with P value≤0.15 to attain the main-effects model. Likelihood ratio test was used for all covariate inclusion/exclusion decisions (16).
From the full model with all selected variables, we also constructed several subset models in accordance with previous literature (517). For all subset models, we evaluated discrimination, calibration and risk reclassification after adding risk alleles (i.e. GPS) in the models. C-statistics and Hosmer-Lemeshow chi-square test were used to test for model discrimination and calibration, and net reclassification index (NRI) and integrated discrimination improvement (IDI) were analyzed to examine risk reclassification upon addition of selected risk alleles (18).
A two-tailed P<0.05 indicated statistical significance. Statistical analyses were performed using SAS version 9.3 (SAS Institute, Cary, NC, USA) and Stata/SE 13.0 (StataCorp LP, College Station, TX, USA).

Ethics statement

Informed written consent was obtained from all participants, and the study protocol was approved by the institutional review board of the Korea Centers for Disease Control and Prevention (KCDC) as well as Seoul National University Hospital (IRB No. 1306-046-495).

RESULTS

Mean age of subjects were 51.8 yr at baseline, and males accounted for 47% of the total 6,910 subjects. Over the 8-yr follow-up, 1,240 (18.0%) were defined as incident T2DM cases (Table 1). As well as variables tested for prediction modeling (i.e. age, body mass index [BMI], triglyceride [TG], FPG, HbA1C, etc.) GPSs were higher in incident diabetic cases compared to those who remained non-diabetic (P value<0.001).
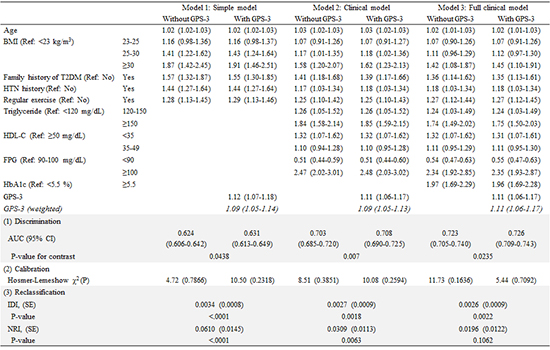
Among the selected 38 SNPs, three SNPs, rs10811661 (CDKN2A/B), rs5215 (KCNJ11), and rs2237892 (KCNQ1) showed significant association with T2DM incidence in our subjects (rs10811661, HR 1.22 [95% CI 1.02-1.46]; rs5215, HR 1.27 [1.06-1.52], rs2237892, HR 1.37 [1.12-1.68]), and most SNPs showed same direction of estimate as reported by original researches (Table 2). In constructing GPS, we eliminated rs7756992 and rs71724 32 as they showed strong linkage with rs9465871 (D'=0.977, r2=0.933) and rs1436955 (D'=1, r2=0.627), respectively. We constructed three GPSs with differently selected SNPs, i.e. 1) GPS-3 with three SNPs in significant association with T2DM in our study subjects (range 0-6); 2) GPS-18 with 18 SNPs analyzed by Affymetrix 500K (range 0-36); 3) GPS-36, with addition of 18 further SNPs attained through imputation of HapMap data (range 0-72).
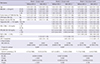
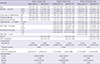
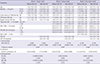
After stepwise selection procedures, age, BMI, family history of T2DM, hypertension history, regular physical exercise, and clinical indices such as triglyceride, FPG, and HbA1c as well as GPSs were selected as variables for risk prediction modeling. We used subsets of variables in building simple (information from questionnaires and anthropometric measurements, i.e. age, BMI, family history of T2DM, history of hypertension, regular physical excercise), clinical (variables from simple model plus clinical examination data, i.e. serum TG, HDL-cholesterol, FPG levels), and full clinical (variables from clinical model plus serum HbA1c level) models. Within the models, we tested for significant changes in discrimination and reclassification by the prediction models upon addition of GPS-3 (Table 3), GPS-18 (Table 4) or GPS-36 (Table 5).
Hazard ratios for T2DM incidence per risk allele score increase were 1.11 (95% CI 1.06-1.17, full clinical model), 1.03 (1.01-1.06), and 1.04 (1.02-1.07), in cases of GPS-3, GPS-18, and GPS-36, respectively. This relationship was significant across all three models, and HRs analyzed with weighted GPSs also showed significant results (1.11; 95% CI, 1.06-1.17, full clinical model), 1.03 (1.01-1.05), and 1.04 (1.01-1.05) with GPS-3, GPS-18, GPS-36, respectively).
Evaluation of risk prediction in addition to GPSs is also shown in Tables 3, 4, 5. In case of comparing prediction models with or without GPS-3 (Table 3), subtle significant changes in area under the curve (ΔAUC) were found across all three models (ΔAUC; 0.007 [P=0.044], 0.005 [P=0.007], 0.003 [P=0.024] for simple, clinical, full clinical models, respectively), while reclassification analysis showed significance with simple and clinical models but not with full clinical model, where HbA1c is lastly added (NRI; 6.1% [P<0.001], 3.1% [P=0.006], 2.0% [P=0.106], respectively). In case of GPS-18 (Table 4), both discrimination (ΔAUC; 0.007 [P=0.033], 0.003 [P=0.054], 0.001 [P=0.130] for simple, clinical, full clinical models, respectively) and reclassification (NRI; 5.1% [P<0.001], 3.3% [P=0.002], 1.0% [P=0.336], respectively) indices were significant or borderline-significant at simple but not in full clinical models. In case of GPS-36 (Table 5), significant or borderline-significant discrimination was observed (ΔAUC; 0.014 [P=0.047], 0.006 [P=0.041], 0.005 [P=0.050] for simple, clinical, full clinical models, respectively). Similar to reclassification improvement with GPS-3 and GPS-18, NRI was positively significant in simple and clinical models, but not in full clinical model (NRI; 8.6% [P<0.001], 4.4% [P=0.012], 1.7% [P=0.352], respectively).

DISCUSSION

From a community cohort of 8-yr follow-up in Korea, we observed some influence of genetic predisposition drawn from genotype information on 3, 18, and 36 selected SNPs, on risk of T2DM incidence. The significant discrimination or reclassification indices upon addition of GPS in simple and clinical models were on longer observed in full models, i.e. when HbA1c was finally included, and this tendency was consistent across all three tested GPSs.
Risk prediction modeling for T2DM on the same Anseong-Ansan cohort population had been carried out previously, at 4-yr follow-up and without considering for genetic predisposition. The authors also had focused on the HbA1c variable, which substantially increased NRI (12.8%) upon addition to the prediction model (12). Another 5-yr follow-up cohort study on Japanese population also reported FPG and HbA1c together were effective predictors for T2DM incidence (19). Lastly, a case-cohort research from European Prospective Investigation into Cancer and Nutrition (EPIC)-Potsdam study that utilized metabolic markers including HbA1c as well as genetic markers in predicting T2DM risk, found that addition of genetic information to metabolic markers, age, anthropometry, and lifestyle characteristics, did not significantly improve disease prediction, while FPG and HbA1c considerably contributed to the prediction (20). Thus, as an indicator of chronic glycemia, it is convincible that HbA1c is a strong indicator of T2DM prediction, well over information on genetic predisposition (21). Our results, where the apparent influence by genetic variation on T2DM prediction weakened in the final model including HbA1c, strongly support the previous findings. At the same time, the decrease in prediction ability across the simple, clinical and full clinical models also imply that HbA1c is a phenotype already inherent and reflected by the genetic predisposition, as confirmed by significant association between the selected SNPs and HbA1c levels in our subjects (Supplementary Table 2). To our knowledge, ours is one of the few studies that utilized information on both genetic predisposition and HbA1c in testing T2DM risk prediction model, especially in a non-European ethnicity.
As younger populations are subject to less developed clinical risk factors, confirming our findings in a younger population would be meaningful. In younger adults, HbA1c may be a less important factor in predicting T2DM, and influence by genetic variation may persist even after multiple-variable adjustment (17). However, inconsistent and non-significant results were found in subjects ≤50 yr old in our study (results not shown). This may be explained by poor validity due to much decreased number and the baseline characteristic of the middle-aged participants, who may have already begun developing subclinical metabolic disorders.
We have selected SNPs already validated from previous studies that included genetic information from the same Anseong-Ansan cohort for GWAS or meta-GWAS analyses. Also, the association tests between the SNPs and T2DM incidence (or prevalence) were restricted to East Asian populations. This method has advantage over a single GWAS in the study population, which face insufficient validity of results due to small number of subjects and limited resource for independent population with identical ethnicity for replication. On the other hand, the major disadvantage of this method is possibility of overfitting. The significant SNPs found in our study, already replicated in studies including the same subjects, could otherwise be interpreted as those that show strong association specifically in our Anseong-Ansan cohort subjects. Again, this problem could be overcome by replication in an independent population of identical ethnicity. The pros and cons of using validated SNPs for which information from same subjects were utilized as subset data warrant further investigation.
Three SNPs with significant HRs found in our study were KCNJ11 (rs5215), CDKN2A/B (rs10811661), and KCNQ1 (rs22378 92), and their HRs were about 1.3. Insulin secretion is the main explained function of the three genes, with CDKN2A/1B in relation with development of pancreatic β-cells, while KCNJ11 and KCNQ1 are related with the β-cell dysfunction (22), and effects of these genotype variants on T2DM have been tested in East Asian populations (112324). KCNJ11 (potassium inwardly-rectifying channel, subfamily J, member 11) regulates glucose-dependent insulin secretion, and its mutations have been reported to cause severe neonatal diabetes (25). It consists a subunit of sulfonylurea receptor, and the mutation can alter response to sulfonylurea treatment in T2DM patients (26). CDKN2A/B (cyclin-dependent kinase inhibitor 2A/B) and KCNQ1 (potassium voltage-gated channel, KQT-like subfamily, member 1) are known to be associated with impaired pancreatic β-cell function (22). Mutation in rs10811661 is also known for its association with myocardial infarction, to which T2DM is a high risk factor (27).
In the prediction models that included GPSs, we found independent effects of family history of T2DM and GPS on T2DM risk, with greater HRs by family history than GPS across all subset models with all three GPSs. Our results support speculations that family history may provide more information from shared environmental influence, i.e. non-genetic familial behaviors such as lifestyle and dietary habits, than inherited genetic influence alone (56). Thus, while considering family history of T2DM is necessary in investigating genetic influence by the risk alleles, we also suggest research on gene-environment interactions and epigenetics to be continuously encouraged (328).
Although we constructed risk prediction models from a prospective cohort study, duration of follow-up was relatively short. Longer follow-up duration could improve prediction ability of genetic variants relative to time-varying factors e.g. clinical examination findings, as discrimination power of GPS increase with extended follow-up period (710). Also, we could not consider lifestyle risk factors such as smoking and diet in our prediction model due to statistical insignificance of their influence on T2DM and subsequent elimination by statistical procedures, despite the alleged influence to the disease (29). As studies have also reported some interaction effect between behavioral risk factors and genetic polymorphisms as well as significant effect of lifestyle intervention in subjects with high genetic risk scores (30), further investigations on gene-lifestyle interaction may be required.
In conclusion, we observed influence of genetic variation, described by subsets of selected SNPs, on risk prediction of T2DM incidence in a 8-yr cohort of middle-aged Koreans, but the significance in discrimination and reclassification of prediction ability disappeared when information on HbA1c levels were added. We have also verified three SNPs in significant association with T2DM in our subjects, and our results as elementary findings may contribute to expanded genetic studies.

Figures and Tables

Fig. 1

Flow chart showing selection of subjects included in the analysis.

jkms-30-1101-g001
Table 1

Baseline characteristics of study subjects

jkms-30-1101-i001
Parameters All (n = 6,910) Case (n = 1,240) Control (n = 5,670)
Mean ± SD
 Age (yr) 51.77 ± 8.79 53.4 ± 8.78 51.41 ± 8.76
 Body mass index (kg/m3) 24.47 ± 3.02 25.04 ± 3.21 24.34 ± 2.96
 HDL cholesterol (mM/L) 1.17 ± 0.26 1.13 ± 0.26 1.17 ± 0.26
 Triglyceride (mM/L) 1.76 ± 1.10 2.09 ± 1.29 1.69 ± 1.04
 Fasting glucose (mM/L) 4.61 ± 0.50 4.88 ± 0.61 4.56 ± 0.45
 HbA1c (%) 5.55 ± 0.35 5.77 ± 0.36 5.51 ± 0.33
 Risk allele scores of 3 analyzed SNPs 3.13 ± 1.19 3.27 ± 1.2 3.1 ± 1.18
 Risk allele scores of 18 analyzed SNPs 18.76 ± 2.71 19.04 ± 2.73 18.69 ± 2.71
 Risk allele scores of 36 analyzed SNPs 40.54 ± 3.53 41.07 ± 3.58 40.43 ± 3.51
 Average systolic blood pressure (mmHg) 120.71 ± 18.17 125.04 ± 18.77 119.77 ± 17.9
 Average diastolic blood pressure (mmHg) 79.98 ± 11.41 82.31 ± 11.48 79.47 ± 11.33
 Average waist circumference (cm) 82.13 ± 8.68 84.16 ± 8.78 81.68 ± 8.6
 Average hip circumference (cm) 93.47 ± 5.91 94.32 ± 5.98 93.29 ± 5.87
 HOMA-IR 1.55 ± 1.00 1.70 ± 1.02 1.52 ± 0.99
Frequency (%)
 Sex Male 3,251 (47.05) 642 (51.77) 2,609 (46.01)
Female 3,659 (52.95) 598 (48.23) 3,061 (53.99)
 Current smoking No 5,124 (75.07) 893 (72.9) 4,231 (75.54)
Yes 1,702 (24.93) 332 (27.1) 1,370 (24.46)
 Current drinking No 3,561 (51.96) 618 (50.24) 2,943 (52.34)
Yes 3,292 (48.04) 612 (49.76) 2,680 (47.66)
 Regular physical activity No 2,842 (41.53) 465 (37.71) 2,377 (42.37)
Yes 4,001 (58.47) 768 (62.29) 3,233 (57.63)
 Family history of T2DM No 6,191 (89.59) 1,066 (85.97) 5,125 (90.39)
Yes 719 (10.41) 174 (14.03) 545 (9.61)
 Hypertension No 4,928 (71.32) 750 (60.48) 4,178 (73.69)
Yes 1,982 (28.68) 490 (39.52) 1,492 (26.31)
 Metabolic syndrome No 4,654 (67.35) 641 (51.69) 4,013 (70.78)
Yes 2,256 (32.65) 599 (48.31) 1,657 (29.22)

HDL, high-density lipoprotein; FPG, fasting plasma glucose; HbA1c, glycated hemoglobin A1c; HOMA-IR, homeostasis model assessment of insulin resistance index; T2DM, type 2 diabetes mellitus.

Table 2

Characteristics of selected risk loci for type 2 diabetes mellitus

jkms-30-1101-i002
SNP Chromosomes Locus Risk allele RAF of case/control HR (95% CI) P value Reported OR (95% CI) in East Asians* Reported OR (95% CI) in Caucasians
18 SNPs analyzed by Affymetrix 500K
 rs10923931 1 NOTCH2 T 0.04/0.03 0.88 (0.12-6.24) 0.896 1.05 (0.92-1.20) 1.13 (1.08-1.17) (1)
 rs7593730 2 RBMS1 C 0.83/0.83 1.28 (0.86-1.91) 0.224 1.03 (0.97-1.09) 1.11 (1.08-1.16) (2)
 rs1470579 3 IGF2BP2 C 0.33/0.31 1.07 (0.86-1.34) 0.526 1.13 (1.08-1.19) 1.17 (1.11-1.23) (3)
 rs1801282 3 PPARG C 0.96/0.95 1.83 (0.46-7.33) 0.394 1.13 (1.01-1.28) 1.14 (1.08-1.20) (3)
 rs4607103 3 ADAMTS9 C 0.62/0.61 1.11 (0.91-1.35) 0.317 0.99 (0.95-1.04) 1.09 (1.06-1.12) (1)
 rs831571 3 PSMD6 C 0.63/0.63 1 (0.83-1.21) 0.993 1.09 (1.06-1.12) NA
 rs7754840 6 CDKAL1 C 0.48/0.47 1.15 (0.97-1.37) 0.114 1.20 (1.14-1.25) 1.12 (1.08-1.16) (4)
 rs9465871 6 CDKAL1 C 0.56/0.54 1.15 (0.97-1.38) 0.110 1.14 (1.09-1.18) NA
 rs864745 7 JAZF1 T 0.74/0.72 1.27 (0.98-1.65) 0.074 1.06 (1.00-1.12) 1.10 (1.07-1.13) (1)
rs10811661 9 CDKN2A/B T 0.58/0.56 1.22 (1.02-1.46) 0.033 1.21 (1.14-1.28) 1.20 (1.14-1.25) (4)
 rs10906115 10 CDC123/CAMK1D A 0.54/0.53 1.06 (0.89-1.26) 0.528 1.09 (1.04-1.14) 1.13 (1.08-1.18) (5)
 rs5015480 10 HHEX C 0.19/0.19 0.97 (0.69-1.36) 0.855 1.16 (1.1-1.23) 1.19 (1.11-1.28) (6)
rs5215 11 KCNJ11 C 0.41/0.39 1.27 (1.06-1.52) 0.010 1.13 (1.08-1.18) 1.14 (1.10-1.19) (7)
 rs1531343 12 HMGA2 C 0.11/0.11 0.77 (0.45-1.31) 0.335 1.06 (0.99-1.14) 1.10 (1.07-1.14) (8)
 rs7961581 12 TSPAN8/LGR5 C 0.22/0.23 0.84 (0.63-1.11) 0.207 1.01 (0.95-1.06) 1.09 (1.06-1.12) (1)
 rs1359790 13 SPRY2 G 0.71/0.7 1.17 (0.94-1.47) 0.166 1.02 (0.97-1.08) 1.15 (1.10-1.20) (5)
 rs1436955 15 C2CD4A/C2CD4B C 0.7/0.69 0.94 (0.76-1.16) 0.583 1.13 (1.06-1.21) NA
 rs9939609 16 FTO A 0.87/0.88 1.09 (0.67-1.79) 0.726 1.15 (1.08-1.22) 1.15 (1.09-1.23) (9)
20 SNPs from HapMap imputation
 rs340874 1 PROX1 C 0.37/0.35 1.16 (0.96-1.41) 0.132 1.08 (1.03-1.14) 1.07 (1.05-1.09) (10)
 rs243021 2 BCL11A A 0.67/0.66 1.03 (0.84-1.27) 0.790 1.05 (1.00-1.10) 1.08 (1.06-1.10) (8)
 rs2943641 2 IRS1 C 0.94/0.95 0.44 (0.14-1.37) 0.155 1.12 (1.03-1.22) 1.19 (1.13-1.25) (11)
 rs6780569 3 UBE2E2 G 0.83/0.81 1.2 (0.83-1.76) 0.337 1.13 (1.07-1.20) 1.21 (1.14-1.30) (12)
 rs10010131 4 WFS1 G 0.98/0.98 NA 0.947 1.00 (0.91-1.10) 1.11 (1.05-1.16) (13)
 rs7756992 6 CDKAL1 G 0.56/0.54 1.16 (0.97-1.39) 0.314 1.14 (1.09-1.18) 1.19 (1.13-1.27) (14)
 rs2191349 7 DGKB T 0.68/0.68 1 (0.8-1.25) 0.978 1.11 (1.05-1.16) 1.06 (1.04-1.08) (10)
 rs4607517 7 GCK A 0.23/0.21 1.21 (0.92-1.6) 0.173 1.03 (0.97-1.09) 1.07 (1.05-1.10) (10)
 rs972283 7 KLF14 G 0.7/0.69 1.17 (0.93-1.48) 0.186 0.99 (0.93-1.06) 1.07 (1.05-1.10) (8)
 rs13266634 8 SLC30A8 C 0.59/0.59 1.02 (0.84-1.22) 0.871 1.11 (1.06-1.16) 1.15 (1.12-1.19) (15)
 rs896854 8 TP53INP1 T 0.29/0.29 0.93 (0.72-1.19) 0.546 1.07 (1.02-1.12) 1.06 (1.04-1.09) (8)
 rs13292136 9 CHCHD9 C 0.9/0.89 0.88 (0.54-1.44) 0.610 0.99 (0.92-1.07) 1.11 (1.07-1.15) (8)
 rs12779790 10 CDC123/CAMK1D G 0.11/0.1 1.27 (0.75-2.15) 0.381 1.12 (1.02-1.23) 1.11 (1.07-1.14) (1)
 rs7903146 10 TCF7L2 T 0.03/0.02 1.45 (0.21-10.24) 0.711 1.16 (1.02-1.31) 1.37 (1.31-1.43) (4)
 rs10830963 11 MTNR1B G 0.44/0.44 0.98 (0.82-1.17) 0.816 0.99 (0.93-1.06) 1.09 (1.06-1.12) (10)
 rs1552224 11 CENTD2 A 0.94/0.94 1.04 (0.85-1.27) 0.143 1.16 (1.06-1.27) 1.14 (1.11-1.17) (8)
rs2237892 11 KCNQ1 C 0.64/0.6 1.37 (1.12-1.68) 0.003 1.17 (1.11-1.23) 1.40 (1.34-1.47) (16)
 rs231362 11 KCNQ1 G 0.89/0.88 1.17 (0.64-2.12) 0.623 1.10 (1.00-1.20) 1.08 (1.06-1.10) (8)
 rs2334499 11 INS/IGF2B T 0.82/0.82 0.81 (0.6-1.09) 0.167 NA 1.35 (NA) (17)
 rs7172432 15 C2CD4A/C2CD4B A 0.55/0.55 1.02 (0.85-1.22) 0.989 1.09 (1.04--1.15) 1.14 (1.09-1.20) (12)

Adjusted for age, sex, and body mass index. *Referred from Cho YS et al. (11), 2012, Ryoo H et al. (13), 2011 and Shu XO et al. (14); References for reported odd ratios (OR) and CIs in Caucasians are in the Supplemental Material. HR, OR and CI, hazard ratio, odds ratio and confidence intervals; RAF, risk allele frequency; NA, not available.

Table 3

Evaluation of T2DM risk prediction with consideration for genetic predisposition derived from 3 selected SNPs (GPS-3)

jkms-30-1101-i003
Risk factors Model 1: Simple model Model 3: Full clinical model Model 3: Full clinical model
Without GPS-3 With GPS-3 Without GPS-3 With GPS-3 Without GPS-3 With GPS-3
Age 1.02 (1.02-1.03) 1.02 (1.02-1.03) 1.03 (1.02-1.03) 1.03 (1.02-1.03) 1.02 (1.01-1.03) 1.02 (1.01-1.03)
BMI (Ref: < 23 kg/m3) 23-25 1.16 (0.98-1.36) 1.16 (0.98-1.37) 1.07 (0.91-1.26) 1.07 (0.91-1.27) 1.07 (0.90-1.26) 1.07 (0.91-1.26)
25-30 1.41 (1.22-1.62) 1.43 (1.24-1.64) 1.17 (1.01-1.35) 1.18 (1.02-1.36) 1.11 (0.96-1.29) 1.12 (0.97-1.30)
≥ 30 1.87 (1.42-2.45) 1.91 (1.46-2.51) 1.58 (1.20-2.07) 1.62 (1.23-2.13) 1.42 (1.08-1.87) 1.45 (1.10-1.91)
Family history of T2DM (Ref: No) Yes 1.57 (1.32-1.87) 1.55 (1.30-1.85) 1.41 (1.18-1.68) 1.39 (1.17-1.66) 1.36 (1.14-1.62) 1.35 (1.13-1.61)
HTN history (Ref: No) Yes 1.44 (1.27-1.64) 1.44 (1.27-1.64) 1.17 (1.03-1.34) 1.18 (1.03-1.34) 1.18 (1.03-1.34) 1.18 (1.03-1.34)
Regular exercise (Ref: No) Yes 1.28 (1.13-1.45) 1.29 (1.13-1.46) 1.25 (1.10-1.42) 1.25 (1.10-1.43) 1.27 (1.12-1.44) 1.27 (1.12-1.45)
Triglyceride (Ref: < 120 mg/dL) 120-150 1.26 (1.05-1.52) 1.26 (1.05-1.52) 1.24 (1.03-1.49) 1.24 (1.03-1.49)
≥ 150 1.84 (1.58-2.14) 1.85 (1.59-2.15) 1.74 (1.49-2.02) 1.75 (1.50-2.03)
HDL-C (Ref: ≥ 50 mg/dL) < 35 1.32 (1.07-1.62) 1.32 (1.07-1.62) 1.32 (1.07-1.62) 1.31 (1.07-1.61)
35-49 1.10 (0.94-1.28) 1.10 (0.95-1.28) 1.11 (0.95-1.29) 1.11 (0.95-1.30)
FPG (Ref: 90-100 mg/dL) < 90 0.51 (0.44-0.59) 0.51 (0.44-0.60) 0.54 (0.47-0.63) 0.55 (0.47-0.63)
≥ 100 2.47 (2.02-3.01) 2.48 (2.03-3.02) 2.34 (1.92-2.85) 2.35 (1.93-2.87)
HbA1c (Ref: < 5.5%) ≥ 5.5 1.97 (1.69-2.29) 1.96 (1.69-2.28)
GPS-3 1.12 (1.07-1.18) 1.11 (1.06-1.17) 1.11 (1.06-1.17)
GPS-3 (weighted) 1.09 (1.05-1.14) 1.09 (1.05-1.13) 1.11 (1.06-1.17)
1) Discrimination
 AUC (95% CI) 0.624 (0.606-0.642) 0.631 (0.613-0.649) 0.703 (0.685-0.720) 0.708 (0.690-0.725) 0.723 (0.705-0.740) 0.726 (0.709-0.743)
P value for contrast 0.044 0.007 0.024
2) Calibration
 Hosmer-Lemeshow χ2 (P) 4.72 (0.7866) 10.50 (0.2318) 8.51 (0.3851) 10.08 (0.2594) 11.73 (0.1636) 5.44 (0.7092)
3) Reclassification
 IDI, (SE) 0.0034 (0.0008) 0.0027 (0.0009) 0.0026 (0.0009)
P value < 0.001 0.002 0.002
 NRI, (SE) 0.0610 (0.0145) 0.0309 (0.0113) 0.0196 (0.0122)
P value < 0.001 0.006 0.106

Range of risk alleles scores (GPS-3); 0-6. Model 1 (simple model) adjusted for age, BMI, family history of T2DM, HTN history, regular physical exercise±risk alleles; model 2 (clinical model), adjusted for variables in model 1 plus triglyceride, HDL-cholesterol, FPG±risk alleles; model 3, adjusted for all variables in model 3±risk alleles. Risk classification in NRI analysis: 10%, 20%, 30%. T2DM, type 2 diabetes mellitus; GPS, genetic predisposition score; HDL, high-density lipoprotein; FPG, fasting plasma glucose; HbA1c, glycated hemoglobin A1c; HOMA-IR, homeostasis model assessment of insulin resistance index; AUC, area under the curve; IDI, integrated discrimination improvement; NRI, net reclassification improvement.

Table 4

Evaluation of T2DM risk prediction with consideration for genetic predisposition derived from 18 selected SNPs (GPS-18)

jkms-30-1101-i004
Parameters Model 1: Simple model Model 2: Clinical model Model 3: Full clinical model
Without GPS-18 With GPS-18 Without GPS-18 With GPS-18 Without GPS-18 With GPS-18
Age 1.02 (1.02-1.03) 1.02 (1.02-1.03) 1.02 (1.02-1.03) 1.02 (1.02-1.03) 1.02 (1.01-1.03) 1.02 (1.01-1.03)
BMI (Ref: < 23 kg/m3) 23-25 1.13 (0.96-1.33) 1.13 (0.96-1.33) 1.05 (0.89-1.23) 1.05 (0.89-1.24) 1.05 (0.89-1.24) 1.05 (0.89-1.24)
25-30 1.40 (1.22-1.61) 1.42 (1.23-1.63) 1.15 (0.99-1.32) 1.16 (1.00-1.34) 1.09 (0.95-1.26) 1.10 (0.95-1.27)
≥ 30 1.94 (1.48-2.53) 1.99 (1.52-2.60) 1.59 (1.21-2.09) 1.64 (1.25-2.15) 1.45 (1.11-1.91) 1.48 (1.13-1.95)
Family history of T2DM (Ref: No) Yes 1.59 (1.34-1.90) 1.58 (1.33-1.88) 1.46 (1.23-1.74) 1.45 (1.22-1.73) 1.42 (1.19-1.69) 1.41 (1.19-1.68)
HTN history (Ref: No) Yes 1.47 (1.29-1.67) 1.47 (1.29-1.67) 1.19 (1.05-1.36) 1.19 (1.05-1.36) 1.19 (1.05-1.36) 1.20 (1.05-1.36)
Regular exercise (Ref: No) Yes 1.16 (1.03-1.31) 1.16 (1.03-1.32) 1.15 (1.01-1.30) 1.15 (1.01-1.30) 1.17 (1.03-1.32) 1.16 (1.03-1.32)
Triglyceride (Ref: < 120 mg/dL) 120-150 1.32 (1.11-1.59) 1.32 (1.10-1.58) 1.29 (1.08-1.55) 1.29 (1.08-1.55)
≥ 150 1.88 (1.61-2.18) 1.88 (1.62-2.19) 1.77 (1.52-2.06) 1.78 (1.53-2.07)
HDL-C (Ref: ≥ 50 mg/dL) < 35 1.22 (1.00-1.50) 1.22 (0.99-1.49) 1.22 (1.00-1.50) 1.21 (0.99-1.49)
35-49 1.06 (0.91-1.23) 1.06 (0.91-1.23) 1.07 (0.92-1.24) 1.07 (0.92-1.24)
FPG (Ref: 90-100 mg/dL) < 90 0.49 (0.42-0.56) 0.49 (0.43-0.57) 0.52 (0.45-0.60) 0.53 (0.46-0.61)
≥ 100 2.23 (1.83-2.72) 2.21 (1.81-2.69) 2.13 (1.75-2.60) 2.11 (1.74-2.57)
HbA1c (Ref: < 5.5%) ≥ 5.5 2.01 (1.73-2.34) 1.99 (1.71-2.32)
GPS-18 1.04 (1.02-1.06) 1.03 (1.01-1.05) 1.03 (1.01-1.06)
GPS-18 (weighted) 1.05 (1.03-1.07) 1.04 (1.02-1.06) 1.03 (1.01-1.05)
1) Discrimination
 AUC (95% CI) 0.621 (0.603-0.639) 0.628 (0.610-0.646) 0.702 (0.685-0.720) 0.705 (0.688-0.723) 0.724 (0.707-0.740) 0.725 (0.709-0.742)
P value for contrast 0.033 0.054 0.130
2) Calibration
 Hosmer-Lemeshow χ2 (P) 10.34 (0.2417) 20.08 (0.01) 7.57 (0.4766) 6.98 (0.5388) 9.17 (0.3283) 13.24 (0.1038)
3) Reclassification
 IDI, (SE) 0.0036 (0.0008) 0.002 (0.0007) 0.0019 (0.0007)
P value < 0.001 0.002 0.005
 NRI, (SE) 0.0507 (0.0138) 0.0326 (0.0106) 0.0101 (0.0105)
P value < 0.001 0.002 0.336

Range of risk alleles scores (GPS-18); 0-36. Model 1 (simple model) adjusted for age, BMI, family history of T2DM, HTN history, regular physical exercise±risk alleles; model 2 (clinical model), adjusted for variables in model 1 plus triglyceride, HDL-cholesterol, FPG±risk alleles; model 3, adjusted for all variables in model 3±risk alleles. Risk classification in NRI analysis: 10%, 20%, 30%. T2DM, type 2 diabetes mellitus; GPS, genetic predisposition score; HDL, high-density lipoprotein; FPG, fasting plasma glucose; HbA1c, glycated hemoglobin A1c; HOMA-IR, homeostasis model assessment of insulin resistance index; AUC, area under the curve; IDI, integrated discrimination improvement; NRI, net reclassification improvement.

Table 5

Evaluation of T2DM risk prediction with consideration for genetic predisposition derived from 36 selected SNPs (GPS-36)

jkms-30-1101-i005
Parameters Model 1: Simple model Model 2: Clinical model Model 3: Full clinical model
Without GPS-36 With GPS-36 Without GPS-36 With GPS-36 Without GPS-36 With GPS-36
Age 1.03 (1.02-1.04) 1.03 (1.02-1.04) 1.03 (1.02-1.04) 1.03 (1.02-1.04) 1.02 (1.01-1.04) 1.02 (1.01-1.04)
BMI (Ref: < 23 kg/m3) 23-25 1.09 (0.86-1.39) 1.09 (0.86-1.39) 1.03 (0.81-1.31) 1.03 (0.81-1.32) 1.04 (0.81-1.32) 1.05 (0.82-1.33)
25-30 1.32 (1.07-1.62) 1.34 (1.09-1.64) 1.15 (0.94-1.42) 1.16 (0.94-1.43) 1.10 (0.89-1.36) 1.11 (0.90-1.37)
≥ 30 2.09 (1.43-3.07) 2.21 (1.50-3.23) 1.98 (1.34-2.91) 2.04 (1.39-3.01) 1.74 (1.18-2.56) 1.80 (1.22-2.65)
Family history of T2DM (Ref: No) Yes 1.49 (1.15-1.93) 1.48 (1.14-1.91) 1.33 (1.03-1.73) 1.33 (1.02-1.72) 1.30 (1.00-1.69) 1.31 (1.01-1.70)
HTN history (Ref: No) Yes 1.47 (1.22-1.76) 1.47 (1.22-1.77) 1.13 (0.93-1.36) 1.13 (0.93-1.37) 1.12 (0.93-1.36) 1.13 (0.93-1.37)
Regular exercise (Ref: No) Yes 1.31 (1.09-1.57) 1.32 (1.10-1.59) 1.28 (1.07-1.54) 1.29 (1.07-1.55) 1.27 (1.06-1.53) 1.28 (1.07-1.54)
Triglyceride (Ref: < 120 mg/dL) 120-150 1.35 (1.03-1.76) 1.34 (1.03-1.76) 1.33 (1.02-1.74) 1.33 (1.02-1.74)
≥ 150 2.10 (1.68-2.62) 2.11 (1.69-2.63) 1.98 (1.59-2.48) 2.00 (1.60-2.50)
HDL-C (Ref: ≥ 50 mg/dL) < 35 0.97 (0.72-1.32) 0.99 (0.73-1.34) 0.96 (0.71-1.29) 0.96 (0.71-1.31)
35-49 0.92 (0.74-1.15) 0.93 (0.74-1.16) 0.92 (0.73-1.14) 0.92 (0.74-1.15)
FPG (Ref: 90-100 mg/dL) < 90 0.52 (0.42-0.64) 0.54 (0.43-0.67) 0.56 (0.45-0.70) 0.58 (0.47-0.72)
≥ 100 3.20 (2.41-4.24) 3.16 (2.38-4.19) 3.09 (2.33-4.10) 3.05 (2.30-4.05)
HbA1c (Ref: < 5.5%) ≥ 5.5 2.07 (1.66-2.59) 2.05 (1.64-2.55)
GPS-36 1.05 (1.03-1.06) 1.03 (1.02-1.05) 1.04 (1.02-1.07)
GPS-36 (weighted) 1.06 (1.03-1.08) 1.04 (1.02-1.07) 1.03 (1.01-1.05)
1) Discrimination
 AUC (95% CI) 0.629 (0.604-0.655) 0.643 (0.617-0.669) 0.713 (0.687-0.738) 0.719 (0.694-0.744) 0.735 (0.711-0.760) 0.740 (0.716-0.765)
P value for contrast 0.047 0.041 0.050
2) Calibration
 Hosmer-Lemeshow χ2 (P) 8.84 (0.3556) 7.74 (0.4595) 6.65 (0.5750) 9.66 (0.2898) 14.14 (0.0781) 10.96 (0.2041)
3) Reclassification
 IDI, (SE) 0.0086 (0.0018) 0.005 (0.0016) 0.0041 (0.0015)
P value < 0.001 0.003 0.007
 NRI, (SE) 0.0863 (0.0239) 0.0440 (0.0175) 0.0173 (0.0185)
P value < 0.001 0.012 0.352

Range of risk alleles scores (GPS-36); 0-72. Model 1 (simple model) adjusted for age, BMI, family history of T2DM, HTN history, regular physical exercise±risk alleles; model 2 (clinical model), adjusted for variables in model 1 plus triglyceride, HDL-cholesterol, FPG±risk alleles; model 3, adjusted for all variables in model 3±risk alleles. Risk classification in NRI analysis: 10%, 20%, 30%. T2DM, type 2 diabetes mellitus; GPS, genetic predisposition score; HDL, high-density lipoprotein; FPG, fasting plasma glucose; HbA1c, glycated hemoglobin A1c; HOMA-IR, homeostasis model assessment of insulin resistance index; AUC, area under the curve; IDI, integrated discrimination improvement; NRI, net reclassification improvement.

ACKNOWLEDGEMENTS

The authors would like to acknowledge Min Jin Go and Nam Hee Kim at Center for Genome Science, Korea National Institute of Health, Korea Center for Disease Control for technical assistance.
This study was provided with biospecimens and data from the Korean Genome Analysis Project (4845-301), the Korean Genome and Epidemiology Study (4851-302), and Korea Biobank Project (4851-307, KBP-2013-000) that were supported by the Korea Center for Disease Control and Prevention, Republic of Korea.

Notes

DISCLOSURE The authors have no conflicts of interest to disclose.

AUTHOR CONTRIBUTION Manuscript conception and preparation: Park HY, Hong YC. Data collection and analysis: Park HY. Internal review for draft: Park HY, Choi HJ. Manuscript approval: All authors.

References

1. Zeggini E, Scott LJ, Saxena R, Voight BF, Marchini JL, Hu T, de Bakker PI, Abecasis GR, Almgren P, Andersen G, et al. Wellcome Trust Case Control Consortium. Meta-analysis of genome-wide association data and large-scale replication identifies additional susceptibility loci for type 2 diabetes. Nat Genet. 2008; 40:638–645.
2. Voight BF, Scott LJ, Steinthorsdottir V, Morris AP, Dina C, Welch RP, Zeggini E, Huth C, Aulchenko YS, Thorleifsson G, et al. MAGIC investigators. GIANT Consortium. Twelve type 2 diabetes susceptibility loci identified through large-scale association analysis. Nat Genet. 2010; 42:579–589.
3. Manolio TA, Collins FS, Cox NJ, Goldstein DB, Hindorff LA, Hunter DJ, McCarthy MI, Ramos EM, Cardon LR, Chakravarti A, et al. Finding the missing heritability of complex diseases. Nature. 2009; 461:747–753.
4. Herder C, Roden M. Genetics of type 2 diabetes: pathophysiologic and clinical relevance. Eur J Clin Invest. 2011; 41:679–692.
5. Meigs JB, Shrader P, Sullivan LM, McAteer JB, Fox CS, Dupuis J, Manning AK, Florez JC, Wilson PW, D'Agostino RB Sr, et al. Genotype score in addition to common risk factors for prediction of type 2 diabetes. N Engl J Med. 2008; 359:2208–2219.
6. Talmud PJ, Hingorani AD, Cooper JA, Marmot MG, Brunner EJ, Kumari M, Kivimäki M, Humphries SE. Utility of genetic and non-genetic risk factors in prediction of type 2 diabetes: Whitehall II prospective cohort study. BMJ. 2010; 340:b4838.
7. Lyssenko V, Jonsson A, Almgren P, Pulizzi N, Isomaa B, Tuomi T, Berglund G, Altshuler D, Nilsson P, Groop L. Clinical risk factors, DNA variants, and the development of type 2 diabetes. N Engl J Med. 2008; 359:2220–2232.
8. Bao W, Hu FB, Rong S, Rong Y, Bowers K, Schisterman EF, Liu L, Zhang C. Predicting risk of type 2 diabetes mellitus with genetic risk models on the basis of established genome-wide association markers: a systematic review. Am J Epidemiol. 2013; 178:1197–1207.
9. Willems SM, Mihaescu R, Sijbrands EJ, van Duijn CM, Janssens AC. A methodological perspective on genetic risk prediction studies in type 2 diabetes: recommendations for future research. Curr Diab Rep. 2011; 11:511–518.
10. Vassy JL, Meigs JB. Is genetic testing useful to predict type 2 diabetes? Best Pract Res Clin Endocrinol Metab. 2012; 26:189–201.
11. Cho YS, Chen CH, Hu C, Long J, Ong RT, Sim X, Takeuchi F, Wu Y, Go MJ, Yamauchi T, et al. Meta-analysis of genome-wide association studies identifies eight new loci for type 2 diabetes in east Asians. Nat Genet. 2012; 44:67–72.
12. Lim NK, Park SH, Choi SJ, Lee KS, Park HY. A risk score for predicting the incidence of type 2 diabetes in a middle-aged Korean cohort: the Korean genome and epidemiology study. Circ J. 2012; 76:1904–1910.
13. Ryoo H, Woo J, Kim Y, Lee C. Heterogeneity of genetic associations of CDKAL1 and HHEX with susceptibility of type 2 diabetes mellitus by gender. Eur J Hum Genet. 2011; 19:672–675.
14. Shu XO, Long J, Cai Q, Qi L, Xiang YB, Cho YS, Tai ES, Li X, Lin X, Chow WH, et al. Identification of new genetic risk variants for type 2 diabetes. PLoS Genet. 2010; 6:e1001127.
15. Speliotes EK, Willer CJ, Berndt SI, Monda KL, Thorleifsson G, Jackson AU, Lango Allen H, Lindgren CM, Luan J, Mägi R, et al. Association analyses of 249,796 individuals reveal 18 new loci associated with body mass index. Nat Genet. 2010; 42:937–948.
16. Collett D. Modelling survival data in medical research. 2nd ed. Boca Raton, Fla.: Chapman & Hall/CRC;2003.
17. Vassy JL, Durant NH, Kabagambe EK, Carnethon MR, Rasmussen-Torvik LJ, Fornage M, Lewis CE, Siscovick DS, Meigs JB. A genotype risk score predicts type 2 diabetes from young adulthood: the CARDIA study. Diabetologia. 2012; 55:2604–2612.
18. Pencina MJ, D' Agostino RB, D' Agostino RB Jr, Vasan RS. Evaluating the added predictive ability of a new marker: from area under the ROC curve to reclassification and beyond. Stat Med. 2008; 27:157–172.
19. Heianza Y, Arase Y, Hsieh SD, Saito K, Tsuji H, Kodama S, Tanaka S, Ohashi Y, Shimano H, Yamada N, et al. Development of a new scoring system for predicting the 5 year incidence of type 2 diabetes in Japan: the Toranomon Hospital Health Management Center Study 6 (TOPICS 6). Diabetologia. 2012; 55:3213–3223.
20. Schulze MB, Weikert C, Pischon T, Bergmann MM, Al-Hasani H, Schleicher E, Fritsche A, Häring HU, Boeing H, Joost HG. Use of multiple metabolic and genetic markers to improve the prediction of type 2 diabetes: the EPIC-Potsdam Study. Diabetes Care. 2009; 32:2116–2119.
21. Selvin E, Steffes MW, Zhu H, Matsushita K, Wagenknecht L, Pankow J, Coresh J, Brancati FL. Glycated hemoglobin, diabetes, and cardiovascular risk in nondiabetic adults. N Engl J Med. 2010; 362:800–811.
22. Kwak SH, Park KS. Genetics of type 2 diabetes and potential clinical implications. Arch Pharm Res. 2013; 36:167–177.
23. Tabara Y, Osawa H, Kawamoto R, Onuma H, Shimizu I, Makino H, Kohara K, Miki T. Genotype risk score of common susceptible variants for prediction of type 2 diabetes mellitus in Japanese: the Shimanami Health Promoting Program (J-SHIPP study). Development of type 2 diabetes mellitus and genotype risk score. Metabolism. 2011; 60:1634–1640.
24. Yang L, Zhou X, Luo Y, Sun X, Tang Y, Guo W, Han X, Ji L. Association between KCNJ11 gene polymorphisms and risk of type 2 diabetes mellitus in East Asian populations: a meta-analysis in 42,573 individuals. Mol Biol Rep. 2012; 39:645–659.
25. Gloyn AL, Pearson ER, Antcliff JF, Proks P, Bruining GJ, Slingerland AS, Howard N, Srinivasan S, Silva JM, Molnes J, et al. Activating mutations in the gene encoding the ATP-sensitive potassium-channel subunit Kir6.2 and permanent neonatal diabetes. N Engl J Med. 2004; 350:1838–1849.
26. Billings LK, Florez JC. The genetics of type 2 diabetes: what have we learned from GWAS? Ann N Y Acad Sci. 2010; 1212:59–77.
27. Shea J, Agarwala V, Philippakis AA, Maguire J, Banks E, Depristo M, Thomson B, Guiducci C, Onofrio RC, Kathiresan S, et al. Myocardial Infarction Genetics Consortium. Comparing strategies to fine-map the association of common SNPs at chromosome 9p21 with type 2 diabetes and myocardial infarction. Nat Genet. 2011; 43:801–805.
28. Patel CJ, Chen R, Kodama K, Ioannidis JP, Butte AJ. Systematic identification of interaction effects between genome- and environment-wide associations in type 2 diabetes mellitus. Hum Genet. 2013; 132:495–508.
29. Ezzati M, Riboli E. Behavioral and dietary risk factors for noncommunicable diseases. N Engl J Med. 2013; 369:954–964.
30. Temelkova-Kurktschiev T, Stefanov T. Lifestyle and genetics in obesity and type 2 diabetes. Exp Clin Endocrinol Diabetes. 2012; 120:1–6.

Supplementary Material

Supplementary Table 1

Evaluation of T2DM risk prediction with consideration for age and genetic predisposition derived from selected SNPs (GPS-3, GPS-18, GPS-36)

Supplementary Table 2

Effect of genetic predisposition on (a) baseline HbA1c or (b) change of HbA1c
TOOLS
ORCID iDs

Hye Yin Park
https://orcid.org/http://orcid.org/0000-0003-4144-1534

Hyung Jin Choi
https://orcid.org/http://orcid.org/0000-0003-0593-6978

Yun-Chul Hong
https://orcid.org/http://orcid.org/0000-0001-9010-7271

Similar articles