

 PDF
PDF ePub
ePub Citation
 Print
Print


INTRODUCTION
Hip fractures in elderly patients are most serious consequence of osteoporotic fractures and can result in significant morbidity, loss of independence, and high mortality. Many longitudinal cohort studies have conducted over the past several decades have evaluated the trends of hip fracture incidence using population-based or medical claims data. Recently, decreasing trends of hip fracture incidence were reported in several developed countries including Australia (1), Denmark (2), France (3), Norway (4), Sweden (5), Canada (6), and other North American countires (7). However, little longitudinal cohort study has been performed in a developing country.
Beginning in 2002, we undertook a cohort study regarding osteoporotic hip fracture. Jeju Island, the study site, is geographically isolated from the Korean peninsula; and patients with hip fractures typically require hospitalization, which makes ascertainment easier and much more reliable than other types of fractures (8). In addition, all of the hospitals in the area were included in the study, and all of the patient data including medical records and radiographies could be reviewed (8). We previously performed a hip fracture survey in the Jeju cohort and found that the incidence of hip fractures increased from 2002 to 2006 (8). We extended the study period to 2011.
The purpose of the present study was to assess the trends of annual incidence of hip fracture and the mortality after hip fracture in the Jeju cohort ≥ 50 yr of age over a period of a decade.
MATERIALS AND METHODS
Subjects
In 2011, Jeju Island (the biggest island of Korea, which is located southwest of the Korean peninsula) had a population of 576,156 including 74,985 men and 90,481 women ≥ 50 yr of age, with 12.1% being ≥ 65 yr of age (9.3% of men and 14.9% of women). There were eight hospitals (one university hospital and seven general hospitals) which had an orthopedic department and emergency admission facilities (8). The medical records of and radiographies of patients taken from the eight hospitals between January 2002 and December 2011 were reviewed to identify patients who had hip fractures. Patients were recruited who met the diagnostic criteria for femoral neck and intertrochanteric fractures of the International Classification of Diseases (Tenth Revision, ICD-10: S720 and S721) and who were also aged 50 yr or older after reviewing radiologic and medical records regarding trauma history and residence in study cohort at the time of fracture diagnosis (8). The exclusion criteria were non-residents of Jeju Island, high energy injury (traffic accident and fall from height), pathological bone fractures (metastasis), isolated fractures of greater trochanter or lesser trochanter, and fractures of the subtrochanteric region due to high energy injuries. All enrolled patients were analyzed for age, gender, seasonal variations, and type of fracture.
Of the 2,055 hip fractures, 98 patients (13 men and 85 women) experienced second hip fracture between 2002 and 2011. Survival duration in 98 sec hip fracture was indexed at the time of second hip fracture. Mortality status were identified using hospital records and/or by interviewing with patient's family. A systemic search for death certificates at the National Statistical Office was conducted for patients who were lost to follow-up.
Statistical analyses
The denominator to calculate the crude fracture incidence was the mid-year population of each year (the population at July 1 of each year). We used the resident population data released annually by the Korea National Statistical Office to calculate the mid-year population, which was the mean of two populations of two consecutive years (8). For example, the mid-year population of Jeju Island in 2002 was calculated as (registered population in 2001 + registered population in 2002) ÷ 2. The age-adjusted and gender-specific incidence rate (per 100,000 person-years) were calculated based on the general population of Korea during each year. The annual numbers of mortality (those who died within 30, 180, and 365 days after hip fracture) were recorded. The mortality rates at 30, 180, and 365 days after the index date for the gender-specific group were calculated by dividing the numbers of deaths by the numbers of hip fracture episodes of the corresponding gender specific groups (9). Poisson and logistic regression models were used to examine the trends in hip fracture incidence and mortality, respectively (9). Year of occurance, gender, and age group were used as independent variables. In the Poisson model, the age-sex-specific population was used as an offset population. To assess the heterogeneity in the effect of these factors on trends, all pair-wise interaction terms between them were included in the model. Insignificant interaction terms were removed to obtain the final model.
To compare the incidence of the hip fractures between the Jeju Island cohort and other geographic areas, we used age-standardized incidence rates, which are weighted averages of the age-specific incidence rates of people in the corresponding age groups in a standard population, which in this case was estimated for the population of the United States in 2008 (10, 11).
RESULTS
There were 2,055 hip fractures, 1,042 femoral neck fractures (50.7%), and 1,013 intertrochanteric fractures (49.3%) in 406 men and 1,551 women during the study periods. The mean age of the patients was 78.9 yr (72.2 yr in men [range, 50-97 yr] and 80.6 yr in women [range, 50-105 yr]). The fractures occurred during winter in 604 hips (29.4%), fall in 513 (25.0%), spring in 488 (23.7%), and summer in 450 (21.9%).
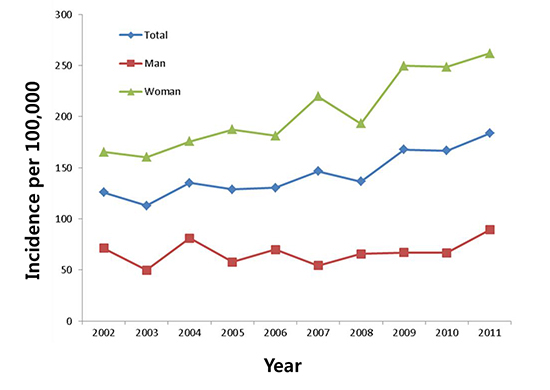
The annular number of hip fractures increased two-fold over the 10 yr of the study (151 in 2002 and 304 in 2011) (Fig. 1). The increase in the number of individuals older than 50 yr in the general population was 37.9% (120,022 in 2002 and 165,466 in 2011).
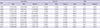
The crude incidence of hip fractures in the Jeju population aged 50 yr and older increased from 126.6/100,000 in 2002 (70.9/100,000 in men and 167.9/100,000 in women) to 183.7/100,000 in 2011 (89.4/100,000 in men and 261.9/100,000 in women). The standardized incidence of hip fracture to the general Korean population aged 50 yr and older increased from 102.8/100,000 in 2002 (71.2/100,000 in men and 129/100,000 in women) to 146.2/100,000 in 2011(86.7/100,000 in men and 197.9/100,000 in women) (Table 1). However, the standardized incidence of hip fracture in the general Korean population was lower than the crude incidence of hip fracture in the Jeju cohort.
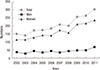
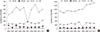
In terms of the gender-specific distribution of hip fractures from 2002 to 2011, the increase in incidence of hip fracture of women (56%) was more than that of men (26.1%). The annual growth rate of hip fracture was 4.3% (5.3% in women and 2.2% in men) during these 10 yr. The proportion of hip fracture incidence in the age-specific incidence for 10-yr age groups showed a similar pattern during the 10-yr study period. The mean age-specific incidence by 10-yr age groups increased from 18.1/100,000 for those aged 50-59 yr to 1,052.5/100,000 for those ≥85 yr of age in women and 23.8/100,000 to 605.8/100,000 in men (Fig. 2). In terms of gender differences, although the hip fracture rates of both genders increased substantially for those older than 70 yr, the incidence of hip fractures in women increased more rapidly (Fig. 2). In addition, 70-79 age group in man and over the eighty group in woman shows higher increasing incidence rate (Fig. 3A and B).
Poisson regression models showed a significant increasing trend of the incidence rate of hip fractures (P value<0.001). The rate of increase was significant between the age groups (age-year interaction with P value<0.001). However, there was no gender difference (gender-year interaction with P value 0.096).
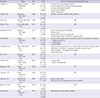
The fracture incidence in the population standardized to the 2008 population of the United States increased from 100.6/100,000 for men and 194.4/100,000 for women in 2002 to 114.2/100,000 for men and 278.4/100,000 for women in 2011 (Table 2). The annual increase in rate of hip fracture incidence was 4.3% (5.3% in women and 2.2% in men) (Table 3).
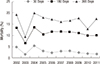
The mortality rate of hip fracture at 365 days was similar, 19.2% in 2002 to 17.1% in 2011 (Fig. 3). The mean mortality rate at 30 days, 180 days, and 365 days were 2.7% (3.3% in men, 2.5% in women), 10.8% (12.9% in men, 10.3% in women), and 16.3% (19.5% in men, 15.5% in women), respectively. Poisson regression did not show significant trend in the (30/180/365-day) mortality rates for all age groups and both genders (Fig. 4).
DISCUSSION
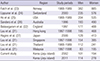
The long-term change of incidence of hip fracture has been reported since the 1990s. Studies conducted in Australia (1), Denmark (12), Canada (6), Switzerland (13), USA (14), and Sweden (5) consistently reported a 1% to 3.5% of annual decrease in age-adjusted incidence rate of hip fracture in this decade. In contrast, Germany (15), Mexico (16), Singapore (17), and Finland (18) reported a 0.7% to 3.2% increase in age-adjusted hip fracture incidence rate in this decade. In this study, the trend of hip fracture exhibited a steep rise of up to 45% of age-adjusted hip fracture incidence rate during the study period with an average annual increase of 4.3%. To our knowledge, this finding is the highest incidence reported to date (3, 5, 6, 12, 13, 15, 16, 17, 18, 19, 20) (Table 3).
Suggested reasons for the decreasing trend of hip fracture incidence include a healthy life-style, drug therapy for osteoporosis, and fall prevention programs (6, 12, 13, 14, 19). The exact reasons are still unknown. The increasing trend of hip fractures in Mexico was attributed to a lower level of physical activity, urbanization that has resulted in a progressive increase in harder surfaces, and an increasing elderly population (16). In our cohort, the increasing trend of hip fractures might reflect the rate of the elderly population, which is the highest in the world. Korea became an aging society (elderly population ≥7% of the total population) in 2000. In 2018, Korea will become an aged society (defined as an elderly population ≥14% of the total population), and by 2026 will be a super-aged society (elderly population ≥20% of the total population).
The age group with the highest change in incidence of hip fractures has also been showing a specific trend (5, 16, 18, 21). In Mexico and Finland, the largest increase in the incidence of hip fractures is in those over 75 yr of age (16, 18). Bergstrom et al. reported an overall decrease in hip fracture rates in Sweden, but with the curve shifted towards the older portion of the population (5). The same authors reported a 114% increase in fracture incidence in women aged 90 yr or older over a 10-yr period. A similar trend was also reported by Dimai et al. (21). However, the trend was reversed in developed countries like Australia, Switzerland, France, and the US, where there was reduction in the incidence in the older age groups (3, 13, 19, 20). Our cohort showed a steep rise and shift in the fracture incidences of those ≥75 yr of age (Table 2) and 70-79 age group in man and over the eighty group in woman shows higher increasing incidence rate. These findings are consistent with a country moving towards becoming an aged society.
The rate of hip fractures in Korea is similar to reports from population-based studies in South East Asia (Thailand and Malaysia) and Mexico (8, 22). However, in this study, the standardized incidence of hip fracture in 2011 was higher than that in Thailand and Malaysia (22). The incidence of hip fracture in this cohort was still lower than the rates from other advanced Asian countries (Japan, Hong Kong, and Singapore), Norway, Australia, Switzerland, England, and the US (22, 23, 24, 25, 26, 27, 28).
In this study, mortality rate was not changed from 2002 to 2011. These findings are similar to another study. Chau et al. (9) performed post-fracture mortality analysis from 2001 to 2009 among the population aged 65 yr and over in Hong Kong. They reported no change in post-fracture mortality trends. Yoon et al. (29) reported mortality rate following hip fracture using nationwide claim data in Korea. They reported that crude mortality within 12 months after hip fracture showed a similar trend (18.8% in 2005 and 17.8% in 2007).
This study has several limitations. Firstly, study periods were not consistent compared to other regions. Although we standardized all data for comparison, these data could not reflect recent incidence of hip fracture. Secondly, index age for gathering incidence of hip fracture was diverse and might have confounded comparison of the incidence of hip fracture. Third, the population of the Jeju cohort was relatively small and contained a higher portion of elderly population (12.1% being ≥65 yr of age) than the general Korean population (10.9% being ≥65 yr of age). The crude incidence of hip fracture was higher than the age adjusted incidence of the general Korean population, as shown in Table 1. However, Jeju island that is isolated from mainland has unique advantage for hip fracture cohort study because patients with hip fracture have to visit hospitals in Jeju island and get permission for using airplane to transfer mainland. Therefore, we sure that incidence of hip fracture in this study is reliable and representative. Finally, this study did not evaluate the cause of death. Although most deaths were related with aggravation of their comorbidities, deaths such as traffic accident and suicide are different causal factors and not related with hip fracture (30). Therefore, mortality following hip fracture in this study might be included deaths unrelated of hip fracture.
Our study showed a trend of steeply increasing hip fracture incidence in women. We have to start preparing nationwide strategies, and we have to establish preventive programs and guidelines to minimize complications after hip fracture to reduce the socioeconomic burden.

 XML Download