

 PDF
PDF ePub
ePub Citation
 Print
Print


INTRODUCTION
Left ventricular hypertrophy (LVH) is an important risk factor in hypertensive patients and the general population. LVH can lead to a 5-10-fold increase in cardiovascular risk, which is similar to the increase seen in patients with a history of myocardial infarction (1, 2, 3, 4). LVH has important implications for assessment of the future risk of cardiovascular disease and for decision-making regarding interventions other than antihypertensive treatment, such as lipid-lowering treatment and lifestyle modifications (5). Therefore, accurate and early diagnosis of LVH is an important component of the care of patients who have hypertension and for those who do not have hypertension.
Echocardiography permits reliable, non-invasive estimation of left ventricular mass. It has proved to be a sensitive and practical tool for the detection of LVH (6). However, echocardiography is not affordable for community-wide screening for LVH because it is expensive, and measurements of LV mass are time-consuming. Hence, simple tools are needed to facilitate the identification and screening of LVH in hypertensive patients and the general population.
Until recently, electrocardiography (ECG) was a simple and acceptable tool for screening LVH in the general population. More than 30 ECG indices for the diagnosis of LVH based on standard 12-lead ECG have been described. However, the diagnostic values of various indices are modest because they have high specificity but very low sensitivity. Furthermore, the accuracy of ECG criteria for the detection of LVH was evaluated in Western countries. The diagnostic value of these indices in Asian populations is not clear because of physiological and genetic differences.
Natriuretic peptide acts a counter-regulatory hormone in a compensatory response to pressure and volume overload in LVH (7). N-terminal pro-B-type natriuretic peptide (NT-proBNP) has been positively associated with, LV strain, activation of the renin-angiotensin-aldosterone system, myocardial fibrosis and myocyte necrosis (8, 9). In addition, recent evidence suggests that NT-proBNP could have a role in the diagnosis of LVH (10, 11). Whether measurement of NT-proBNP levels can be an additional tool for LVH screening in the general population is not known.
Here, we compared the diagnostic accuracy of ECG criteria alone with a combination of measurements of ECG and of NT-proBNP levels for the detection of LVH in a rural population in Korea. We hypothesized that the latter could improve the detection of LVH compared with ECG alone.
MATERIALS AND METHODS
Study population
The Korean Genome and Epidemiology Study on Atherosclerosis Risk of Rural Areas in the Korean General Population (KoGES-ARIRANG) is a population-based prospective cohort study to assess the prevalence, incidence and risk factors for chronic degenerative disorders such as hypertension, diabetes mellitus (DM), osteoporosis, and cardiovascular disease (12, 13, 14, 15, 16). We used ancillary data from KoGES-ARIRANG. KoGES-ARIRANG invited all adults aged 40-70 yr who resided in the rural areas of Wonju and Pyengchang in Korea to participate in the study (12, 13, 14, 15, 16).
In the present study, we investigated 343 adults from the KoGES-ARIRANG cohort (n=1,954) who had previously undergone ECG, echocardiography, and measurement of NT-proBNP levels. For the present study, all participants underwent a complete cardiovascular evaluation following 8 hr of fasting at first visit day, which included: 1) history, physical examination, and anthropometric analysis; 2) measurement of heart rate and blood pressure (BP, measured after 10 min resting in a sitting position, was expressed as the average of three consecutive measurements taken from each arm); 3) measurement of fasting serum glucose and insulin levels (in subjects not receiving insulin and/or oral hypoglycemic agents); 4) measurement of fasting plasma lipids (i.e., concentrations of triglyceride, high-density lipoprotein cholesterol [HDL-C], total cholesterol, and low-density lipoprotein cholesterol [LDL-C]); 5) measurement of NT-proBNP; and 6) echocardiography and electrocardiography (12, 13, 14, 15, 16). Past medical histories of subjects such as hypertension, diabetes mellitus and dyslipidemia were based on history taking. Subjects with systolic dysfunction (ejection fraction ≤55%, n=127) or renal dysfunction (estimated glomerular filtration rate <60 mL/min/ 1.73 m2 , n=154) were excluded from the analysis (17).
Echocardiography
Echocardiography was undertaken by 3 cardiologists in harmonic imaging mode by use of a 3-MHz transducer and commercial ultrasound system (Vivid-7; General Electric-Vingmed, Milwaukee, WI, USA). All echocardiographic data were analyzed off-line using a dedicated automated software (EchoPAC PC, Version 112; GE Health Care, Milwaukee, WI).
The internal dimensions, wall thickness, and ejection fraction of the left ventricle (i.e., LVEF, by the modified Simpson's rule) were measured according to recommendations (18). LV mass was calculated as recommended by the American Society of Echocardiography using the equation: LV mass=1.04×([PW +VS+LVDd]3-[LVDd]3)×0.8+0.6 where PW is the M-mode thickness of the posterior wall of the LV, VS is the M-mode thickness of the interventricular septum, and LVDd is the M-mode LV dimension in the short-axis view at end-diastole (12, 19). To correct for body surface area, the LV mass index (LVMI) was calculated as LV mass/body surface area. Body surface area (BSA) was calculated using the formula: BSA=0.007184×weight0.425 ×height0.725 (m2). LVH was defined as LVMI >95 g/m2 for females and >115 g/m2 for males (17). Relative wall thickness (RWT), which increases with concentric remodeling and concentric hypertrophy, was calculated as 2×PW/LVDd. Three left atrial (LA) dimensions were used to calculate LA volume as an ellipse using the formula: LA volume=π/6 (SA1 · SA2 · LA) where SA1=M-mode LA dimension, and SA2 and LA are measurements of the short- and long-axis with the apical four-chamber view at ventricular end-systole, respectively (17). The LA volume index was calculated by dividing the LA volume by the BSA (m2 ). Transmitral inflow velocities were measured using pulsed-wave Doppler (PWD) ultrasound and the apical four-chamber view, with the sample volume placed at the tips of mitral-valve leaflets. Measurements of transmitral early diastolic (E-wave) and atrial (A-wave) velocities were taken to calculate the E/A ratio and E-wave deceleration time. Tissue Doppler imaging (TDI) and the apical four-chamber view were used to measure LV myocardial velocities, with the sample volume placed at the septal mitral annulus (12, 20, 21). Measurements comprised the early diastolic velocity (E') and late diastolic velocity (A'). The E/E' ratio was then calculated (12, 22).
ECG
A standard, at rest, 12-lead recording was made during quiet respiration, with subjects in the supine position. The electrocardiogram was recorded at 25 mm/s and 0.1 mV/mm standardization. ECG criteria for the diagnosis of LVH were the Sokolow-Lyon criteria (S in V1+R in V5 or V6 [whichever was larger] >35 mm) and the Cornell voltage criteria (S in V3+R in aVL >28 mm in males, and S in V3+R in aVL >20 mm in females) (23, 24).
Measurement of plasma levels of NT-proBNP
Blood samples were obtained from fasting participants in the morning. Subjects were in the supine position, and blood obtained from the antecubital vein. Samples were transferred immediately to pre-chilled tubes containing ethylenediamine tetra-acetic acid and then stored at -70℃ for future analyses (25). Plasma levels of NT-proBNP were measured using an electrochemiluminesence assay (Elecsys 2010® Roche Diagnostics, Indianapolis, IN, USA) using established methods (26). The lower limit of detection was 4 pg/mL. The mean coefficient variation for these samples was 2.7%.
Statistical analyses
Statistical analyses were carried out using SPSS v20 (SPSS, Chicago, IL, USA). Data are the mean±standard deviation for continuous variables and as proportions for categorical variables. The chi-square test was used to determine differences in categorical variables between groups. Sensitivity was defined as the number of true-positive tests divided by the total number of patients with LVH as defined by echocardiography. Specificity was defined as the number of true-negative tests divided by the total number of patients who did not have LVH. The BNP level was log-transformed to achieve normality and correlation analyses undertaken. To evaluate the added discrimination provided by NTproBNP levels to detect LVH beyond the information provided by ECG criteria, we compared the areas under the receiver-operator curves (ROCs) in models employing ECG criteria with and without NTproBNP levels. Areas under ROC curves and the strength of the relationship were compared using MedCalc v11.0 (MedCalc, Mariakerke, Belgium). A two-sided P<0.05 was considered to be significant.
RESULTS
Demographic and clinical characteristics
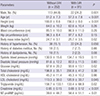
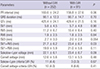
The demographic and clinical characteristics of the 343 subjects (mean age, 52.8±7.9 yr; 39.4% males) were reported according to the presence of LVH (Table 1). The prevalence of LVH was 26.5% and was significantly higher in females (16.3% of males and 33.2% of females, P<0.001). Subjects with LVH were older and shorter compared with subjects who did not have LVH. Fasting blood glucose and triglyceride levels were significantly lower in the LVH group. The body mass index (BMI) was significantly higher in the LVH group (25.7±3.5 vs. 24.7±3.1 kg/m2 , P=0.02).
Echocardiographic characteristics
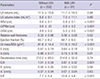
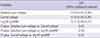
The mean LVEF was 65.4±6.5%. In subjects with LVH, LVMI was 117.8±19.2 g/m2 , and LV geometry showed enlarged LV dimensions (5.3±0.5 vs. 4.9±0.5 cm, P<0.001) and thicker walls (0.36±0.08 vs. 0.33±0.06, P=0.02) (Table 2). LVEF was not different according to the presence of LVH. The mitral E velocity was similar between groups, but the A velocity was increased in the LVH group (0.74±0.19 vs. 0.68±0.17 m/s, P=0.01). As a result, the E/A ratio decreased (0.87±0.32 vs. 1.01±0.34, P=0.001). TDI revealed an elevated E/E' ratio in the LVH group (10.6±5.6 vs. 7.7±5.4, P<0.001).
Characteristics and performance of ECG
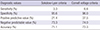
ECG characteristics according to the presence of LVH are demonstrated in Table 3. The prevalence of LVH as defined by Sokolow-Lyon criteria and by the Cornell voltage criteria was 4.1% and 4.7%, respectively. ECG characteristics, including the Sokolow-Lyon voltage and Cornell voltage, were not significantly different regardless of LVH (Table 3). However, the Sokolow-Lyon voltage was correlated with the LVMI (r=0.18, P=0.001), as was the Cornell voltage (r=0.16, P=0.003). The strengths of the relationships were not significantly different for ECG criteria with the LVMI (P=0.83) (Table 4). The performance of the tested ECG criteria for the echocardiographic diagnosis of LVH was assessed in terms of sensitivity and specificity (Table 5). Both ECG criteria showed low sensitivity and high specificity. The Sokolow-Lyon criteria had 3.3% sensitivity, 95.6% specificity, 21.4% positive predictive value, and 73.3% negative predictable value. The criteria for the Cornell voltage had a sensitivity of 6.6%, a specificity of 99.2%, a positive predictive value of 37.5%, and a negative predictable value of 74.0%. The accuracy of the Sokolow-Lyon criteria was 71.1% and that of the Cornell voltage criteria was 72.3%.
Characteristics of NT-proBNP and combined test performance
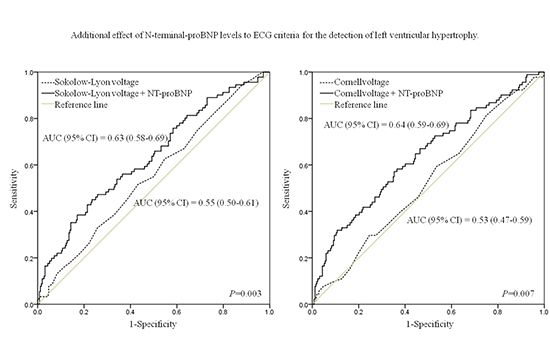
The mean level of NT-proBNP was 44.6±49.9 pg/mL, which was significantly higher in subjects with LVH (58.4±51.1 vs. 39.6±48.7 pg/mL, P<0.01) (Table 1). The NT-proBNP level was correlated with the LVMI (r=0.17, P=0.002). The strengths of relationships were similar for the BNP level and for ECG criteria with the LVMI (Table 4). The area under the ROC to detect LVH was 0.55 (95% confidence interval [CI], 0.50-0.61) using the Sokolow-Lyon criteria and 0.53 (0.47-0.59) using the Cornell voltage criteria. After adding NT-proBNP levels to the model, the corresponding areas under the ROC were 0.63 (0.58-0.69) and 0.64 (0.59-0.69), respectively. P-values for the comparison in areas under the ROC for models with and without NT-proBNP levels were <0.001 (Fig. 1).
DISCUSSION
The present study evaluated the diagnostic performance of NT-proBNP levels when added to ECG criteria for the detection of LVH in a Korean community-based population. This study demonstrated the low sensitivity and high specificity of ECG criteria. Overall, the area under the curve (AUC) for both ECG criteria for the detection of LVH was ≤0.61, which severely limits the potential of using ECG as a screening tool for LVH. Addition of NT-proBNP levels to ECG criteria improved discriminating power for the detection of LVH in our general population.
LVH has been shown to be an independent risk factor for adverse cardiovascular events (3, 27). As such, early identification of LVH patients is critical for risk stratification. Given its low cost, availability and prognostic significance, ECG is recommended to be the diagnostic screening method for evaluation of LVH (28). However, studies have shown the median sensitivity to range from 15% (range, 2%-41%) for the Cornell voltage criteria to 21% (4%-52%) for the Sokolow-Lyon index. The median specificity has been reported to range from 89% (53%-100%) for the Sokolow-Lyon index to 96% (91%-100%) for the Cornell voltage criteria (29). However, data evaluating the accuracy of ECG criteria for the detection of LVH in Korea are limited. In a small study conducted in Korea, the sensitivity and specificity of the Sokolow-Lyon index were found to be 11.3% and 95.5% and those of the Cornell voltage criteria to be 1.4% and 100%, respectively (30). The present study is the first to evaluate the accuracy of ECG criteria in a Korean general population. We demonstrated the low sensitivity and high specificity of ECG criteria. Irrespective of the index used, ECG was a poor screening tool for the diagnosis of LVH.
LVH is a compensatory response of the myocardium to maintain normal cardiac function in response to pressure overload and other various stimuli (31). The growth and composition of the myocardium are altered by locally produced neurohormones such as noradrenaline, angiotensin II, aldosterone, endothelin and bradykinin which, in addition to their hemodynamic effects, act directly as growth factors (32, 33, 34). Myocardial growth resulting from the increased size and protein content of myocytes is paralleled by progressive expansion of interstitial fibroblast compartments and enhanced deposition of collagen. These adaptive responses allow the heart to withstand the increased intracardiac pressures associated with overload, and increased interstitial collagen leads to reduced LV compliance, leading to diastolic dysfunction (31). Eventually, synthesis of ventricular natriuretic peptide is re-induced, and the activated natriuretic peptide system may act as a counter-regulatory mechanism against further hypertrophy. In the present study, LVH was associated with diastolic dysfunction and NT-proBNP levels were well correlated with the LVMI and E/E'. Several authors have reported on the use of BNP for the community screening of LVH, but consensus is lacking on the diagnostic performance of BNP levels. In the Framingham Heart Study, the AUC of BNP levels for the detection of elevated LV mass was 0.72 in males and 0.57 in females (11). In the Fourth Copenhagen City Heart Study, the diagnostic performance of NT-proBNP levels for the detection of LVH was 0.70 (0.66-0.74) and 0.63 (0.59-0.68) for females and males, respectively (35). In the Dallas Heart Study, investigators evaluated a multimarker strategy to improve the diagnostic performance for LVH screening. They reported that better screening could be achieved by a combination of ECG as well as levels of troponin I and NT-proBNP (AUC, 0.798 [95% CI, 0.754-0.842]), which collectively provide additional information compared with ECG alone (36). In the present study, addition of NT-proBNP level to ECG criteria improved the diagnostic performance expressed as AUC values from ROC curves compared with ECG criteria only, but the value of AUC was <0.7. Thus, addition NT-proBNP levels to ECG criteria seem to be suboptimal for diagnostic LVH screening.
Our community-based cohort reduced the possibility of spectrum bias, whereas evaluation of all subjects with both echocardiography and NT-proBNP levels eliminated verification bias. Nevertheless, the present study had important limitations. The sample size was relatively small compared with other cohort studies. It could be argued that echocardiography is an imperfect "gold standard" for the diagnosis of LVH. The cutoff value of LVH was defined by recommendations from the American Society of Echocardiography, but this cutoff value may be different in a Korean general population. Most echocardiographic data are derived from western countries but, because racial differences can influence the size and function of cardiac chambers, evaluation of the echocardiographic parameters in racial populations (37, 38, 39). There are limited data for the reference values of cardiac geometry in Asian populations. In the Japanese Normal Values for Echocardiographic Measurements Project (JAMP) study, the reference values for the LVMI were 76±16 g/m2 in males and 70±14 g/m2 in females (40). According to those results, the LVMI was small in Asian populations compared with Western populations. Also, the present study was a cross-sectional cohort study, and the prognostic significances of LVH and NT-proBNP levels were not evaluated.
In conclusion, our community-based study demonstrated that the sensitivity of ECG criteria was low and the power to rule in LVH was unsatisfactory, and that ECG cannot be considered a screening test for the diagnosis of LVH. Addition of NT-proBNP levels to ECG criteria for the detection of LVH improved the discriminating power but was suboptimal, suggesting limited usefulness as a mass screening tool. Further large-scale research is needed to identify the cutoff value for the diagnosis of LVH in Korean populations, and to develop alternative diagnostic methods for the assessment of LVH in community screening.
 XML Download