

 PDF
PDF ePub
ePub Citation
 Print
Print


INTRODUCTION
Otitis media (OM) is prevalent in infants, especially those 6-18 months old. The main cause of OM is middle-ear infections by bacteria or viruses. The disease itself can be classified into three types: acute OM, OM with effusion (OME), and chronic OM (1, 2, 3). Typically, otoscopy is used to assess the condition of the tympanic membrane (TM) surface or its mobility using pneumatic pressure. However, the standard otoscope has several weaknesses. The optics of an otoscope can visualize only the TM surface or if the TM is translucent, the presence of any effusion that might be present immediately behind the TM. This subjective observation can be problematic and no quantitative depth-resolved imaging technology exists for imaging the middle ear and assessing the characteristics of any effusion that might be present. These weaknesses often result in an incorrect diagnosis, which can subsequently affect treatment and outcomes. To address these weaknesses of standard otoscopy, we have developed the use of optical coherence tomography (OCT) for non-invasive assessment and quantification of the microstructure of the TM and middle ear, including the presence of bacterial biofilms (4, 5).
A new primary care imaging system has been developed using advanced OCT optical imaging technology (6). OCT is a non-invasive, non-contact optical imaging technology that can effectively reconstruct a depth-resolved high-resolution cross-sectional image of tissues (1-15 µm) using interferometry and a near-infrared light source (7, 8, 9, 10). In ophthalmology, OCT has become the gold standard for retinal imaging, and can detect disease by measuring the thickness of the retina or retinal nerve fiber layer (7, 11).
Recently, OCT applications have focused primarily on characterizing cancer and other disease processes in the larynx (12), because OCT is ideal for imaging the thin, layered structures of the vocal fold epithelium and lamina propria. Most OCT applications in otolaryngology of the middle and inner ear have been either animal investigations or human temporal bone studies (13, 14, 15, 16, 17, 18, 19, 20). In addition, various research groups worldwide have performed otolaryngology imaging studies using OCT (13, 21, 22, 23).
In this study, we demonstrate the wider application of OCT technology for non-invasive detection of changes and diagnosing disease associated with the human TM and various types of OM. In addition, specific features were identified in two-dimensional (2D) OCT images of abnormal TMs, compared to images of normal TMs. Analysis of A-scan (axial depth scan) data successfully identified unique patterns of constituents within effusions.
MATERIALS AND METHODS
Subjects
Among the patients with otological symptoms who visited the Department of Otorhinolaryngology at Kyungpook National University Hospital between July and October 2012, a total of 39 patients who were diagnosed with OM using a standard otoendoscopic examination and audiological tests were enrolled and the acquisition of OCT images was tried. From OCT images, the extent of OM was evaluated based on the imaging findings and audiological status. Six volunteers with normal TM on otoendoscopy were also included and OCT images of TM were acquired as a control.
OCT system
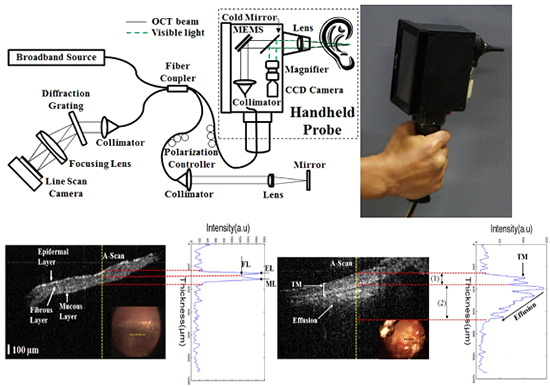
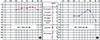
We examined the clinical use of spectral domain-OCT (SD-OCT). Fig. 1A shows a schematic of the SD-OCT system and the handheld probe used for these clinical studies. Our handheld OCT probe is roughly the same size as a standard otoscope. A 12-bit complementary metal oxide semiconductor (CMOS) line-scanning camera (AVIIVA EM4 2048 pixels, E2V, Essex, UK) with an effective line rate of 70,000 lines/s in 2048-pixel mode was used as the SD-OCT detector. A transmission-type diffraction grating (spatial frequency 1,800 lpmm, nominal AOI/AOD 46.05°; Wasatch Photonics, North Carolina, USA) was adapted to enhance the light efficiency in the detection path. The source was a superluminescent light-emitting diode (SLED) operating in high-power mode (SLD-35-HP, Superlum, Schlieren, Switzerland). The SLED has a center wavelength of ~870 nm and a spectrum with a full width at half maximum (FWHM) of ~65 nm. The SLED was connected to one end of a 2×2 (50:50) fiber-fused coupler (FC850-40-50-APC, Thorlabs, New Jersey, USA). A fiber-based Michelson interferometer was implemented. The SLED power measured after the objective lens (an achromatic lens with a focal length of 75 mm) was ~6 mW. The detected OCT signals were transferred to host memory in a computer with four Core 2 Quad Q8200 central processing units (2.33-GHz clock rate, Intel, California, USA) via a frame grabber (PCIe-1433, 850-MB/s bandwidth, National Instruments, Texas, USA) over two camera-link cables. The computer drove a galvanometer scanner using a data acquisition board (PCIe-6321, National Instruments) that could provide two analog outputs. To generate the depth-resolved sample reflectivity or A-line, the interferogram was transformed using full-range k-domain linearization (24). The magnitude of the fast Fourier transform (FFT) was computed. Real-time, high-resolution OCT imaging is possible with this system at a display speed exceeding a 250 kHz A-scan rate, and the software used was written in LabVIEW (LabVIEW 2011, National Instruments). To process signals from the camera, a frame grabber (NI: PCIe-1429) with an acquisition rate of 680 MB/s was used. To drive the galvanometer scanner, a data acquisition board (PCIe-6115, National Instruments) with a maximum sampling rate of 10 MS/s was used for each channel. Fig. 1 shows the handheld OCT probe used to acquire the TM. A miniaturized Charge-Coupled Device (CCD)-based video camera with a size of 16 mm×21 mm and 0.27 megapixel was integrated in the handheld OCT probe. A white Light-Emitting diode (LED) was located behind the focusing lens to illuminate the target site. Through this system, the orientation of OCT beam could be identified and a real image of TM surface and cross-sectional OCT image could be acquired simultaneously.
The axial resolution was 6 µm and the transverse resolution was 10 µm. The system sensitivity was approximately 101 dB near zero optical delay when the camera was set at an exposure time of 14.1 µs. The theoretical sensitivity was approximately 116 dB because the ideal efficiency of the spectrometer was 73%, and the power at the sample path was 1.8 mW. The sensitivity of the system was lower than the theoretical value, mainly because of the insertion loss (-11.6 dB) between the fiber optics and the 2D galvanometer scanner in the sample path. Losses in the other optical parts further reduced the sensitivity (-3.4 dB).
RESULTS
Of the 39 patients, OCT images were acquired from 16 patients (41.0%). The most common cause of failure to acquire an image was a narrow or curved external auditory canal (n=5). Other causes were the presence of obstacles, such as profuse otorrhea (n=3), cholesteatoma material (n=4), and cerumen (n=7), and poor compliance (n=4). OCT could not be obtained for the three patients with chronic OM with cholesteatomas. The demographic characteristics of the subjects are summarized in Table 1. The thickness of a normal TM in typical region was estimated from six volunteers using A-scan. The mean thicknesses (±SD) were 122±11.08 µm (normal TM), 326±30.28 µm (chronic OM), 251±25.37 µm (adhesive OM), and 108±9.72 µm (OME).
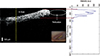
Fig. 2 shows representative OCT images and data acquired from the normal TMs of two volunteers, showing the B-mode (cross-sectional) image and an A-scan plot from the central part of the TM after image processing to obtain the thickness and structural information on the TM. While there were small differences among individuals, the normal TM was approximately 122 µm thick, which is similar with reported values (25). In addition, the epidermal, fibrous, and mucous layers of the TM were clearly identified, as reported previously (Fig. 2B) (13).
Fig. 3 shows the right and left TMs of the same patient. The right TM was normal on the otoendoscopic and OCT examinations (Fig. 3A), while the left TM is retracted and turbid on the otoendoscopic examination and non-uniformly thick in the OCT examination (Fig. 3B). The A-scan analysis indicated that the left TM was approximately four times thicker than right TM. Fig. 4 shows the audiological result for this patient. The pure tone average of four frequencies (0.5, 1, 2, and 3 kHz) was 5 dB HL in the right ear and 25 dB HL in the left. The results of the speech reception threshold (right, 5 dB; left, 30 dB) and speech discrimination (right, 100% [35dB]; left, 100% [60dB]) tests were comparable with the pure tone average. The right ear has a normal hearing level, while the left is between normal hearing and mild hearing loss. The diagnosis for the left TM was chronic OM based on the otoendoscopic and OCT findings, and the hearing status suggested that the disease was not severe.
Perforation of TM is a typical finding in chronic OM. Fig. 5 shows example otoendoscopic and OCT images. In addition to the size and location of the perforation in the otoscopic image, the thickness and characteristics of the perforation margin was evaluated with the OCT image. As seen in the A-scan, thickening and blunting of TM margin was detected in all patients with chronic OM, although the extent differed.
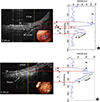
In the case of adhesive OM, the TM is retracted and in partial contact with the tympanic mucosa on otoendoscopy, as shown in Fig. 6A. Fig. 6A is an example of an OCT image of adhesive OM. The decrease in the air gap between the TM and tympanic mucosa due to the retraction is shown (Fig. 6A) (2). The OCT scattering signal intensity decreases rapidly in the low-scattering air layer after the strong peak scattering value from the TM, and a weaker scattering signal can be seen from the TM mucosa, as shown graphically by the A-scan. These findings were common to the OCT images of adhesive OM. Fig. 6B is an image of the TM of a patient with OME; the pattern is similar to that of adhesive OM in B-mode. However, unlike chronic OM, the scattering signal is attenuated gradually with increasing depth into the highly scattering effusion in the A-scan (Fig. 6B) (2).
DISCUSSION
The most favorable clinical characteristics of OCT are its noninvasiveness, lack of radiation, high resolution, and ease of office-based use. However, there are few reports on the clinical application of OCT to otology, which might be limited by the difficulty securing a light pathway for the OCT device and the diagnostic efficiency of otoendoscopy. In this study, real and OCT images were acquired simultaneously in real time, so that the findings of each imaging modality supplemented the drawbacks of the other. Our results suggest that a handheld OCT otoscope can be applied clinically to otology. Most studies of OCT in otology have involved basic research of the middle and inner ear (15, 16, 19, 20, 21) or cadaveric temporal bone (26). The first in vivo clinical study was reported by Heermann et al. (27), who coupled an OCT system to an operating microscope and they suggested that OCT is a useful measurement tool in the middle ear during ossiculoplasty. Djalilian et al. (13) obtained images of normal and pathological TMs using an OCT system coupled with an operating otoscope. They obtained cross-sectional images at one frame per second. Due to the acquisition speed, no TM images could be obtained when the patients moved. With our OCT system, images were obtained at 42 frames per second, which gave the clinician the ability to examine the TM and middle ear structure. Nguyen et al. (4) performed a clinical study using a handheld OCT otoscope and focused on the in vivo detection of biofilms, not the utility of a handheld OCT otoscope as a diagnostic tool for middle ear disease.
In this study, we evaluated normal and pathological TMs and demonstrated the advantages of the OCT images. The thickness of normal TMs was measurable and the three layers were distinguishable in the high-resolution OCT images. The mean thickness of a specific region of the normal TMs could be used as a standard parameter for evaluating abnormal TMs.
Fig. 3B, Fig. 5 are otoendoscopic and OCT images of chronic OM, which is commonly seen in outpatient departments. The pathological changes in this disease result from either acute or chronic inflammatory reactions, including edematous changes, the infiltration of inflammatory cells, and the presence of persistent bacterial biofilms. The OCT images provide tomographic information on the pathological region and facilitate evaluation of the extent or severity of disease. Given the small amount of data, we cannot draw conclusions about the relationship between the OCT image features and hearing status. However, a study of the clinical role of OCT images in finding structural differences related to the hearing level might be valuable.
OM is related to Eustachian tube dysfunction. Long-standing Eustachian tube dysfunction can create a negative pressure and resulting effusion in the middle ear cavity. OME is often recurrent due to the long-term negative pressure, and the fibrous layer of the TM is thought to become weak and overly compliant. As a result, the normal shape and position of the TM cannot be maintained, and it collapses and retracts medially. Fig. 6A is a typical finding of severe retraction. If this progresses, the inner surface of the TM attaches to the middle ear mucosa and fibrous tissue replaces the mucosa, a condition called adhesive OM. In OME, the effusion liquid and scattered suspended material are distributed evenly in the middle ear cavity, as in Fig. 6B. These examples demonstrate the added information that OCT can provide by performing depth-resolved imaging through the TM and into the middle-ear cavity, which is impossible with standard otoscopy or otoendoscopy.
As a traditional method for diagnosing OM and monitoring the treatment response, otoscopy is used to observe only the surface features of the TM, and the findings are combined with the patient's symptoms and audiometry measurements to direct therapy. These diagnostic methods using otoscopy are limited by the information that a surface image of the TM can provide. In this study, we observed sections of the TM in vivo with OCT. We demonstrated that OCT could easily confirm structures behind the TM that are invisible using standard otoscopy.
The clinical experience in this study indicated that several problems need to be resolved. The S-shaped external auditory canal is 2.5-3 cm in length and 7-9 mm in diameter. The TM is tilted in the direction of the external auditory meatus by 55° (5, 26). The extent of the curvature and the diameter of the canal influenced the acquisition of OCT images, as described in the Results. Therefore, the anterior margin of the TM was not evaluated in the case of anterior perforation and the region of attic retraction or attic cholesteatoma was not visualized using the OCT system in some cases. A system with various interchangeable speculums and miniaturized components for the handheld OCT probe is being developed. To acquire a clear image, the optic pathway should not be interrupted by obstacles, such as cerumen, otorrhea, or keratin debris; thus meticulous cleaning is needed. Lastly, the resolution and brightness of the CCD-based camera, integrated with handheld OCT probe, must be upgraded.
Based on our results, OCT has the potential to facilitate diagnosis of OM by primary care clinicians and otologists. Although further clinical trials are necessary, this groundwork shows that OCT has the potential to be the next-generation detection, diagnostic, and monitoring method for OM, and that it can complement or even potentially replace the more traditional otorhinolaryngology instruments.

 XML Download