Journal List > J Korean Med Sci > v.30(3) > 1022846

Kim, Cho, and Park: Relationship between Sarcopenic Obesity and Cardiovascular Disease Risk as Estimated by the Framingham Risk Score

Abstract

This study was conducted to assess the association between sarcopenic obesity and cardiovascular disease (CVD) risk in Korean adults (n=3,320; ≥40 yr) who participated in the 5th Korean National Health and Nutrition Examination Survey in 2010. The appendicular skeletal muscle mass divided by body weight was calculated for each participant; participants with values <1 standard deviation below the mean reference value (i.e., aged 20-39 yr) were considered sarcopenic. Subjects were further classified into 4 groups according to their obesity (i.e., body mass index ≥25 kg/m2) and sarcopenic status. Individuals' 10-yr CVD risk was determined using the Framingham risk model. The sarcopenic obese group had more participants (43.8% men, 14.6% women) with a high risk of CVD (≥20%). The sarcopenic obese group was associated with an increased 10-yr CVD risk than the non-sarcopenic, non-obese group (odds ratio [OR], 2.49; 95% confidence interval [CI], 1.53-4.06, P<0.001 in men; OR, 1.87; 95% CI, 1.02-3.41, P=0.041 in women). Sarcopenic non-obese and non-sarcopenic obese subjects were not associated with an increased 10-yr CVD risk. Sarcopenic obesity, but not non-sarcopenic obesity, was closely associated with an increased CVD risk in Korean adults.

Graphical Abstract

jkms-30-264-ab001

INTRODUCTION

Population aging and the obesity epidemic are major public health problems worldwide. Normal aging is associated with changes in body composition characterized by a relative decline in muscle mass and a progressive increase in fat mass (1). In 1989, Rosenberg proposed the term 'sarcopenia', which refers to the involuntary loss of muscle mass associated with aging (2). It is estimated that skeletal muscle decreases 8% per decade from the late 40s up to the 70s and onwards; it is known that the decrease can accelerate up to 15% per decade (1).
Sarcopenia leads to physical disability and functional impairment (i.e., impaired activities of daily living, falls, and gait disturbance) (3). Moreover, sarcopenia is known to be associated with cardiovascular disease (CVD) risk factors, such as glucose intolerance and metabolic syndrome (4, 5). Furthermore, aging and physical disability are associated with increased visceral fat mass, which leads to functional limitations and cardiovascular risk (6). Similar to sarcopenia, obesity is known to be related to diabetes mellitus and CVD (i.e., ischemic heart disease and stroke) (7), which can lead to functional impairment and physical disability (8). Therefore, sarcopenia and obesity might synergistically increase their effects on physical disability, metabolic disorders, and CVD (9). The concept of sarcopenic obesity was proposed to describe the relationship between sarcopenia and obesity (10).
CVD is the leading cause of death throughout the world. The prevalence of CVD in Korea is increasing and it is currently the second most common cause of death in the single disease category after malignancy. Therefore, it is necessary to identify subjects who have increased risk of CVD and study the relationship between sarcopenic obesity and CVD to improve public health in Korea. To the best of our knowledge, only a few studies have been conducted to evaluate the association between sarcopenic obesity and the overall CVD risk in the general population. Therefore, this study was conducted to assess the relationship between sarcopenic obesity and CVD risk, as estimated by the Framingham risk score, in Korean adults using nationally representative survey data.

MATERIALS AND METHODS

Study population

This study was based on data acquired from the 5th Korea National Health and Nutrition Examination Survey conducted in 2010 (KNHANES V-1). The KNHANES has been conducted periodically since 1998 by the Korea Centers for Disease Control and Prevention (KCDC). The KNHANES is a series of cross-sectional, national health and nutrition surveys designed to provide representative prevalence estimates for a variety of health measures and conditions. The survey design is a complex, stratified, multi-stage probability sampling of the non-institutionalized civilian Korean population. These surveys have generated nationwide and representative statistical data through self-administered questionnaires regarding health and nutritional status and health behaviors.
The KCDC selected 10,938 individuals from 3,840 households; 8,598 of those subjects participated in the KNHANES V-1 surveys (response rate=81.9%). Of the 4,552 subjects aged ≥40 yr, participants who had previous diagnoses of ischemic heart disease, stroke, liver cirrhosis, or chronic kidney disease (n=300), who were receiving cancer treatment (n=76), or who were pregnant (n=54) were excluded from the study. Individuals with a low body mass index (BMI; <18.5 kg/m2) and/or incomplete anthropometric measurements or laboratory test results were also excluded (n=802). A total of 3,320 subjects (1,458 men and 1,862 women) were included in the final statistical analysis.

Anthropometric and laboratory measurements

Anthropometric data, including height, body weight, and blood pressure (BP), were obtained according to standardized guidelines. Height was measured in centimeters with the subjects in an erect position after removing footwear. Body weight was measured in kilograms with subjects dressed in light clothing. The BMI was calculated by dividing the body weight by the height squared (kg/m2). The resting BP was measured in triplicate at 5-min intervals in the seated position and the average of the 2nd and 3rd measurements was used in the analysis.
Fasting glucose, total cholesterol (T-C), high density lipoprotein cholesterol (HDL-C), and triglyceride (TG) levels were measured using the autoanalyzer (Hitachi Automatic Analyzer 7600®, Hitachi, Tokyo, Japan) after a fasting period of at least 8 hr.

Covariates and potential confounders

Korea is divided into 12 different administrative regions, which we categorized as urban and rural groups. Seoul, Gyeonggi, and 6 other metropolitan cities (Busan, Daegu, Incheon, Gwangju, Daejeon, and Ulsan) were grouped as urban areas; all other remaining regions were grouped as rural areas. The socioeconomic status was assessed based on the household equivalent income and educational level. Household equivalent income was calculated as the sum of the monthly income of all household members divided by the square root of the household size. Educational level was classified based on the number of years of schooling (i.e., ≥12 or <12 yr).
Alcohol intake was evaluated by the Alcohol Use Disorder Identification Test (AUDIT), which is used to identify individuals who have drinking problems. The AUDIT cutoff scores for problematic drinking, alcohol use disorder, and alcohol dependence were 12, 15, and 26 points, respectively (11). Resistance and flexibility exercise were marked 'yes' when the participant performed the relevant exercise for ≥1 day per week. Regular walking was defined as walking ≥30 min for ≥5 days per week.

Definition of sarcopenia and sarcopenic obesity

Dual energy X-ray absorptiometry (DXA; DISCOVERY-W fan-beam densitometer, Hologic, Inc., Bedford, MA, USA) was used for measuring body composition of the participants. Appendicular skeletal muscle mass (ASM; kg) was defined as the sum of the muscle mass in the arms and legs, assuming that all non-fat and non-bone tissues were skeletal muscles. ASM measurements were divided by the weight (Wt) and values that were <1 standard deviation (SD) below the mean of the sex-specific healthy reference group (i.e., aged 20-39 yr) from the same KNHANES V-1 database were considered sarcopenic. The cutoff point for sarcopenia was 31.30% in men and 24.76% in women. Obesity was defined as a BMI ≥25.0 kg/m2. Subsequently, subjects were further classified into 4 groups according to their sarcopenic and obesity status: the non-sarcopenic non-obese (group A; normal BMI/non-sarcopenia), sarcopenic non-obese (group B; normal BMI/sarcopenia), non-sarcopenic obese (group C; obese BMI/non-sarcopenia), and sarcopenic obese (group D; obese BMI/sarcopenia) groups.

Cardiovascular disease risk assessment

The Framingham risk score, based on the Framingham Heart Study (National Heart, Lung, and Blood Institute in Bethesda, MD, USA), was used to estimate CVD risk. Among several risk prediction models, the CVD outcome (i.e., coronary death, myocardial infarction, coronary insufficiency, angina, ischemic stroke, hemorrhagic stroke, transient ischemic attack, peripheral artery disease, and heart failure) was analyzed in this study. According to the Framingham algorithm as outlined by D'Agostino et al. (12), the risk score was calculated based on categorical values of age, sex, T-C, HDL-C, systolic BP, smoking, and diabetes. Smoking status, which was evaluated using self-reported data, was classified as "current smokers" (i.e., currently smoking) or "non-smokers" (i.e., those who had never smoked or had smoked previously but later quit). Diabetes was defined as current treatment with oral hypoglycemic agents or insulin or a fasting glucose level ≥126 mg/dL.

Statistical analysis

Statistical analyses were performed using the SPSS version 21.0 software (IBM Co., Armonk, NY, USA). All estimates were calculated based on sample weights to represent the total population of Korea and adjusted for the complex sample design of the survey. Continuous data were presented as means and standard error (SE), while categorical data were presented as frequencies and SE or 95% confidence intervals (CIs), as appropriate. The BMI and sarcopenic status were compared across groups using Student's t-test for continuous measures and the chi-square test for categorical measures. The distribution of the Framingham risk score (low, <6%; moderate, 6%-20%; high, ≥20%) according to BMI and sarcopenic status was also presented. Odds ratios (ORs) and 95% CIs for the associations between the 4 groups (i.e., groups A-D) and the high 10-yr CVD risks were estimated using multiple logistic regression analyses. All results, except those in Table 1, were divided by sex. All tests were two-sided and P values <0.05 were considered statistically significant.

Ethics statement

This study protocol was reviewed and approved by the institutional review board of Chuncheon Sacred Heart Hospital (IRB No. 2014-12). All participants in this survey signed and submitted an informed consent to KCDC.

RESULTS

The mean age, ASM/Wt, and BMI of the study population were 54.3 yr (SE=0.3), 29.5% (SE=0.1), and 24.1 kg/m2 (SE=0.1), respectively. Approximately 51.6% (n=1,862) of the study population were women. The number of subjects with an obese BMI and sarcopenia was 1,160 (35.7%) and 915 (25.8%), respectively. The number of subjects in the 4 different groups based on their BMI and sarcopenic status was as follows: 1,761 (53.6%, group A), 399 (10.7%, group B), 644 (20.6%, group C), and 516 (15.1%, group D). The prevalence of sarcopenic obesity was 13.0% in men and 17.0% in women.
The descriptive characteristics of the study population are shown in Table 1. Subjects with sarcopenia were observed to be older and had a higher frequency of being female than subjects without sarcopenia in both BMI groups (i.e., normal and obese). Subjects without sarcopenia were taller, and more likely to be smokers than those with sarcopenia, regardless of their BMI category. Individuals with a normal BMI had higher mean levels of T-C and TG, but a lower mean level of HDL-C in the sarcopenia group compared to the non-sarcopenia group. However, there were no differences in the mean levels of T-C, TG, and HDL-C between sarcopenia and non-sarcopenia categories in the obese BMI group. The total calorie and protein intakes in the sarcopenia group were lower than the non-sarcopenia group for both normal and obese participants. Groups B and D (i.e., sarcopenic groups) had higher levels of systolic BP and higher proportions of ≥20% 10-yr CVD risk than the non-sarcopenia groups (group A and C), regardless of their BMI category.
The components of the Framingham risk model for each of the sarcopenic obesity phenotype groups by sex are shown in Table 2. Compared to the other groups, group B had more participants who were ≥65 yr and the prevalence of high systolic BP was higher in group D, regardless of sex. Men in group C and women in group B had higher frequencies of high T-C levels, whereas men in both group B and D and women in group C had higher frequencies of low HDL-C levels compared to other groups. The prevalence of diabetes was higher in the sarcopenia groups than the non-sarcopenia groups for men, and was higher in the obese BMI groups than the normal BMI groups for women. For men and women, there were no significant differences in the smoking frequencies among the 4 obesity phenotype groups.
The distribution of the Framingham risk category across the sarcopenic obesity phenotype groups by sex is shown in Fig. 1. The mean 10-yr CVD risks were 15.04% (SE=0.31) in men and 7.91% (SE=0.26) in women. In both men and women, group A had the lowest risk for CVD (19.5% and 67.0%, respectively) in the <6% risk category and group D had the highest risk for CVD (43.8% and 14.6%, respectively) in the ≥20% risk category. Men with sarcopenia had a lower proportion of low risk CVD and a higher proportion of high risk CVD compared to those without sarcopenia, regardless of their BMI category. In women, there was a lower proportion of high risk CVD in group A and a lower proportion of low risk CVD in group D. However, the distribution of CVD risk was similar between groups B (normal BMI/sarcopenia) and C (obese BMI/non-sarcopenia).
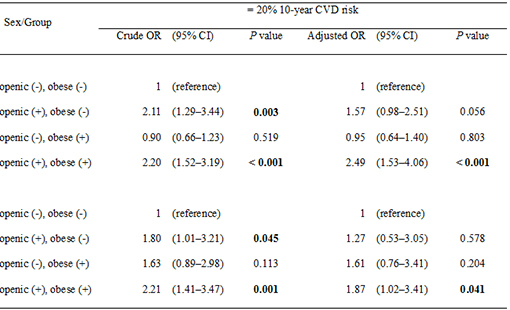
The ORs for the ≥20% 10-yr CVD risk calculated by logistic regression analyses are shown in Table 3. In the univariate analysis, the ORs of the ≥20% 10-yr CVD risk were significantly higher in group B (OR, 2.21; 95% CI, 1.29-3.44 in men and OR, 1.80; 95% CI, 1.01-3.21 in women) and group D (OR, 2.20; 95% CI, 1.52-3.19 in men and OR, 2.21; 95% CI, 1.41-3.47 in women) compared to group A. After adjusting for independent variables (i.e., total calorie intake, protein intake, resistance exercise, flexibility exercise, regular walking, equivalent income, and AUDIT score), the association between the ≥20% 10-yr CVD risk and group D remained significant (OR, 2.49; 95% CI, 1.53-4.06 in men and OR, 1.87; 95% CI, 1.02-3.41 in women), whereas no significant relationship was observed in group B.

DISCUSSION

The purpose of this study was to evaluate the relationship between sarcopenic obesity, represented by BMI and sarcopenic status, and CVD risk, as estimated by the Framingham risk score. In the representative sample of the Korean population in this study, we found that both men and women with sarcopenic obesity had a higher risk of CVD than those with a normal BMI and muscle mass. Furthermore, participants who were obese and non-sarcopenic were not significantly associated with increased CVD risk.
Several studies about the relationships between sarcopenic obesity and metabolic abnormality have been conducted. In one of these studies, it was reported that sarcopenic obesity was strongly associated with insulin resistance in both young and old adults (4). However, in the Cardiovascular Health Study, CVD risk was not significantly elevated in the obese, sarcopenic, or sarcopenic-obese groups as determined by waist circumference and muscle mass (13). These discrepancies in the findings may be due to the different approaches for assessing sarcopenic obesity and population characteristics, such as ethnic differences. Asian populations tend to have lower muscle mass with increased insulin resistance compared to Western populations. The risk for type 2 diabetes starts at a lower BMI for Asians than Europeans (14), which means that diabetes and related CVD risks might be different between these 2 populations. Furthermore, the Korean population has significantly different CVD patterns compared to Caucasians. In a study in which proportional mortality rates were examined, Koreans immigrants of the United States had significantly higher rates of stroke and lower heart disease than Caucasians born in the United States (15). Although no studies have been conducted to evaluate the relationship between sarcopenic obesity and CVD risk in the Korean population, related factors (i.e., hypertension, diabetes, and metabolic syndrome) have been reported to be closely correlated with sarcopenia or sarcopenic obesity (5, 16). In this study, we confirmed that sarcopenic obesity is closely related to an increased CVD risk in Korean adults.
Interestingly, we found that obese subjects without sarcopenia did not have increased CVD risks. BMI measurements can be easily used to assess the obesity status, which might help predict CVD risk (17). However, the BMI of muscular individuals without excess body fat may be overestimated or incorrectly categorized as obese. Obesity, as described solely on the basis of the BMI standard without considering skeletal muscle mass, was not found to be related to CVD risks in this study. Therefore, it is inappropriate to associate CVD risks with obesity based on body weight only; further studies regarding new obesity indexes that can be associated with CVD risks are required.
In the current study, men with sarcopenia had a lower proportion of low risk CVD and a higher proportion of high risk CVD compared to those without sarcopenia, regardless of their BMI category. However, the distribution of CVD risk was similar between sarcopenic non-obese and non-sarcopenic obese women, which means that the pathophysiology of CVD would be different between the sexes. Women exhibit lower BP levels during most of their life span compared to men of similar age. Although postmenopausal women have similar BP levels compared to men of similar age, premenopausal women have lower BP and a reduced incidence of CVD compared to men of similar age (18). Female sex hormones, especially estrogen, have been demonstrated to modulate the renin-angiotensin-aldosterone system and have beneficial effects on cardiovascular function through actions in not only the kidney, heart, and vasculature, but also in the central nervous system (19). In our study, men were more associated with the mean 10-yr CVD risk than women (15.04% vs. 7.91%, respectively), and sarcopenic obese men were more associated with an increased 10-yr CVD risk compared to women with sarcopenic obesity. Men lose a greater skeletal muscle mass with aging, which is highly associated with other health problems relating to sarcopenia (i.e., functional decline, decreased muscle strength, and osteoporosis) than women (20, 21). In this aspect, it is expected that women are less affected by sarcopenia relating to CVD risk than men. Therefore, at a similar BMI, the impact of sarcopenic status on CVD risk is greater in men than in women.
Several definitions of sarcopenia have been proposed in previous studies, but the height-adjusted and the weight-adjusted definitions are most widely used. Weight-adjusted sarcopenia is defined as ASM divided by the body weight (ASM/Wt; %), and height-adjusted sarcopenia is defined as ASM divided by the height squared (ASM/height2; kg/m2) (5). In a previous study conducted in Korea, the height-adjusted definition was observed to underestimate the prevalence of sarcopenia and sarcopenic obesity (22), and the weight-adjusted definition was more closely correlated with metabolic risk factors compared to the height-adjusted definition (5). The weight-adjusted definition might be a more suitable index for defining sarcopenia in the Korean population, and therefore, we selected the weight-adjusted definition for evaluating the sarcopenic status in this study.
Several mechanisms could explain the significant relationships between sarcopenic obesity and increased CVD risk. Skeletal muscle is a primary site for glucose uptake and deposition and myokine secretion, which plays a protective role against insulin resistance (4). Therefore, sarcopenia promotes insulin resistance, leading to the development of several metabolic abnormalities (i.e., diabetes and related CVDs) (23). In other studies, an increase in skeletal muscle mass through training enhances the protection against arterial stiffness and hypertension (24). To summarize, it is believed that skeletal muscle acts as a defense agent against CVD. In addition to the close relationship between obesity and CVD, adipocytokines (i.e., interleukin-6 and tumor necrosis factor-alpha) secreted from the fat mass, which increase during obesity, raise the incidence of insulin resistance and CVD (25), and worsen sarcopenia by exerting catabolic effects on muscles (26). Furthermore, muscle loss is not isolated, but is strongly associated with a parallel increase in fat mass (10). This mechanism leads to a vicious cycle between increased fat mass and muscle loss, and may act synergistically to increase CVD risks. Therefore, it is important to examine sarcopenic obesity by measuring muscle mass, which can be useful for assessing public health care.
Sarcopenic obesity and muscle loss can be used to estimate the probability of having CVD, especially for those who are at a higher risk of CVD (i.e., family history of CVD, smokers, chronic drinkers, and those lacking regular exercise). Accordingly, it is vitally important to sustain or improve muscle mass while maintaining normal body weight through physical activities and balanced nutrition. The maintenance of muscle strength and the prevention of sarcopenia are essential for successfully performing physical tasks, including activities of daily living (i.e., walking, showering, and caring for one's personal needs) (27). Moreover, resistance training could become part of the non-pharmacological intervention strategy to prevent arterial stiffness and high BP (24). Protein intake may also be a significant factor for preventing the development of sarcopenia. Inadequate dietary protein, even during a short period, can result in muscle loss despite an adequate energy intake (28). Moreover, it was reported that nutritional supplements of oral amino acid mixtures increased the whole-body lean mass and insulin sensitivity in elders with sarcopenia (29). Therefore, protein supplementation in combination with resistance exercise, enhances muscle protein synthesis and improves body composition by increasing lean mass in relation to fat mass.
The present study has several potential limitations. Firstly, the cross-sectional design of this survey limited us from identifying causal relationships. Therefore, a causal relationship between sarcopenic obesity and CVD cannot be inferred. Secondly, the CVD risk estimated by the Framingham risk score was not an actual CVD outcome. The Framingham risk model was originally applied for Western populations and therefore, it may not reflect the different genetic profiles or social and environmental factors in the Korean population. However, instead of calculating the absolute risk scores of CVD, we used the distribution of the Framingham risk score to estimate CVD risk. Thirdly, we did not measure muscle function when determining sarcopenia. In recent studies, an evaluation of the presence of low muscle mass, muscle strength, and physical performance is recommended for diagnosing sarcopenia (30). The data acquired from the KNHANES included skeletal muscle mass measurements, but not muscle function or strength. However, several adjustments were made to this study indirectly to evaluate muscle function by referring to the practice rate of resistance exercise, flexibility exercise, and regular walking during analysis. Despite these limitations, our study has several advantages. Integrated risk comparisons were not conducted in previous studies for evaluating the relationship between sarcopenic obesity and CVD risks in the Korean population. The authors of these studies mainly evaluated hypertension, insulin resistance, or metabolic syndrome, which are CVD risk factors, rather than taking direct approaches to examining CVD risks. However, we made comprehensive comparisons for CVD risks based on individual traits by using the Framingham risk model. In addition, the data used in our analysis included a large representative sample of the general population in Korea; all analyses in this study were based on sample weights and adjusted for the complex sample design of the survey.
In conclusion, sarcopenic obesity was closely associated with an increased risk of CVD. Furthermore, participants who were only obese without sarcopenia were not observed to have increased CVD risk. Given the prevalence of CVD in Korean adults, further studies are required to examine the causal relationship between sarcopenic obesity and CVD, and public health interventions are needed for developing effective methods to promote prevention and treatment of sarcopenic obesity in general practice.

Figures and Tables

Fig. 1

Framingham risk score category within sarcopenic obesity phenotype groups according to body mass index and sarcopenic status by sex (P < 0.001 across groups). Groups A (non-sarcopenic, non-obese), B (sarcopenic, non-obese), C (non-sarcopenic, obese), and D (sarcopenic, obese) are shown.

jkms-30-264-g001
Table 1

Study population characteristics by body mass index and sarcopenic status (n = 3,320)

jkms-30-264-i001
Variables Normal BMI Obese BMI
No. (Weighted %) Without sarcopenia (n = 1,761) With sarcopenia (n = 399) P value No. (Weighted %) Without sarcopenia (n = 644) With sarcopenia (n = 516) P value
Age (yr) - 53.7 ± 0.4 57.6 ± 0.7 < 0.001 - 52.6 ± 0.5 56.5 ± 0.5 < 0.001
Height (cm) - 162.0 ± 0.2 159.0 ± 0.4 < 0.001 - 163.7 ± 0.4 159.8 ± 0.5 < 0.001
Body weight (kg) - 58.6 ± 0.2 58.5 ± 0.3 0.723 - 72.0 ± 0.4 71.5 ± 0.5 0.463
BMI (kg/m2) - 22.2 ± 0.05 23.0 ± 0.1 < 0.001 - 26.8 ± 0.1 27.9 ± 0.1 < 0.001
ASM (kg) - 18.3 ± 0.1 15.3 ± 0.1 < 0.001 - 22.2 ± 0.2 18.5 ± 0.2 < 0.001
ASM/Wt (%) - 31.0 ± 0.1 25.9 ± 0.1 < 0.001 - 30.5 ± 0.1 25.7 ± 0.1 < 0.001
Total calorie intake (kcal/day) - 2,061 ± 28 1,734 ± 46 < 0.001 - 2,245 ± 50 1,867 ± 51 < 0.001
Protein intake (g/day) - 72.4 ± 1.1 61.3 ± 2.1 < 0.001 - 81.1 ± 2.3 66.5 ± 2.0 < 0.001
Systolic BP (mmHg) - 119.1 ± 0.6 122.8 ± 1.0 0.001 - 124.0 ± 0.8 127.8 ± 0.8 0.001
Diastolic BP (mmHg) - 75.2 ± 0.3 75.6 ± 0.6 0.807 - 79.7 ± 0.5 79.4 ± 0.6 0.687
Fasting plasma glucose (mg/dL) - 97.9 ± 0.7 98.7 ± 1.2 0.610 - 104.6 ± 1.6 106.3 ± 1.5 0.473
Total cholesterol (mg/dL) - 189.5 ± 1.1 199.4 ± 1.9 < 0.001 - 201.6 ± 1.9 200.8 ± 2.2 0.796
Triglyceride (mg/dL) - 133.2 ± 4.3 158.1 ± 9.7 0.024 - 177.0 ± 8.9 159.7 ± 4.1 0.093
HDL cholesterol (mg/dL) - 49.1 ± 0.3 46.9 ± 0.7 0.006 - 44.8 ± 0.4 45.3 ± 0.5 0.489
Equivalent income* ( × 104 KRW) - 245.0 ± 19.9 201.8 ± 5.5 0.032 - 250.0 ± 26.5 207.0 ± 19.5 0.194
Women 1,236 (53.6) 51.5 (1.3) 64.0 (2.4) < 0.001 626 (47.9) 40.5 (2.2) 58.1 (2.5) < 0.001
Marital status: single 26 (1.6) 1.7 (0.4) 1.1 (0.6) 0.527 16 (2.2) 2.5 (1.2) 1.9 (0.7) 0.659
Education level: <12 yr 433 (21.0) 21.6 (1.6) 18.2 (2.7) 0.223 235 (23.0) 24.9 (2.4) 20.3 (2.3) 0.130
Region: urban 1,611 (73.8) 72.8 (3.9) 78.7 (4.2) 0.139 859 (72.5) 72.7 (4.4) 72.2 (5.0) 0.897
Smoking 413 (24.3) 25.6 (1.5) 17.9 (2.4) 0.014 208 (22.2) 25.2 (2.3) 18.1 (2.0) 0.017
AUDIT score ≥12 points 366 (24.6) 26.2 (1.5) 15.7 (3.0) 0.007 220 (26.5) 28.4 (2.5) 23.8 (2.3) 0.163
Resistance exercise 553 (26.5) 27.6 (1.5) 20.7 (2.7) 0.027 296 (26.4) 28.4 (2.3) 23.7 (2.7) 0.169
Flexibility exercise 1,145 (53.1) 53.9 (2.1) 48.8 (3.5) 0.199 617 (54.8) 58.9 (2.5) 49.1 (2.7) 0.008
Regular walking 861 (39.5) 40.2 (1.8) 35.8 (3.0) 0.170 441 (38.8) 40.5 (2.5) 36.4 (2.5) 0.267
10-yr CVD risk ≥20% 458 (17.5) 16.3 (1.2) 23.2 (2.8) 0.015 297 (22.2) 18.9 (2.1) 26.8 (2.2) 0.012

Data are expressed as estimated mean±standard error or estimated percent (standard error), as appropriate. P values are from Student's t-test or chi-square test. *Equivalent income=monthly household income/√family size. ASM, appendicular skeletal muscle mass; AUDIT, alcohol use disorder identification test; BMI, body mass index; BP, blood pressure; CVD, cardiovascular disease; HDL, high density lipoprotein; Wt, body weight.

Table 2

Prevalence of components of the Framingham risk model for sarcopenic obesity phenotype groups by sex

jkms-30-264-i002
Parameters by sex Group A Group B Group C Group D P value
Men (n = 1,458) (n = 778) (n = 146) (n = 350) (n = 184)
 Age ≥ 65 yr 17.5 (14.8-20.6) 27.1 (20.4-35.0) 8.2 (6.0-11.3) 16.7 (12.1-22.5) < 0.001
 Total cholesterol ≥160 mg/dL 78.4 (74.9-81.6) 87.9 (82.0-92.0) 91.3 (87.5-94.0) 82.4 (74.7-88.2) < 0.001
 HDL cholesterol <45 mg/dL 41.7 (37.2-46.4) 66.4 (56.3-75.2) 60.5 (53.9-66.6) 66.7 (57.0-75.2) < 0.001
 High systolic BP* 28.5 (24.6-32.8) 37.3 (28.6-46.9) 36.6 (30.9-42.8) 54.1 (45.3-62.6) < 0.001
 Diabetes 11.6 (8.9-15.0) 17.3 (11.2-25.8) 11.8 (8.5-16.3) 25.2 (17.3-35.3) 0.002
 Smoker 47.5 (42.7-52.4) 36.1 (27.2-46.1) 39.0 (32.8-45.6) 40.5 (32.9-48.7) 0.051
Women (n = 1,862) (n = 983) (n = 253) (n = 294) (n = 332)
 Age ≥ 65 yr 18.4 (15.5-21.6) 31.0 (23.8-39.2) 20.2 (15.2-26.3) 29.3 (24.0-35.1) < 0.001
 Total cholesterol ≥160 mg/dL 82.5 (79.0-85.6) 94.2 (90.3-96.6) 86.0 (79.8-90.5) 88.5 (83.3-92.3) 0.001
 HDL cholesterol <45 mg/dL 29.7 (26.0-33.7) 37.7 (30.3-45.7) 50.1 (43.3-56.8) 38.1 (32.6-44.0) < 0.001
 High systolic BP* 26.6 (23.0-30.5) 38.0 (30.8-45.8) 43.7 (36.8-50.8) 55.0 (49.0-60.8) < 0.001
 Diabetes 6.7 (5.2-8.6) 9.6 (5.9-15.1) 17.2 (11.6-24.6) 17.1 (13.1-22.0) < 0.001
 Smoker 4.9 (3.4-7.1) 7.7 (4.1-13.8) 4.9 (2.5-9.6) 1.9 (0.7-4.7) 0.082

Group A (non-sarcopenic, non-obese): 18.5≤body mass index (BMI)<25.0 kg/m2 and appendicular skeletal muscle mass/weight (ASM/Wt)≥31.30% in men or ≥24.76% in women. Group B (sarcopenic, non-obese): 18.5≤BMI<25.0 kg/m2 and ASM/Wt<31.30% in men or <24.76% in women. Group C (non-sarcopenic, obese): BMI≥25.0 kg/m2 and ASM/Wt≥31.30% in men or ≥24.76% in women. Group D (sarcopenic, obese): BMI≥25.0 kg/m2 and ASM/Wt<31.30% in men or <24.76% in women. All data are expressed as estimated percentages (95% confidence intervals). P values are from the chi-square test. *Systolic blood pressure≥130 mmHg in individuals without hypertension treatments or ≥120 mmHg in individuals with hypertension treatment. BP, blood pressure; HDL, high density lipoprotein.

Table 3

Ten-year cardiovascular disease risk calculated by Framingham model and sarcopenic obesity phenotype groups by sex

jkms-30-264-i003
Sex/Group ≥ 20% 10-yr CVD risk
Crude OR (95% CI) P value Adjusted OR* (95% CI) P value
Men
 Group A 1 (reference) 1 (reference)
 Group B 2.11 (1.29-3.44) 0.003 1.57 (0.98-2.51) 0.056
 Group C 0.90 (0.66-1.23) 0.519 0.95 (0.64-1.40) 0.803
 Group D 2.20 (1.52-3.19) < 0.001 2.49 (1.53-4.06) < 0.001
Women
 Group A 1 (reference) 1 (reference)
 Group B 1.80 (1.01-3.21) 0.045 1.27 (0.53-3.05) 0.578
 Group C 1.63 (0.89-2.98) 0.113 1.61 (0.76-3.41) 0.204
 Group D 2.21 (1.41-3.47) 0.001 1.87 (1.02-3.41) 0.041

Group A (non-sarcopenic, non-obese): 18.5≤body mass index (BMI)<25.0 kg/m2 and appendicular skeletal muscle mass/weight (ASM/Wt)≥31.30% in men or ≥24.76% in women. Group B (sarcopenic, non-obese): 18.5≤BMI<25.0 kg/m2 and ASM/Wt<31.30% in men or <24.76% in women. Group C (non-sarcopenic, obese): BMI≥25.0 kg/m2 and ASM/Wt≥31.30% in men or ≥24.76% in women. Group D (sarcopenic, obese): BMI≥25.0 kg/m2 and ASM/Wt<31.30% in men or <24.76% in women. *Adjusted for total calorie intake, protein intake, resistance exercise, flexibility exercise, regular walking, equivalent income, and alcohol use disorder identification test score category. CI, confidence interval; CVD, cardiovascular disease; OR, odds ratio.

Notes

The authors have no conflicts of interest to disclose.

Conception and coordination of the study: Kim JH, Park YS. Design of ethical issues: all authors. Acquisition of data: Kim JH, Cho JJ. Data review: Kim JH, Cho JJ. Statistical analysis: Kim JH, Park YS. Manuscript preparation: Kim JH, Cho JJ. Manuscript approval: all authors.

References

1. Grimby G, Saltin B. The ageing muscle. Clin Physiol. 1983; 3:209–218.
2. Rosenberg IH. Sarcopenia: origins and clinical relevance. Clin Geriatr Med. 2011; 27:337–339.
3. Kim JH, Choi SH, Lim S, Yoon JW, Kang SM, Kim KW, Lim JY, Cho NH, Jang HC. Sarcopenia and obesity: gender-different relationship with functional limitation in older persons. J Korean Med Sci. 2013; 28:1041–1047.
4. Srikanthan P, Hevener AL, Karlamangla AS. Sarcopenia exacerbates obesity-associated insulin resistance and dysglycemia: findings from the National Health and Nutrition Examination Survey III. PLoS One. 2010; 5:e10805.
5. Lim S, Kim JH, Yoon JW, Kang SM, Choi SH, Park YJ, Kim KW, Lim JY, Park KS, Jang HC. Sarcopenic obesity: prevalence and association with metabolic syndrome in the Korean Longitudinal Study on Health and Aging (KLoSHA). Diabetes Care. 2010; 33:1652–1654.
6. Visser M, Langlois J, Guralnik JM, Cauley JA, Kronmal RA, Robbins J, Williamson JD, Harris TB. High body fatness, but not low fat-free mass, predicts disability in older men and women: the Cardiovascular Health Study. Am J Clin Nutr. 1998; 68:584–590.
7. Kang IS, Pyun WB, Shin J, Kim JH, Kim SG, Shin GJ. Association between central obesity and circadian parameters of blood pressure from the korean ambulatory blood pressure monitoring registry: Kor-ABP registry. J Korean Med Sci. 2013; 28:1461–1467.
8. Chin SO, Rhee SY, Chon S, Hwang YC, Jeong IK, Oh S, Ahn KJ, Chung HY, Woo JT, Kim SW, et al. Sarcopenia is independently associated with cardiovascular disease in older Korean adults: the Korea National Health and Nutrition Examination Survey (KNHANES) from 2009. PLoS One. 2013; 8:e60119.
9. Stenholm S, Harris TB, Rantanen T, Visser M, Kritchevsky SB, Ferrucci L. Sarcopenic obesity: definition, cause and consequences. Curr Opin Clin Nutr Metab Care. 2008; 11:693–700.
10. Roubenoff R. Sarcopenic obesity: does muscle loss cause fat gain? Lessons from rheumatoid arthritis and osteoarthritis. Ann N Y Acad Sci. 2000; 904:553–557.
11. Kim JS, Oh MK, Park BK, Lee MK, Kim GJ. Screening criteria of alcoholism by alcohol use disorders identification test(AUDIT) in Korea. J Korean Acad Fam Med. 1999; 20:1152–1159.
12. D'Agostino RB Sr, Vasan RS, Pencina MJ, Wolf PA, Cobain M, Massaro JM, Kannel WB. General cardiovascular risk profile for use in primary care: the Framingham Heart Study. Circulation. 2008; 117:743–753.
13. Stephen WC, Janssen I. Sarcopenic-obesity and cardiovascular disease risk in the elderly. J Nutr Health Aging. 2009; 13:460–466.
14. Chan JC, Malik V, Jia W, Kadowaki T, Yajnik CS, Yoon KH, Hu FB. Diabetes in Asia: epidemiology, risk factors, and pathophysiology. JAMA. 2009; 301:2129–2140.
15. Stellman SD. Proportional mortality ratios among Korean immigrants to New York City, 1986-1990. Yonsei Med J. 1996; 37:31–37.
16. Moon SS. Low skeletal muscle mass is associated with insulin resistance, diabetes, and metabolic syndrome in the Korean population: the Korea National Health and Nutrition Examination Survey (KNHANES) 2009-2010. Endocr J. 2014; 61:61–70.
17. Satoh H, Kishi R, Tsutsui H. Body mass index can similarly predict the presence of multiple cardiovascular risk factors in middle-aged Japanese subjects as waist circumference. Intern Med. 2010; 49:977–982.
18. Ong KL, Tso AW, Lam KS, Cheung BM. Gender difference in blood pressure control and cardiovascular risk factors in Americans with diagnosed hypertension. Hypertension. 2008; 51:1142–1148.
19. Xue B, Johnson AK, Hay M. Sex differences in angiotensin II- and aldosterone-induced hypertension: the central protective effects of estrogen. Am J Physiol Regul Integr Comp Physiol. 2013; 305:R459–R463.
20. Dey DK, Bosaeus I, Lissner L, Steen B. Changes in body composition and its relation to muscle strength in 75-year-old men and women: a 5-year prospective follow-up study of the NORA cohort in Göteborg, Sweden. Nutrition. 2009; 25:613–619.
21. Kim S, Won CW, Kim BS, Choi HR, Moon MY. The Association between the Low Muscle Mass and Osteoporosis in Elderly Korean People. J Korean Med Sci. 2014; 29:995–1000.
22. Kim YS, Lee Y, Chung YS, Lee DJ, Joo NS, Hong D, Song G, Kim HJ, Choi YJ, Kim KM. Prevalence of sarcopenia and sarcopenic obesity in the Korean population based on the Fourth Korean National Health and Nutritional Examination Surveys. J Gerontol A Biol Sci Med Sci. 2012; 67:1107–1113.
23. Yip J, Facchini FS, Reaven GM. Resistance to insulin-mediated glucose disposal as a predictor of cardiovascular disease. J Clin Endocrinol Metab. 1998; 83:2773–2776.
24. Figueroa A, Park SY, Seo DY, Sanchez-Gonzalez MA, Baek YH. Combined resistance and endurance exercise training improves arterial stiffness, blood pressure, and muscle strength in postmenopausal women. Menopause. 2011; 18:980–984.
25. Bahceci M, Gokalp D, Bahceci S, Tuzcu A, Atmaca S, Arikan S. The correlation between adiposity and adiponectin, tumor necrosis factor alpha, interleukin-6 and high sensitivity C-reactive protein levels. Is adipocyte size associated with inflammation in adults? J Endocrinol Invest. 2007; 30:210–214.
26. Cesari M, Kritchevsky SB, Baumgartner RN, Atkinson HH, Penninx BW, Lenchik L, Palla SL, Ambrosius WT, Tracy RP, Pahor M. Sarcopenia, obesity, and inflammation--results from the Trial of Angiotensin Converting Enzyme Inhibition and Novel Cardiovascular Risk Factors study. Am J Clin Nutr. 2005; 82:428–434.
27. Li Z, Heber D. Sarcopenic obesity in the elderly and strategies for weight management. Nutr Rev. 2012; 70:57–64.
28. Campbell WW, Trappe TA, Wolfe RR, Evans WJ. The recommended dietary allowance for protein may not be adequate for older people to maintain skeletal muscle. J Gerontol A Biol Sci Med Sci. 2001; 56:M373–M380.
29. Solerte SB, Gazzaruso C, Bonacasa R, Rondanelli M, Zamboni M, Basso C, Locatelli E, Schifino N, Giustina A, Fioravanti M. Nutritional supplements with oral amino acid mixtures increases whole-body lean mass and insulin sensitivity in elderly subjects with sarcopenia. Am J Cardiol. 2008; 101:69E–77E.
30. Cruz-Jentoft AJ, Baeyens JP, Bauer JM, Boirie Y, Cederholm T, Landi F, Martin FC, Michel JP, Rolland Y, Schneider SM, et al. European Working Group on Sarcopenia in Older People. Sarcopenia: European consensus on definition and diagnosis: Report of the European Working Group on Sarcopenia in Older People. Age Ageing. 2010; 39:412–423.
TOOLS
ORCID iDs

Jeong-Hyeon Kim
https://orcid.org/http://orcid.org/0000-0002-8889-4437

Jung Jin Cho
https://orcid.org/http://orcid.org/0000-0001-8871-8858

Yong Soon Park
https://orcid.org/http://orcid.org/0000-0002-8926-9836

Similar articles