

 PDF
PDF ePub
ePub Citation
 Print
Print


INTRODUCTION
The prevalence of obesity is increasing in all age groups, including older persons (1). Along with an increased risk of cardiovascular disease, diabetes, and several cancers, obesity is associated with an increased risk of physical and cognitive disability (2, 3). In older people, obesity contributes to early onset of functional impairment. Al Snih et al. (4) found that the relationship between body mass index (BMI) and subsequent activities of daily living was curvilinear. The most favorable hazard ratio for disability-free life expectancy was among participants with a BMI between 25.0 and 29.9 kg/m2. Therefore, identification of potentially modifiable factors associated with obesity development is important in order to prevent disability in older adults.
A decrease in sleep duration and quality are associated with adverse health outcomes. Sleep issues and disruptions in sleep patterns, relatively common in the older population, frequently manifest themselves in decreased total sleep time and sleep efficiency, and increased wake after sleep onset (WASO) (5). A good night's sleep is dependent on a sufficient amount of deep sleep and sleep efficiency, i.e. total sleep time divided by time in bed, of ≥ 85% (6). Furthermore, the quality of sleep declines with age, with a major reduction in the duration of slow wave sleep and increased sleep fragmentation (7). Adequate sleep quality and quantity are important for the normal functioning of daily metabolic and hormonal processes, and appetite regulation (8). These factors may contribute to energy dysregulation that leads to weight gain and obesity. Several epidemiological studies have evaluated the association between sleep duration and obesity (9, 10). It has been suggested that sleep duration is a cause of, or a solution to the obesity. However, the importance of other aspects of sleep quality, such as sleep efficiency and wake after sleep onset, remain relatively unexplored in older adults.
In recent years, a few studies have shown an association between specific sleep quality and overweight/obesity, or its proxy measure of high BMI (11, 12, 13). It is associated with several potentially modifiable lifestyle factors, such as smoking, alcohol consumption, and physical inactivity. However, these studies have primarily utilized self-reported measures of sleep. Van Den Berg et al. (14) reported that objective and subjective measures frequently do not match in a large sample of normal, healthy older adults. In addition, there is a need to objectively assess the measured daily physical activity. Despite currently being the fastest growing segment of Japan's population, information on sleep and obesity in this age group is limited. Hence, this study aimed to examine the association between objective measures of sleep quality and obesity in community-dwelling Japanese adults aged ≥80 yr. In this study, we used wrist actigraphy, which is relatively unobtrusive and enabled the participants to remain in their natural environment and adhere to their normal sleep and physical activity habits. It was hypothesized that sleep quality would be associated with obesity, after adjustment for potentially confounding factors, including objectively measured daily physical activity.
MATERIALS AND METHODS
Participants
Subjects were recruited from among the participants of a comprehensive health survey conducted in 2012 by the Tokyo Metropolitan Institute of Gerontology (TMIG) on community-dwelling adults aged ≥80 yr, in the area of Itabashi ward in metropolitan Tokyo. A total of 1,049 people participated in the follow-up survey in 2 cohorts (15, 16). The recruitment brochure was mailed to 396 individuals who were randomly selected to participate in this study (183 men and 213 women). The exclusion criteria were as follows: having depressive symptoms (Mini-International Neuropsychiatric Interview and Self-Rating Depression Scale score of >50), or having a sleep disorder (self-reported potential symptoms of insomnia or apnea, and current use of sleep or psychotropic medications). In all, we received 250 responses to mailed invitation letters from potential participants. There were complete data on body composition and objectively measured sleep quality (from February to April 2013) for 217 of the 226 respondents who agreed to participate in our study. Of these, 25 individuals had a BMI <18.5 kg/m2. Three participants with fewer than 5 days of valid data were excluded. Thus, our sample comprised 189 participants (88 men and 101 women).
Measurement of anthropometric and body compositions
Height and body weight were measured to the nearest 0.1 cm or 0.1 kg, respectively, with subjects wearing light garments. BMI was computed as weight divided by height squared (kg/m2). We defined obesity as a BMI of ≥25 kg/m2 (17, 18). The body composition was measured by using segmental multi-frequency bioelectrical impedance analysis (SMF-BIA; InBody 720, Biospace Co. Ltd, Seoul, Korea). In accordance with the manufacturer's guidelines, subjects wiped the bottom of their feet with a proprietary electrolyte tissue before standing on the electrodes embedded in the scale platform of the analyzer. The subjects were instructed to stand upright and to grasp the handles of the analyzer, thereby providing contact with a total of 8 electrodes (2 for each foot and hand). In our prior work, the within-day coefficient variances for 6 different frequencies evaluated in 9 subjects were 0%-1.9% (19). Percentage body fat and appendicular lean mass (ALM) were also ascertained with the SMF-BIA. ALM was calculated as the sum of the lean mass of both the right and left arms and legs, with the assumption that all non-fat and non-bone tissue was skeletal muscle. We used ALM divided by height (ALM/Ht2) and ALM divided by BMI (ALM/BMI) in our subsequent analysis.
Assessment of sleep and physical activity
Sleep and physical activity were assessed by using a triaxial accelerometer (GT3X+, ActiGraph, LLC, Pensacola, FL, USA), a small (4.6×3.3×1.5 cm, 19 g) easy-to-wear device that yields valid estimates of physical activity in controlled and free-living environments (20, 21). It also offers the possibility of recording and scoring sleep/wake patterns during the night (22). The ability to collect valid data on all 3 behaviors contemporaneously by using a single accelerometer is important because it may improve our understanding of behavioral inter-relationships and reduce the burden on subjects. Participants wore an accelerometer on their non-dominant wrist 24 hr per day over 8 consecutive days (7 nights), except when bathing or involved in water activities. They also recorded the times they went to bed each night, woke up each morning, and removed the device every day.
Data were processed by using the ActiLife Version 6.9.2 software (Pensacola, FL, USA), which provides the following 2 different algorithms for sleep scoring: the Sadeh algorithm (23) and Cole-Kripke algorithm (24). We used the latter algorithm, previously validated in a sample of older adults. The ActiLife device was initialized to collect data, and it automatically scored sleep in 60-s epochs at 80 Hz. The following variables were analyzed: total sleep time (minutes slept between bedtime and wake time), total counts, sleep efficiency (percentage of time asleep while in bed), WASO (minutes awake between sleep onset and wake time), and number of awakenings. For physical activity, non-wear time was determined by using a modified Choi algorithm (25). In this algorithm, 90 consecutive minutes of zero counts with a 2-min spike tolerance constituted non-wear, if zero counts are detected during both the 30 min upstream and downstream from that interval. Since the cut-off for wrist-worn ActiGraphs in older adults has not been established, we used the mean count per minute of vector magnitude (daily total counts divided by valid wear-time) as an index of physical activity.
Other measures
To obtain demographic information, participants were interviewed about their age, education, living conditions, smoking and drinking habits, comorbidities, and health-related information. The sum of 11 self-reported, physically diagnosed chronic diseases (hypertension, stroke, diabetes mellitus, hyperlipidemia, angina, myocardial infarction, arrhythmia, osteoporosis, hip fracture, and anemia) was calculated from individual disease-based questions. Cognitive function was assessed with the Mini Mental State Examination (MMSE). MMSE scores range from 0 to 30, with higher scores indicating better cognitive performance. Instrumental activities of daily living were measured with a 5-item instrumental self-maintenance subscale from the TMIG-Index of Competence (TMIG-IC). Napping was assessed via a standardized interview. Participants were asked, "During the past month, how many hours did you nap during a typical day?" Those who responded that involuntary urine leakage episodes occurred more than once per week were defined as having urinary incontinence. Two items from the Center for Epidemiologic Studies Depression scale were used to assess exhaustion: 1) "I felt that everything I did was an effort" and 2) "I could not get going." The subjects were asked, "How often in the last week did you feel this way?", and the response options were as follows: 0="rarely or none of the time (<1 day)", 1="some or little of the time (1-2 days)", 2="a moderate amount of the time (3-4 days)", or 3="most of the time (5-7 days)". Subjects who answered one or more for either of these questions were classified as positive for exhaustion.
Statistical analysis
The study population characteristics were analyzed by using descriptive statistics, including mean±standard deviation (SD), and frequency. Differences in clinical characteristics, sleep parameters, and physical activity between normal weight and obese subjects were tested via independent t-tests and chi-square tests. The associations between BMI and quality of sleep were evaluated by using Pearson's correlation coefficients. Sleep parameters were categorized as total sleep time (<6, 6-8, and ≥8 hr), sleep efficiency (<85% and ≥85%), WASO (≥60 min and <60 min), and napping duration (≥60 min and <60 min) (5, 26, 27). Logistic regression was used to assess the association between sleep parameters and the risk of obesity, and results are presented as odds ratios (OR) with 95% confidence intervals (CI). Model 1 was adjusted for age. Model 2 was adjusted for age, sex. Model 3 was adjusted for age, sex, education, living alone, smoking, drinking, exhaustion, number of diseases, cognitive function (MMSE score), disability, and daily physical activity. In addition, after adjustments for age and sex, the associations between indicators of body composition, physical activity, and quality of sleep were evaluated using Spearman's rank correlation coefficients. Statistical analyses were performed by using the IBM SPSS Statistics 20 package. All P values were 2-tailed, with values <0.05 considered statistically significant.
Ethics statement
Before tests were conducted, subjects were assured of their anonymity in the management of study data and reporting of results. They read and signed the informed consent forms, which were approved by the relevant institutional review board. The Clinical Research Ethics Committee of the TMIG approved the study protocol (No. 033).
RESULTS
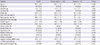
The clinical characteristics of the study population are shown in Table 1. A total of 47 subjects (24.9%) had a BMI of ≥25 kg/m2, and they were thus classified as obese. The average BMI of our study population was 23.1 kg/m2. Mean age was 83.4±2.5 yr (range 80-95), and 53.4% were women. There were no significant differences in age and education between the 2 groups. Subjects with obesity had significantly higher percentage fat mass, ALM, and ALM/Ht2 than normal weight subjects. However, ALM/BMI was significantly lower in those with obesity than in those with normal weight. The number of diseases reported was not significantly different between the 2 groups. Subjects with obesity had a higher tendency prevalence of hypertension compared with normal weight subjects.
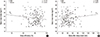
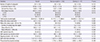
Table 2 shows a comparison of sleep parameters and physical activity between the 2 groups. Accelerometer data were collected for an average of 6.4±0.6 nights. With regard to total sleep time, 25.9% of the subjects had <6 hr a night, and 10.1% had >8 hr a night. There was no significant difference in total sleep time between the 2 groups. Subjects with obesity had higher average total counts in bedtime than the subjects with normal weight. Those with obesity had longer WASO and lower sleep efficiency than those with normal weight. In addition, sleep quality, such as lower sleep efficiency (<85%) and more nocturnal awakenings (WASO ≥60 min), were significant difference between the 2 groups. Average nap duration for those who napped was 52.5±29.9 min. There was no significant difference in average nap duration between the 2 groups. The overall physical activity was 1,744.2±489.2 counts per minute per day. The correlations between BMI and sleep quality are shown in Fig. 1. Sleep efficiency showed a significant negative correlation with BMI. In contrast, WASO had a significant positive correlation with BMI. In addition, total counts in bedtime and daily physical activity correlated slightly with BMI (r=0.127, P=0.083, and r=-0.129, P=0.077, respectively). However, there was no association between total sleep time and BMI (data not shown).
Associations between sleep parameters and obesity are shown in Table 3. Sleep quality, including poor sleep efficiency and greater WASO, were associated with an increased risk of obesity in the models adjusted for age, age and sex, and in multivariate models. In multivariate models, those with a sleep efficiency <85% had a 2.85-fold increased odds of obesity, compared with those with a sleep efficiency of ≥85%. Similarly, those with a WASO of ≥60 min had a 3.13-fold increased odds of obesity, compared with those with a WASO of <60 min. However, there were no significant associations between total sleep time and self-reported napping duration.
Our subsequent analysis, after adjusting for age and sex, found partial correlation coefficients among indicators of body composition, sleep, and physical activity, as presented in Table 4. Sleep quality was significantly associated with percentage fat mass and ALM/BMI, with the exception of ALM/ht2. There were no association between total sleep time and indicators of body composition. Daily physical activity significantly correlated with percentage fat mass. However, daily physical activity was not associated with indicators of ALM.
DISCUSSION
To the best of my knowledge, this is the first study carried out on the association between objective measures of sleep quality and obesity in community-dwelling Japanese adults aged 80 yr or older. The present study supported the hypothesis that both lower sleep efficiency and greater WASO (i.e. poor sleep quality) were independently associated with a higher risk of obesity in the oldest old. These associations remained after adjustment for potentially confounding factors, including daily physical activity. In addition, we did not find any associations between sleep duration and obesity in our study population. The findings suggest that sleep quality might be a more important modifiable factor than sleep duration in the development of obesity in the oldest old.
Previous meta-analysis studies have showed that short sleep duration is associated with an increased risk of obesity (9, 10). However, Nielsen et al. concluded that while short sleep duration is consistently associated with development of obesity in children and young adults, the findings were less consistent in older adults (10). Furthermore, data from the National Health and Nutrition Examination Survey suggested that although obesity was associated with reduced self-reported sleep durations in younger adults, no relationship existed in those over 50 yr of age (28). In both the Osteoporotic Fractures in Men Study and the Study of Osteoporotic Fractures cohorts, Patel et al. (29) found that older men and women with reduced amounts of sleep as measured by using wrist actigraphy, had an elevated BMI. These results showed that nightly sleep duration of less than 5 hr, compared to an average of 7-8 hr, was associated with a BMI that was, on average, 2.5 kg/m2 greater in men, and 1.8 kg/m2 greater in women, after adjusting for multiple risk factors and medical conditions. Similarly, Van den Berg et al. reported a marked U-shaped association of actigraphic measures of sleep duration with BMI and obesity in a cross-sectional study of 983 elderly community-dwelling Dutch people, i.e. an increased risk of obesity for both long and short sleepers when measured objectively (30). Validation studies of self-reported sleep show evidence of systematic bias as responses often lead to overestimation of the amount of sleep compared to the measurement made by using actigraphy (31). Thus, short as well as long sleep by objectively measuring sleep durations increases the risk of a high BMI in older adults. However, the present study did not find any association between sleep duration (<6 hr and >8 hr) and being obesity. Also, a subanalysis of our study showed that no association between categories of sleep duration (<5 hr and ≥8 hr) and obesity. The differences in our findings are most likely attributable to the age group studied or other factors. A close association between sleep duration and BMI in the oldest old may be different from that in the general older population. Further studies are needed to investigate the possible gender and age effects on the relationship between objectively measured sleep durations and BMI in older adults.
Our findings suggest that poor quality of sleep was independently associated with a higher risk of obesity in the oldest old. This study is one of the first to analyze the association between sleep quality and BMI by using wrist actigraphy in order to objectively measure sleep parameters of adults aged 80 yr or older in an uncontrolled environment. Our study found that poor sleep efficiency and greater wake time after sleep onset were associated with an increased risk of obesity. These associations remained, even after adjustment for potentially confounding factors, including daily physical activity. Our findings stand in contrast to a previous study on the association between sleep quality and BMI in the oldest old. Yan et al. (32) observed the association between sleep quality and BMI in 870 elderly Chinese community dwellers (>90 yr). They found that the difference in BMI between subjects with good and poor sleep quality was not significant in their cohort. However, their study used subjective sleep parameter reporting, the Pittsburgh Sleep Quality Index (PSQI). A validation study carried out on 956 community-dwelling elderly persons (aged 59 to 97 yr) reported sex differences in self-reported (PSQI) and actigraphic sleep parameters (33). This study found that women reported shorter total sleep time, lower sleep efficiency, and worse global sleep quality, compared to men. However, when assessed with actigraphy, women had a longer sleep time and higher sleep efficiency than men, revealing a bias by using the PSQI in elderly women. Similarly, Unruh et al. (34) found that older people (≥80 yr) were significantly less likely to report feeling unrested, overly sleepy, or to report not having enough sleep, as compared to polysomnography. These findings also showed that trends in sleep time, sleep efficiency, and sleep stages continue in people aged 80 yr and older, and changes can be described specifically according to decades of age.
Poor sleep quality has been considered a potential predictor of obesity in older adults in published literature, and our study extends this research into sleep and obesity. Adequate sleep quality and quantity are important for the normal functioning of daily metabolic and hormonal processes, and appetite regulation (8). The mechanisms underlying the relationship between sleep quality and obesity are unclear. The central mechanism linking short sleep and risk of obesity proposed by Knutson et al. (35) is based on the theory that sleep deprivation leads to altered glucose metabolism, possibly lower energy expenditure, and to lower circulating levels of leptin and higher levels of ghrelin. We found that those with a WASO of >60 min had a 3.13-fold increased odds of being obesity. Similarly, Van den Berg et al. (30) observed that a highly fragmented sleep (poor sleep quality) is associated with a higher BMI and a higher risk of obesity. Sleep fragmentation led to an increase in morning cortisol levels and a shift in sympathovagal balance toward an increase in sympathetic nervous system activity without a change in systemic inflammation markers or serum adipokines, while maintaining normal sleep duration (36). This represents an intermediate mechanism linking sleep fragmentation and glucose metabolism. Thus, their findings support the hypothesis that increases in sympathetic nervous system and adrenocortical activity are likely to mediate the adverse metabolic effects of poor sleep quality, independent of sleep duration. Taken together, frequent arousals during sleep may possibly diminish the regulation of glucose metabolism. Further research to understand the biological mechanisms involved is needed to better assess the potential for interventions targeting sleep quality as a means of combating obesity in older adults.
The findings of the present study should be considered in relation to several limitations. First, study participants were generally healthy older adults who had no depressive symptoms or sleep disorders, and had to be mobile enough to commute to the study center. Therefore, the generalizability of the findings to other populations of older adults may be limited to a relatively small number of subjects. In addition, wrist actigraphy does not perfectly measure sleep parameters, when compared with the gold standard of polysomnography. However, a single-night polysomnography may not provide representative data on general sleep quality. ActiGraph, which estimates sleep based on arm movement by using multidirectional accelerometers that measure activity counts per epoch, is considered non-invasive and easy to use. It can also be worn for many days, and is not thought to alter sleep as no "first-night effects" are seen (37). Finally, the cross-sectional study design precludes the establishment of causal relationship between different weight statuses and sleep quality.
In conclusion, poor sleep quality was independently associated with a higher risk of obesity in community-dwelling Japanese adults aged 80 yr or older, even after controlling for potentially confounding factors, including daily physical activity. The findings suggest that in the oldest sleep quality might be a more important modifiable factor associated with the development of obesity than sleep duration. In addition, improvements in sleep habits should be included as a part of interventions to prevent obesity in older individuals. Further studies are needed to identify a cause-and-effect relationship between poor sleep quality and obesity, as well as to determine interventions for targeting sleep quality as a means to combat obesity in older adults.


 XML Download